

Abstract
The novel coronavirus disease (COVID‐19) poses a serious threat to global public health and economics. Serial interval (SI), time between the onset of symptoms of a primary case and a secondary case, is a key epidemiological parameter. We estimated SI of COVID‐19 in Shenzhen, China based on 27 records of transmission chains. We adopted three parametric models: Weibull, lognormal and gamma distributions, and an interval‐censored likelihood framework. The three models were compared using the corrected Akaike information criterion (AICc). We also fitted the epidemic curve of COVID‐19 to the logistic growth model to estimate the reproduction number. Using a Weibull distribution, we estimated the mean SI to be 5.9 days (95% CI: 3.9–9.6) with a standard deviation (SD) of 4.8 days (95% CI: 3.1–10.1). Using a logistic growth model, we estimated the basic reproduction number in Shenzhen to be 2.6 (95% CI: 2.4–2.8). The SI of COVID‐19 is relatively shorter than that of SARS and MERS, the other two betacoronavirus diseases, which suggests the iteration of the transmission may be rapid. Thus, it is crucial to isolate close contacts promptly to effectively control the spread of COVID‐19.
Keywords: basic reproduction number, coronavirus disease, COVID‐19, outbreak, serial interval, Shenzhen
1. INTRODUCTION
The coronavirus disease 2019 (COVID‐19), caused by severe acute respiratory syndrome coronavirus 2 (SARS‐CoV‐2) has been responsible for 96,274 confirmed cases and 3,304 deaths as of 5 March 2020 since it started at the end of 2019 in Wuhan, China (National Health Commission of the People's Republic of China, 2020). The symptomatic cases presented with atypical pneumonia, with a high mortality rate of ~17% among severe cases. Common symptoms of the infection include fever, cough and shortness of breath (Guan et al., 2020; Li et al., 2020). The cases in the epicentre Wuhan City and Hubei Province accounted for 60.96% and 83.48% of the national total, respectively.
Mathematical epidemic models have been widely used to estimate the spread and other health outcomes of COVID‐19, as well as the disease burden. These models depend on the knowledge of key transmission parameters. One of the most important parameters estimated is the serial interval (SI). The SI is the time between the onset of symptoms of the infector and the infectee in a transmission chain. The serial interval is important because it is commonly used to approximate generation interval (GI; time between infection timing of primary cases and secondary cases) which is non‐observable. With the distribution of GI and the time‐varying reproduction number (how many secondary cases caused by a typical primary case during its period of infectivity), the whole course of the epidemic is determined. Conventionally, SI is used to approximate GI, but GI is strictly positive. This is widely used in analysing epidemics of infectious disease including influenza, measles, Zika virus and Ebola virus (Archer, Tempia, White, Pagano, & Cohen, 2012; Black & Ross, 2013; Cowling, Fang, Riley, Malik Peiris, & Leung, 2009; Orellano, Reynoso, Grassi, Palmieri, & Carlino, 2012; Te Beest et al., 2014; Yom‐Tov, Johansson‐Cox, Lampos, & Hayward, 2015; Zhou, Li, & Uyeki, 2019).
From 19 January to 22 February 2020, the total number of COVID‐19 cases in Shenzhen was 417 (Figure 1) (Shenzhen Municipal Health Commission, 2020). The aim of our study was to estimate the serial interval of COVID‐19 in Shenzhen based on public surveillance data and then to estimate the basic reproduction number of COVID‐19 in Shenzhen, Guangdong, in the southern part of China, with a much different population age structure and climate from the epicentre Wuhan, Hubei, China. The median age of the Chinese population is about 38.4 while that of Shenzhen is 30.
FIGURE 1.
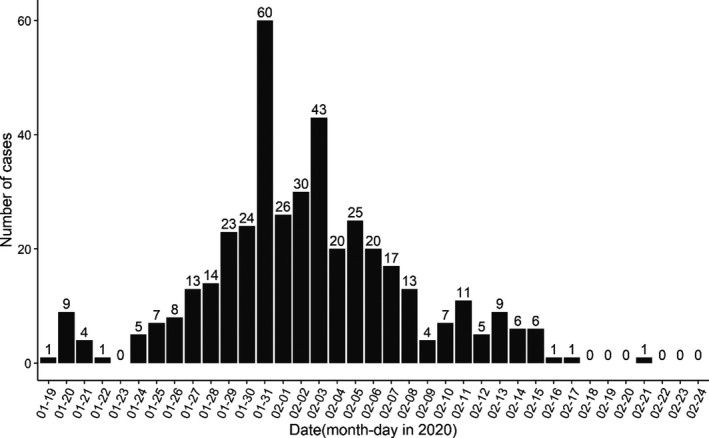
Daily number of COVID‐19 cases from 19 January to 22 February 2020 in Shenzhen, China.
2. DATA AND METHODS
We collected the confirmed COVID‐19 cases from the Health Commission of Shenzhen Municipality (Shenzhen Municipal Health Commission, 2020). According to the latest figures released by the Health Commission of Shenzhen Municipality, the total number of confirmed cases in Shenzhen was 417 as of 22 February and remained unchanged up to February 27 (Figure 1). As shown in Figure 2, we examined the transmission events from the publicly released information and identified 27 transmission chains, including 23 infectees matched with only one infector. The transmission events were extracted independently by 2 authors. The final list of included cases was decided following discussion between the authors, with full agreement required prior to inclusion.
FIGURE 2.
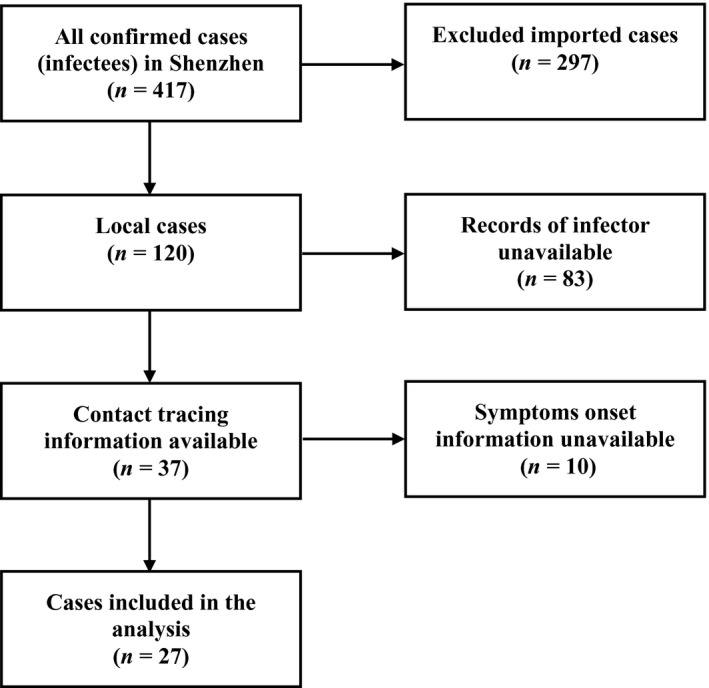
Flow chart of data cleaning and subjects selection.
The SI of COVID‐19 was fitted to three parametric probability distributions including Weibull, lognormal and gamma distributions with mean μ and standard deviation (SD) σ, denoted by d(∙|μ,σ) (Cowling et al., 2009; Zhao, Gao, et al., 2020). The interval‐censored likelihood of SI estimates is defined in the following equation.
here, the u(∙) is the probability density function (PDF) of exposure following a uniform distribution with a range from D min to D max. For the range of onset dates of multiple infectors linked to the i‐th infectee, the terms and denote the lower and upper bounds, respectively. The δi is the observed onset date of the i‐th infectee. The estimates of μ and σ were calculated by using the maximum‐likelihood estimation approach. Their 95% confidence intervals (95% CI) were calculated using the profile likelihood estimation framework with a cut‐off threshold determined by a Chi‐square quantile (Fan & Huang, 2005). The three models were compared using the corrected Akaike information criterion (AICc) to evaluate their fit (Burnham & Anderson, 2004).
With SI estimated, we fitted a logistic growth model to the number of COVID‐19 local case time series in Shenzhen (Zhao, Musa, Fu, He, & Qin, 2019). The logistic growth model is defined in the following equation,
Thus, the intrinsic epidemic growth rate, denoted by γ, can be estimated. We estimated the basic reproduction number (R 0) by using the formula R 0 = M(−γ) (Wallinga & Lipsitch, 2007), where the M(∙) is the moment generation function of the PDF of SI, as a proxy of GI.
3. RESULTS AND DISCUSSION
Among the 27 confirmed infectees, 11 were male and 16 were female. Out of these 27 patients, 17 (63%) were infected by their relatives who had been to Wuhan (i.e. transmission in family). These infectees had a mean age of 37.4, median 37.0, inter‐quartile range (IQR) between 32.0 and 48.5 and ranged from 2 to 78 years. The age is relatively young because Shenzhen is a rapidly developed special economic region. The observed SIs of all 27 confirmed infectees had a mean of 5.9, median of 4, inter‐quartile range (IQR) between 2 and 10 and a range from 1 to 16 days. In order to calculate the population mean and population standard deviation, we fitted samples to three distributions and summarized results in Table 1. We found that the AICc slightly favoured the Weibull distribution model: the smaller the AICc the better the fit. Figure 3 shows the likelihood profiles of varying SI with respect to μ and σ of SI with the Weibull distribution model, which is consistent to the estimated SI of influenza (Zhou et al., 2019). We estimated the mean of SI to be 5.9 days (95% CI: 3.9–9.6) and SD of SI to be 4.8 days (95% CI: 3.1–10.1). The fitted Weibull distribution is shown in Figure 4.
TABLE 1.
The summary of mean and standard deviation (SD) estimates of the serial interval (SI) of COVID‐19 in Shenzhen, China.
| Distribution | Mean (95% CI) | SD (95% CI) | AICc |
|---|---|---|---|
| Gamma | 5.9 (3.9–9.7) | 5.0 (3.1–9.7) | 152.0 |
| Weibull | 5.9 (3.9–9.6) | 4.8 (3.1–10.1) | 151.8 |
| Lognormal | 6.5 (3.9–15.1) | 7.9 (3.9–37.3) | 153.5 |
FIGURE 3.
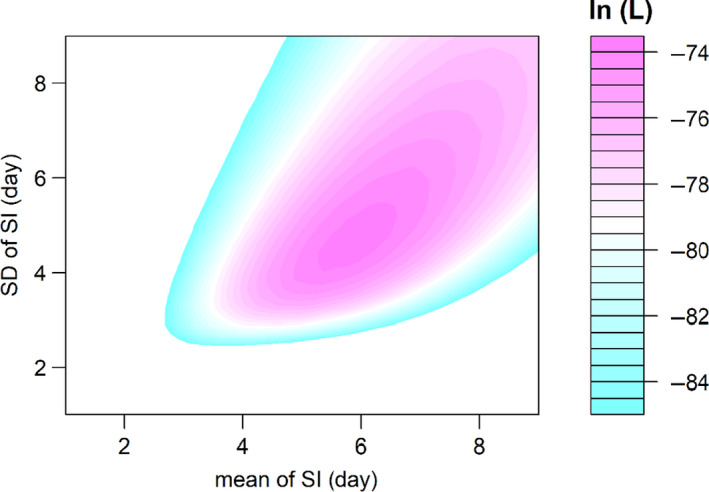
The likelihood profile of the varying serial interval (SI) of COVID‐19 by using all samples for Weibull distribution. The colour scheme is shown on the right‐hand side, and the darker colour indicates a larger log‐likelihood, that is ln(L), value.
FIGURE 4.
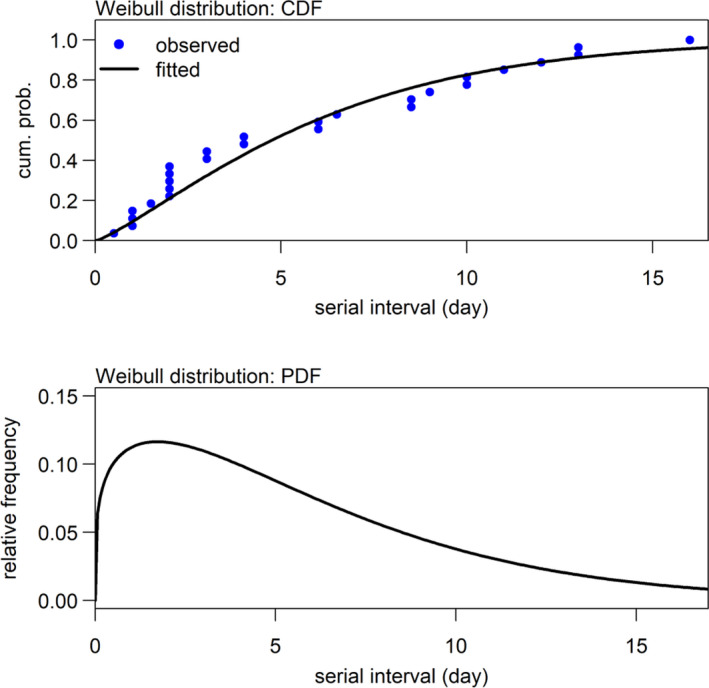
Distribution of serial interval (SI) estimated by using Weibull distribution.
Combining these findings with SI, we can obtain relatively reliable estimates of the basic reproduction number (R 0) in Shenzhen. In order to obtain the basic reproduction number in Shenzhen, we excluded 297 imported cases. We found that the logistic growth model fitted the observed epidemic curve well, as shown in Figure 5. The intrinsic growth rate (γ) was estimated to be 0.22 (95% CI: 0.19–0.26). We estimated R 0 to be 2.6 (95% CI: 2.4–2.8), which is consistent with previous estimates (Jung et al., 2020; Li et al., 2020; Wu, Leung, & Leung, 2020; Zhao, Lin, et al., 2020). For instance, Li et al. (2020) estimated R 0 of COVID‐19 to be 2.2 (95% CI: 1.4 to 3.9). Zhao, Lin, et al. (2020) estimated R 0 to be 2.56 (95% CI: 2.49–2.63) in the early outbreak of COVID‐19. Similarly, Wu et al. (2020) estimated that R 0 for COVID‐19 was 2.68 (95% CI: 2.47–2.86) via a susceptible–exposed–infectious–recovered metapopulation model.
FIGURE 5.
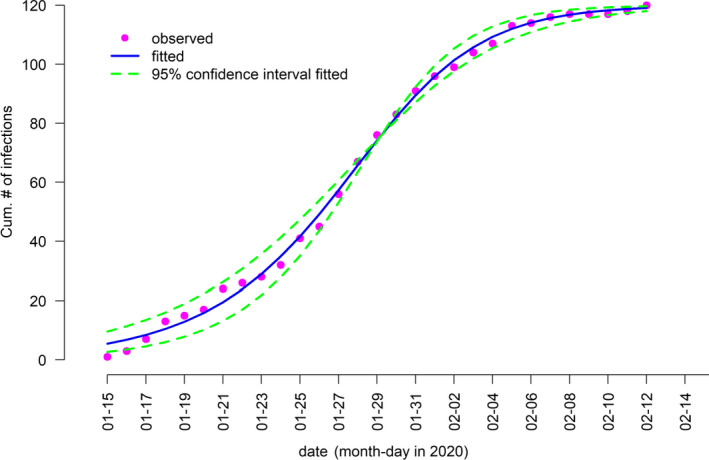
Logistic growth fitting for the cumulative number of local COVID‐19 cases in Shenzhen, China.
It is of great importance to estimate the SI of COVID‐19 accurately in order to interpret the transmission characteristics of the diseases. The shorter the SI, the faster the growth rate (with a moderate R 0), the steeper the epidemic curve and the higher the replacement rate of generations of infections. We estimated that the SI of COVID‐19 in Shenzhen was 5.9 days (3.9–9.6). Zhao, Lin, et al. (2020) estimated the mean of SI to be 4.4 days from a Gamma‐distributed model based on 21 records of transmission chains in Hong Kong SAR China. Meanwhile, the median serial interval was estimated to be 4.6 days by Nishiura, Linton, and Akhmetzhanov (2020) through a Weibull distribution model from 28 records, which is one of the earliest estimates to have been made. You et al. (2020) found the serial interval to have an average of 4.41 days with a standard deviation of 3.17 days. The value of the serial interval in the above papers were shorter than that in another published study (Guan et al., 2020), which was based on six known infector–infectee pairs in the early outbreak of COVID‐19 and with the gamma distribution (mean = 7.5 days, standard deviation SD = 3.4 days). Du et al. (2020) obtained the data on 468 COVID‐19 transmission events reported in mainland China outside of Hubei Province and 12.6% of the serial intervals in their sample were negative.
But one should be cautious to deal with negative values of the serial interval. The purpose of estimating serial interval is to approximate generation interval which is non‐observable but strictly positive. The generation interval together than the reproduction number governs the progression of an epidemic. The sample size of our study is small, and serial intervals in our cases were all non‐negative. Indeed, we found some small serial intervals such as 1 day in our samples. Nishiura et al. (2020) did not find negative serial intervals among 28 infector–infected pairs from multiple countries. Negative values of serial interval or very short serial interval (such as 1 or 2 days) imply pre‐symptomatic transmission and highlight the difficulty in control and rapid spread. Moreover, the values of the serial interval for COVID‐19 estimated by recent studies are evidently shorter than MERS (Assiri et al., 2013) and SARS (Lipsitch et al., 2003), for which values of 7.6 days and 8.4 days have been estimated, respectively.
Timely isolation is essential to prevent the epidemic when small serial interval of disease transmission is shown, because the shorter the SI, the faster the disease spreads. The relatively short SI implies that SARS‐CoV‐2 transmitted rapidly with a moderate R 0. Thus, swift actions such as isolation, prevention and control are crucial to stop the transmission. However, the sample size in this work is relatively small, even though it is already larger than the initial study of six cases (Guan et al., 2020). More transmission chains from other regions will be needed to help us gain a clear understanding of the characteristics of SI and thus inform prevention and control with updated knowledge.
4. CONCLUSION
The SI of COVID‐19 is relatively shorter than the other two betacoronavirus diseases (SARS and MERS), and this implies the iteration of the transmission was rapid for the COVID‐19 outbreak.
CONFLICTS OF INTEREST
DH was supported by Alibaba (China) Co., Ltd—Hong Kong Polytechnic University Collaborative Research project. Other authors declared no conflict of interest.
AUTHOR CONTRIBUTIONS
All authors conceived the study, carried out the analysis, discussed the results, drafted the first manuscript, critically read and revised the manuscript and gave final approval for publication. All authors have read and agreed to the published version of the manuscript.
ETHICAL APPROVAL
The follow‐up data of individual patients were collected via public domain (Shenzhen Municipal Health Commission, 2020), and thus neither ethical approval nor individual consent was applicable.
Wang K, Zhao S, Liao Y, et al. Estimating the serial interval of the novel coronavirus disease (COVID‐19) based on the public surveillance data in Shenzhen, China from 19 January to 22 February 2020. Transbound Emerg Dis. 2020;67:2818–2822. 10.1111/tbed.13647
Kai Wang and Shi Zhao contribute equally, and thus they are co‐first authors.
Funding information
KW was supported in part by the National Natural Science Foundation of China (11961071). DH was supported by General Research Fund (15205119) of Research Grants Council of Hong Kong and Alibaba (China) Co., Ltd—Hong Kong Polytechnic University Collaborative Research project (P0031768).
DATA AVAILABILITY STATEMENT
The data that support the findings of this study are available from the corresponding author upon reasonable request.
REFERENCES
- Archer, B. N. , Tempia, S. , White, L. F. , Pagano, M. , & Cohen, C. (2012). Reproductive number and serial interval of the first wave of influenza A(H1N1)pdm09 virus in South Africa. PLoS One, 7(11), e49482. 10.1371/journal.pone.0049482 [DOI] [PMC free article] [PubMed] [Google Scholar]
- Assiri, A. , McGeer, A. , Perl, T. M. , Price, C. S. , Al Rabeeah, A. A. , Cummings, D. A. , … Makhdoom, H. (2013). Hospital outbreak of middle east respiratory syndrome coronavirus. New England Journal of Medicine, 369(9), 886. 10.1056/nejmx130042 [DOI] [PMC free article] [PubMed] [Google Scholar]
- Black, A. J. , & Ross, J. V. (2013). Estimating a markovian epidemic model using household serial interval data from the early phase of an epidemic. PLoS One, 8(8), e73420. 10.1371/journal.pone.0073420 [DOI] [PMC free article] [PubMed] [Google Scholar]
- Burnham, K. P. , & Anderson, D. R. (2004). Multimodel inference: Understanding aic and bic in model selection. Sociological Methods & Research, 33(33), 261–304. 10.1177/0049124104268644 [DOI] [Google Scholar]
- Cowling, B. J. , Fang, V. J. , Riley, S. , Malik Peiris, J. S. , & Leung, G. M. (2009). Estimation of the serial interval of influenza. Epidemiology, 20(3), 344–347. 10.2307/20485720 [DOI] [PMC free article] [PubMed] [Google Scholar]
- Du, Z. , Xu, X. , Wu, Y. , Wang, L. , Cowling, B. J. , & Meyers, L. A. (2020). Serial interval of COVID‐19 among publicly reported confirmed cases. Emerging Infectious Diseases, 26(6), 1341–1343. 10.3201/eid2606.200357 [DOI] [PMC free article] [PubMed] [Google Scholar]
- Fan, J. , & Huang, T. (2005). Profile likelihood inferences on semiparametric varying‐coefficient partially linear models. Bernoulli, 11(6), 1031–1057. 10.2307/25464778 [DOI] [Google Scholar]
- Guan, W. , Ni, Z. , Hu, Y. , Liang, W.‐H. , Ou, C.‐Q. , & He, J.‐X. , … the China Medical Treatment Expert Group for Covid‐19 (2020). Clinical characteristics of 2019 novel coronavirus infection in China. New England Journal of Medicine, 382, 1708–1720. 10.1056/NEJMoa2002032 [DOI] [PMC free article] [PubMed] [Google Scholar]
- Jung, S. , Akhmetzhanov, A. R. , Hayashi, K. , Linton, N. M. , Yang, Y. , Yuan, B. , … Nishiura, H. (2020). Real‐time estimation of the risk of death from novel coronavirus (COVID‐19) infection: Inference using exported cases. Journal of Clinical Medicine, 9, 523. 10.3390/jcm9020523 [DOI] [PMC free article] [PubMed] [Google Scholar]
- Li, Q. , Guan, X. , Wu, P. , Wang, X. , Zhou, L. , Tong, Y. , … Feng, Z. (2020). Early transmission dynamics in Wuhan, china, of novel coronavirus‐infected pneumonia. New England Journal of Medicine, 382(13), 1199–1207. 10.1056/NEJMoa2001316 [DOI] [PMC free article] [PubMed] [Google Scholar]
- Lipsitch, M. , Cohen, T. , Cooper, B. , Robins, J. M. , Ma, S. , James, L. , … Samore, M. H. (2003). Transmission dynamics and control of severe acute respiratory syndrome. Science, 300, 1966–1970. 10.1126/science.1086616 [DOI] [PMC free article] [PubMed] [Google Scholar]
- National Health Commission of the People's Republic of China (2020). Latest update on outbreak prevention and control. Retrieved from http://www.nhc.gov.cn/yzygj/s7652m/202002/e84bd30142ab4d8982326326e4db22ea.shtml [DOI] [PMC free article] [PubMed] [Google Scholar]
- Nishiura, H. , Linton, N. M. , & Akhmetzhanov, A. R. (2020). Serial interval of novel coronavirus (2019‐nCoV) infections. medRxiv, 93, P284–P286. 10.1101/2020.02.03.20019497 [DOI] [PMC free article] [PubMed] [Google Scholar]
- Orellano, P. , Reynoso, J. , Grassi, A. , Palmieri, A. , & Carlino, O. (2012). Estimation of the serial interval for pandemic influenza (pH1N1) in the most southern province of Argentina. Iranian Journal of Public Health, 41(12), 26–29. 10.1093/ije/dyi118 [DOI] [PMC free article] [PubMed] [Google Scholar]
- Shenzhen Municipal Health Commission (2020). Epidemic information. Retrieved from http://wjw.sz.gov.cn/yqxx/ [Google Scholar]
- te Beest, D. E. , Henderson, D. , van der Maas, N. A. T. , de Greeff, S. C. , Wallinga, J. , Mooi, F. R. , & van Boven, M. (2014). Estimation of the serial interval of pertussis in Dutch households. Epidemics, 7, 1–6. 10.1016/j.epidem.2014.02.001 [DOI] [PubMed] [Google Scholar]
- Wallinga, J. , & Lipsitch, M. (2007). How generation intervals shape the relationship between growth rates and reproductive numbers. Proceedings of the Royal Society B: Biological Sciences, 274(1609), 599–604. 10.1098/rspb.2006.3754 [DOI] [PMC free article] [PubMed] [Google Scholar]
- Wu, J. T. , Leung, K. , & Leung, G. M. (2020). Nowcasting and forecasting the potential domestic and international spread of the 2019‐nCoV outbreak originating in Wuhan, China: A modelling study. Lancet, 395, 689–697. 10.1016/S0140-6736(20)30260-9 [DOI] [PMC free article] [PubMed] [Google Scholar]
- Yom‐Tov, E. , Johansson‐Cox, I. , Lampos, V. , & Hayward, A. C. (2015). Estimating the secondary attack rate and serial interval of influenza‐like illnesses using social media. Influenza and Other Respiratory Viruses, 9(4), 191–199. 10.1111/irv.12321 [DOI] [PMC free article] [PubMed] [Google Scholar]
- You, C. , Deng, Y. , Hu, W. , Sun, J. , Lin, Q. , Zhou, F. , … Zhou, X. (2020). Estimation of the time‐varying reproduction number of COVID‐19 outbreak in China. medRxiv, 2020. 10.1101/2020.02.08.20021253. [DOI] [PMC free article] [PubMed] [Google Scholar]
- Zhao, S. , Gao, D. , Zhuang, Z. , Chong, M. , Cai, Y. , Ran, J. , … Wang, M. (2020). Estimating the serial interval of the novel coronavirus disease (COVID‐19): A statistical analysis using the public data in Hong Kong from January 16 to February 15. medRxiv, 2020. 10.1101/2020.02.21.20026559 [DOI] [Google Scholar]
- Zhao, S. , Lin, Q. , Ran, J. , Musae, S. S. , Yang, G. , Wang, W. , … Wang, M. (2020). Preliminary estimation of the basic reproduction number of novel coronavirus (2019‐nCoV) in China, from 2019 to 2020: A data‐driven analysis in the early phase of the outbreak. International Journal of Infectious Diseases, 92, 214–217. 10.1016/j.ijid.2020.01.050 [DOI] [PMC free article] [PubMed] [Google Scholar]
- Zhao, S. , Musa, S. S. , Fu, H. , He, D. , & Qin, J. (2019). Simple framework for real‐time forecast in a data‐limited situation: The Zika virus (ZIKV) outbreaks in Brazil from 2015 to 2016 as an example. Parasites Vectors, 12, 344. 10.1186/s13071-019-3602-9 [DOI] [PMC free article] [PubMed] [Google Scholar]
- Zhou, L. , Li, Q. , & Uyeki, T. M. (2019). Estimated incubation period and serial interval for human‐to‐human influenza A(H7N9) virus transmission. Emerging Infectious Diseases, 25(10), 1982–1983. 10.3201/eid2510.190117 [DOI] [PMC free article] [PubMed] [Google Scholar]
Associated Data
This section collects any data citations, data availability statements, or supplementary materials included in this article.
Data Availability Statement
The data that support the findings of this study are available from the corresponding author upon reasonable request.