Abstract
The recent outbreak of novel “coronavirus disease 2019” (COVID-19) has spread rapidly worldwide, causing a global pandemic. In the present work, we have elucidated the mechanism of binding of two inhibitors, namely α-ketoamide and Z31792168, to SARS-CoV-2 main protease (Mpro or 3CLpro) by using all-atom molecular dynamics simulations and free energy calculations. We calculated the total binding free energy (ΔGbind) of both inhibitors and further decomposed ΔGbind into various forces governing the complex formation using the Molecular Mechanics/Poisson-Boltzmann Surface Area (MM/PBSA) method. Our calculations reveal that α-ketoamide is more potent (ΔGbind= − 9.05 kcal/mol) compared to Z31792168 (ΔGbind= − 3.25 kcal/mol) against COVID-19 3CLpro. The increase in ΔGbind for α-ketoamide relative to Z31792168 arises due to an increase in the favorable electrostatic and van der Waals interactions between the inhibitor and 3CLpro. Further, we have identified important residues controlling the 3CLpro-ligand binding from per-residue based decomposition of the binding free energy. Finally, we have compared ΔGbind of these two inhibitors with the anti-HIV retroviral drugs, such as lopinavir and darunavir. It is observed that α-ketoamide is more potent compared to lopinavir and darunavir. In the case of lopinavir, a decrease in van der Waals interactions is responsible for the lower binding affinity compared to α-ketoamide. On the other hand, in the case of darunavir, a decrease in the favorable intermolecular electrostatic and van der Waals interactions contributes to lower affinity compared to α-ketoamide. Our study might help in designing rational anti-coronaviral drugs targeting the SARS-CoV-2 main protease.
Communicated by Ramaswamy H. Sarma
Keywords: COVID-19, SARS-CoV-2 3CLpro, Molecular Dynamics, MM-PBSA, binding free energy
1. Introduction
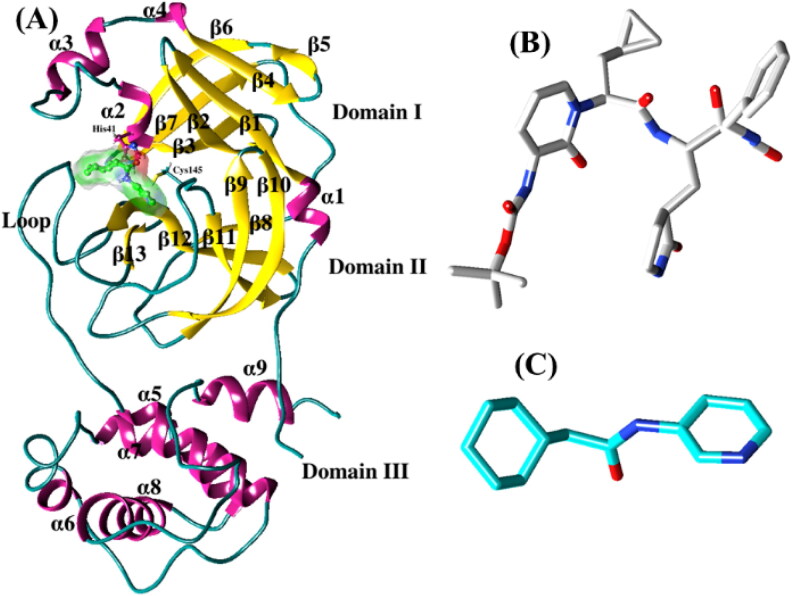
The recent outbreak of “coronavirus disease 2019” (COVID-19) poses a severe public health risk. COVID-19 is caused by the novel coronavirus (nCoV) or SARS-CoV-2, which is a highly contagious and pathogenic virus (Aanouz et al., 2020; Pant et al., 2020). The disease has spread worldwide since its outbreak in the city of Wuhan, China, in 2019 (Boopathi et al., 2020; Hasan et al., 2020; Hui et al. 2020; Sinha et al., 2020; Wu et al., 2020). So far, the total number of people diagnosed with the COVID-19 viral infection exceeds over 3.7 million, with more than 0.26 million fatalities worldwide. In India, more than 50000 people have been infected, including 1700 deaths (https://www.mohfw.gov.in). The number of positive cases is increasing exponentially due to human-to-human transmission. The World Health Organisation (WHO) has declared COVID-19 a global pandemic.nCoV is a non-segmented, single-stranded, positive-sense RNA virus that belongs to the beta coronavirus family (Woo et al., 2010; Elmezayen et al., 2020; Enayatkhani et al., 2020; Gupta et al., 2020). This gene encodes four structural proteins, namely spike glycoprotein (S), a small envelope protein (E), matrix glycoprotein (M), and nucleocapsid protein (N) (Rota et al. 2003; Elfiky 2020; Elfiky 2020; Elfiky & Azzam, 2020). The S protein attaches with the host receptor by the specific receptor binding domain (RBD) (Wan et al., 2020), while the N protein binds to RNA in multiple sites to make a helical nucleocapsid structure (Chang et al., 2014; Jin et al., 2020). Along with these proteins, chymotrypsin-like cysteine protease (3CLpro) is an essential protein for maintaining the viral life cycle by cleaving the essential polyprotein PP1A to individual functional components. 3CLpro contains 9 α-helices and 13 β-strands (see Figure 1(A)), creating three domains, domain I (residues 8-101), domain II (residues 102-184), and domain III (residues 201-306). The domains II and III are connected by a long loop (residues 185-200). The active site of this protease is located between domains I and II, and each domain contributes a single residue to the catalytic dyad, His41 and Cys145, respectively. 3CLpro plays a crucial role in mediating viral replication and transcription making it an attractive drug target for the treatment of COVID-19.
Figure 1.
(A) The ribbon representation of SARS-CoV-2 3CLpro. The catalytic dyad residues (H41 and C145) are shown in balls and sticks. The inhibitors, α-ketoamide (B) and Z31792168 (C) are represented as sticks.
Recently, Jin and co-workers have designed a modified peptide inhibitor for this protease and solved the X-ray crystal structure of the complex (Jin et al., 2020). The availability of the crystal structure of 3CLpro opens up a lot of opportunities to develop new antiviral drugs. This structure is employed to computationally evaluate the repurposing of different FDA approved drugs against COVID-19 (Das, Sarmah, Lyndem & Singha Roy 2020; Islam et al., 2020; Joshi et al., 2020; Wang, 2020). Several studies have predicted the binding strength of darunavir, indinavir, like other HIV protease drugs and some other small molecules against 3CLpro (Alamri et al., 2020; Abdelli et al., 2020; Khan et al., 2020; Khan et al., 2020; Lin et al., 2020; Muralidharan et al., 2020; Sang et al., 2020; Sarma et al., 2020; Umesh et al., 2020; Wahedi et al., 2020).
Recently, Zhang and co-workers have designed a potent inhibitor, α-ketoamide [tert-butyl (1-((S)-1-(((S)-4-(benzylamino)-3,4-dioxo-1-((S)-2-oxopyrrolidin-3-yl)butan-2-yl)amino)-3-cyclopropyl-1-oxopropan-2-yl)-2-oxo-1,2-dihydropyridin-3-yl)carbamate] (see Figure 1(B)) targeting 3CLpro and resolved the crystal structure of 3CLpro/α-ketoamide (Zhang et al., 2020). This inhibitor shows a promising binding as well as a pronounced lung tropism and can be administered by the inhalation route (Zhang et al., 2020). In the present work, we have studied the mechanism of binding of this inhibitor to SARS-CoV-2 3CLpro using molecular dynamics simulations in conjunction with the popular molecular mechanics/Poisson-Boltzmann surface area scheme. We have also considered another inhibitor, Z31792168 (2-cyclohexyl-N-pyridin-3-yl-ethanamide) (Fearon et al., 2020) in our study (see Figure 1(C)) and compared with α-ketoamide. Finally, the binding free energy of these two inhibitors is compared with the anti-HIV retroviral drugs, such as lopinavir and darunavir.
2. Materials and methods
2.1. Simulation protocol
The initial coordinates for our molecular dynamics simulations were obtained from the X-ray crystallographic structure of the SARS-CoV-2 3CLpro complexed with the inhibitors α-ketoamide (PDB: 6Y2G) and Z31792168 (PDB: 5R84) (Berman et al., 2002; Zhang et al., 2020). The missing residues in 3CLpro were added by using the Modeller (Fiser & Šali, 2003; Webb & Sali, 2014) plugin in UCSF Chimera software (Pettersen et al., 2004). The protonation states of the charged residues were determined using the Propka 3.1 webserver (Olsson et al., 2011). All simulations were executed by the pmemd.cuda module of AMBER18 (Case et al., 2018) package and analyses were done by the Cpptraj module (Roe & Cheatham, 2013). We used the latest AMBER ff14SB force field (Maier et al., 2015) to describe the protein structure and the updated generalized Amber force field (GAFF2) (Wang et al., 2004) is used to assign parameters to small molecules. All the missing hydrogen atoms were added by the Leap module of AMBER (Salomon‐Ferrer et al., 2013). The inhibitors were assigned AM1-BCC (Jakalian et al., 2002) charge, which was calculated by utilizing the Antechamber (Wang et al., 2006) module of AMBER18. The systems were solvated in a truncated octahedron periodic box with an explicit TIP3P (Price & Brooks, 2004) water model and a 10 Å buffer distance was considered from the complex along each side.
A suitable integer number of counterions (Na+) were added for neutralizing the whole system. The temperature was kept at 300 K and controlled by the Langevin thermostat (Loncharich et al., 1992). The system pressure was monitored using a Berendsen Barostat (Berendsen et al., 1984) and kept at 1.0 bar. All bond lengths involving hydrogen atoms were constrained by the SHAKE algorithm (Kräutler et al., 2001). We used a time-step of 2.0 fs for the simulation. The particle mesh Ewald summation (PME) (Darden et al., 1993) approach was used to compute the long-range electrostatic interactions. For all cases, the nonbonded cut-off was fixed at 10.0 Å.
Firstly, each complex was optimized using 500 steps of the steepest descent algorithm followed by another 500 cycles of the conjugate gradient scheme. During the minimization, the receptor-inhibitor complexes were restrained to their respective coordinates with a force constant of 2.0 kcal mol−1Å −2. Next, we carried out the minimization without applying any harmonic restraint on the solutes to remove any residual steric clashes. After the minimization, the temperature of each solvated system was gradually increased from 0 K to 300 K at the NVT (canonical) ensemble with a restraint force constant of 2.0 kcal mol−1Å−2 acting on the solute atoms. Subsequently, a 50 ps MD simulation with a restraint force constant of 2.0 kcal mol−1Å−2 acting on all solute atoms at a constant pressure of 1.0 atm was conducted using Berendsen Barostat (Berendsen et al., 1984) at a fixed temperature of 300 K. After 1.0 ns of an equilibration phase, the production simulation was carried for 100 ns at the NPT ensemble. The Cartesian coordinates were stored every 10 ps. Overall, we accumulated 10000 snapshots corresponding to each production simulation.
2.2. Dynamic cross-correlation map (DCCM)
The correlated and non-correlated atomic motions of complex protein residues were computed with the help of DCCM (McCammon, 1984; Hünenberger et al., 1995) analysis using Cpptraj (Roe & Cheatham, 2013) module of AmberTools19. Herein, we avoid the apparent correlations between slow side-chain fluctuations and backbone movements. To reduce the statistical noise, we considered only Cα atomic coordinates of each residue. The cross-correlations between the residues were described by the covariance matrix, and the element Cij of the covariance matrix was calculated using the following equation:
| (1) |
where Δri and Δrj represent the displacements from the average position of ith and jth atoms with respect to time, respectively. The angular bracket indicates the time average over the entire trajectory. The cross-correlated values vary between -1 and 1. The positive value represents the positively correlated motions, while negative values represent the anti-correlated motions. We have considered the final 90 ns production simulation trajectories for this analysis.
2.3. Principal component analysis (PCA)
PCA or principal component analysis (Ichiye & Karplus, 1991) gives us detailed information about residual movements and functional significance of each residue. Similar to DCCM analysis, only Cα atomic coordinates were used for this analysis. The atomic fluctuations of Cα-atoms of each residue form a covariance matrix, as described in the DCC analysis. The diagonalization of the covariance matrix gives us the othrogonal eigenvectors and the corresponding eigenvalues. The eigenvectors indicate the directions of the concerted motions, and the eigenvalues describe the amplitude of the motions. These eigenvectors and associate eigenvalues represent the set of principal components (PCs), which may be used to describe the movement characteristics. We also calculated the cosine content via GROMACS (g_covar, g_anaeig, and g_analyze modules) (Hess et al., 2008) of first few PCs to check the statistical convergence significance of each trajectory. The higher value of conformational sampling convergence gives a low value of cosine contents. Our first few PC’s cosine contents values lie between 0 to 0.6 for each case, which indicates a high conformational sampling convergence.
2.4. Free energy landscape
The free energy landscape (FEL) calculations were performed by AmberTools19 Cpptraj module of AMBER18 using the below Equation (2) (Frauenfelder et al., 1991);
| (2) |
where represents the Boltzmann constant, T is the temperature of each simulated system. Ni is the population of the ith bin, and Nm is the population of the most populated bin. Therefore, bins with no population are an artificial barrier as an indication of the lowest probability. To measure the conformational variability of each system in terms of FELs, we considered the first two principal components (PC1 and PC2) as reaction coordinates.
2.5. Energy calculations
In order to estimate the stabilization of binding systems, the binding free energies or affinity of all inhibitors against SARS-CoV-2 3CLpro were calculated by the widely used molecular mechanics Poisson-Boltzmann surface area (MM-PBSA) method (Kollman et al., 2000; Wang et al., 2001; Kar et al., 2007; Kar et al., 2007; Kar et al., 2011; Kar & Knecht, 2012a; Kar & Knecht, 2012b; Kar & Knecht, 2012c; Kar & Knecht, 2012d; Kar et al., 2013). We discussed the MMPBSA scheme in detail in our previous studies (Jonniya et al., 2019; Jonniya & Kar, 2020; Roy et al., 2020; Sk et al., 2020) and here we used the same protocol. Briefly, in the MMPBSA scheme, the binding free energy (ΔGbind) of an inhibitor is calculated by utilizing the following equations:
| (3) |
| (4) |
| (5) |
Where ΔEMM, ΔGsolv and -TΔS are the changes in molecular mechanics (MM) energy at the gas phase, desolvation free energy and the conformational entropy upon complexation, respectively. Further, ΔEMM is sum of ΔEinternal (bond, dihedral and angle energies), ΔEelec (electrostatic), and ΔEvdW (van der Waals) energies while ΔGsolv includes ΔGpol (polar solvation energy) and ΔGnp (nonpolar solvation energy). The normal mode analysis (Xu et al., 2011) method was used to calculate the configurational entropy (SMM). Due to the high computational cost, we considered only 50 configurations from the last 20 ns simulations for entropy calculations. We were also performed the per-residue decomposition of binding energy by molecular mechanics generalize- Born surface area (MM-GBSA) scheme to know the individual residual contributions of each residue. All the parameters used in this calculation were developed by Onufreiv and Bashford (Onufriev et al., 2004). In this study, 2000 structural frames were applied to run the MM-PBSA calculation.
2.6. Hydrogen bond criterion
The hydrogen bonds between the inhibitor and receptor were analyzed using the Cpptraj module in AmberTools19 (Roe & Cheatham, 2013). The formation of hydrogen bond defined by a distance and an angle cut-off of ≤ 3.5 Å and ≥120°, respectively, between the donor (D) and acceptor (A) atom.
3. Results and discussion
3.1. Structural stability and flexibility analysis
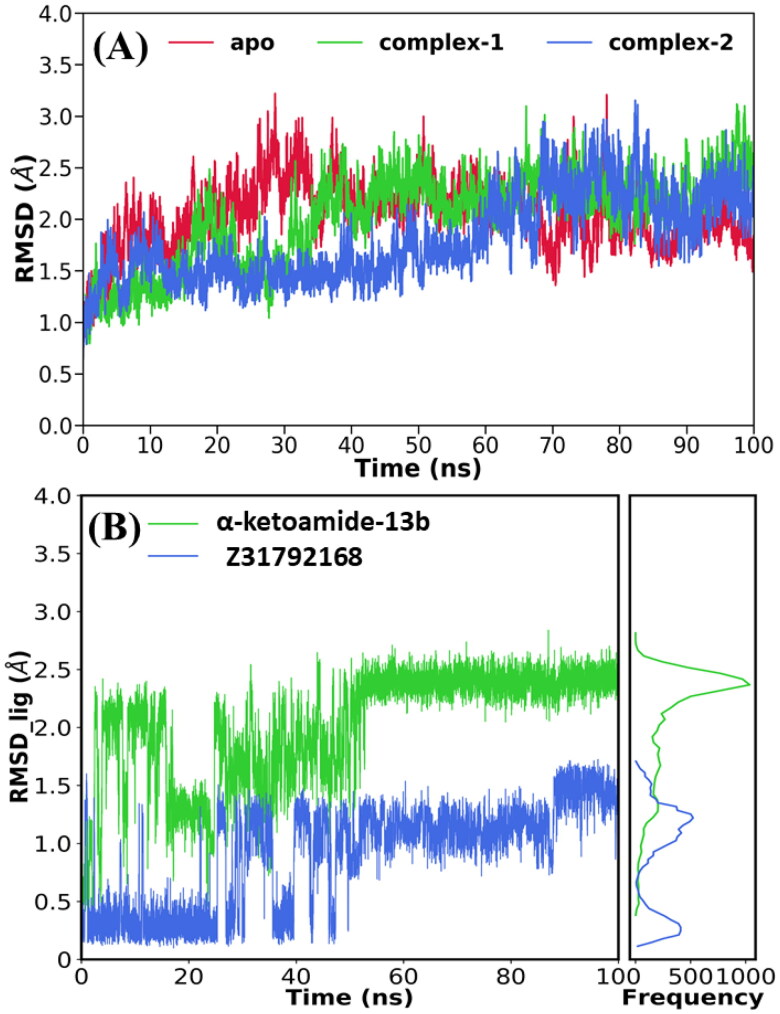
To verify the convergence of our simulations, we estimated the root-mean-square deviations (RMSDs) of backbone atoms relative to the initial structure, and the temporal RMSD of all systems is shown in Figure 2. From Figure 2(A), it is clear that apo 3CLpro reached a stable equilibrium after 30 ns while the 3CLpro/α-ketoamide system reached equilibrium after 40 ns. In the case of 3CLpro/Z31792168, the equilibrium is reached after 60 ns.
Figure 2.
Time evolution of root-mean-square deviations (RMSD) of (A) backbone atoms of 3CLpro relative to their respective minimized structure and (B) heavy atoms of inhibitor.
The average RMSDs for all simulated systems were calculated and reported in Table 1. The average RMSD was found to vary between 1.95 Å and 2.25 Å for all cases. The highest deviation (2.25 Å) was obtained for 3CLpro/α-ketoamide, while the lowest RMSD (1.95 Å) was obtained for 3CLpro/Z31792168. We also calculated the RMSD of each ligand, and the time evolution of ligand RMSD is shown in Figure 2(B). As can be seen from Figure 2(B), two inhibitors reached equilibrium after 50 ns of MD simulations. In the case of α-ketoamide, the frequency distribution of RMSD is characterized by a sharp peak at 2.4 Å while two peaks (0.23 Å and 1.1 Å) are obtained for Z31792168. The K-mean cluster analysis of the ligand suggests two dominant conformations for both ligands, and these conformations correspond to dominant poses in the binding cavity (see Supporting Information Figure S1).
Table 1.
The average RMSD, solvent accessible surface area (SASA), and radius of gyration for the simulated systems.
| System | Backbone RMSD (Å) | SASA (Å2) | Radius of gyration (Rg) (Å) |
|---|---|---|---|
| apo | 2.10 (0.01) | 14650 (3.5) | 22.13 (0.01) |
| 3CLpro/α-ketoamide | 2.25 (0.01) | 13969 (3.2) | 22.03 (0.01) |
| 3CLpro/Z31792168 | 1.95 (0.01) | 14208 (3.6) | 21.96 (0.01) |
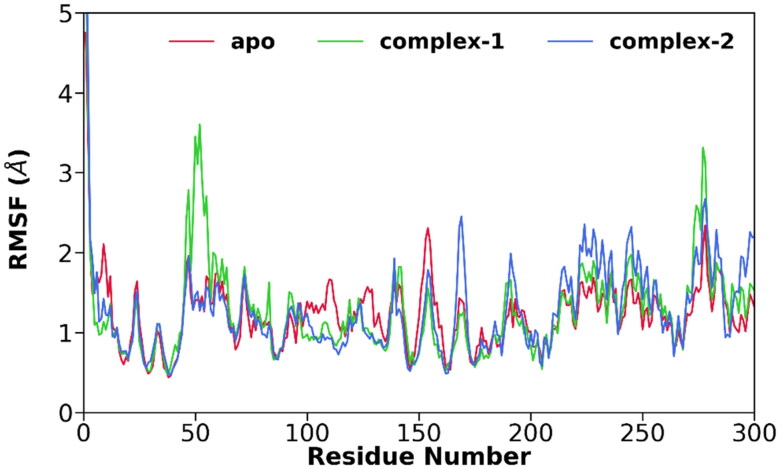
Next, we investigated the flexibility of different parts of 3CLpro by calculating the root mean square fluctuations (RMSFs) of Cα-atoms for all systems and is shown in Figure 3. It is evident from Figure 3 that all three systems display more or less similar fluctuations. In the case of apo-3CLpro, domain II (residues 102-184) shows slightly higher fluctuations, which gets diminished after the ligand binding. In the case of 3CLpro/α-ketoamide, a relatively higher value of RMSF is obtained around residue 50 (domain I) compared to apo or 3CLpro/Z31792168.
Figure 3.
The root-mean-square fluctuations (RMSFs) of Cα atoms for apo (red), 3CLpro/α-ketoamide (green), and 3CLpro/Z31792168 (blue).
The structural compactness of each system was analyzed by estimating the radius of gyration (Rg) from their respective MD trajectories, and the calculated average values are reported in Table 1. A similar Rg is obtained for all systems. Finally, the solvent-accessible surface area (SASA) that indicates the degree of solvent exposure was also calculated and reported in Table 1. It is evident from Table 1 that SASA values vary between 13969 Å2 and 14650 Å2 for all systems. The highest value (14650 Å2) was obtained for apo, while the lowest SASA value (13969 Å2) was reported for 3CLpro/α-ketoamide. An intermediate SASA value (14208 Å2) was obtained for 3CLpro/Z31792168.
3.2. Dynamic cross-correlation (DCC) analysis
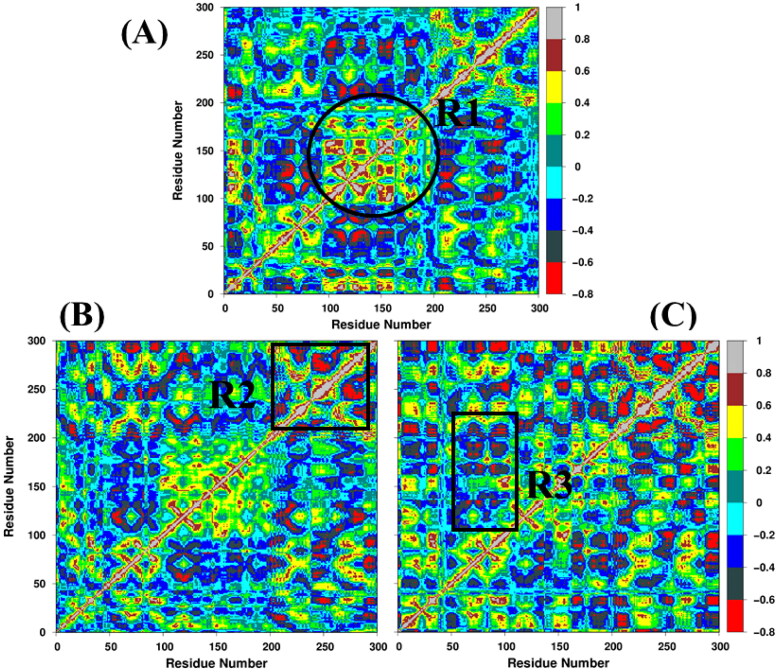
To elucidate the effect of inhibitor-binding on the internal dynamics of 3CLpro, the cross-correlation matrix was calculated by using the coordinates of Cα atoms from MD trajectories, and the dynamic cross-correlation map (DCCM) is displayed in Figure 4. Overall, after the inhibitor binding, a slight increase in the apparent anti-correlated motions is observed for both complexes.
Figure 4.
Dynamic cross-correlation map (DCCM) for (A) apo, (B) 3CLpro/α-ketoamide, and (C) 3CLpro/Z31792168. The extent of correlated and anti-correlated motions are color-coded. Red color shows more anti-correlated motions, and grey color shows correlated motions.
In the case of the apo system, domain I (residues 8-101) displays correlated motions while domain II (or R1 in Figure 4(A)) (residues 102-184) shows highly anti-correlated movements. However, domain III (residues 201-306) has a lower strength of anti-correlation motions relative to domain I. In the case of 3CLpro/α-ketoamide (Figure 4(B)), the region R1, which represents the binding cavity, displays a significant reduction in anti-correlated and an increase in correlated motions compared to apo. In contrast to 3CLpro/α-ketoamide, more anti-correlated motions are observed in R1 for 3CLpro/Z31792168 (Figure 4(C)). Further, it is evident from Figure 4(A–C) that the inhibitor binding increases the strength of anti-correlated motions in the region R2, which indicates the residual motion of domain III. In region R3, the anti-correlated movements are diminished in 3CLpro/α-ketoamide compared to 3CLpro/Z31792168. Overall, the binding of α-ketoamide with 3CLpro creates a stable environment near the binding cavity.
3.3. Principal component analysis
To further characterize the effect of inhibitor binding on the dynamics of 3CLpro and extract the structural variations in detail, PCA was applied to the coordinates of the backbone atoms of all three systems. The PCA results in terms of eigenvectors (3 N, 3 × 306 = 918) versus eigenvalues obtained by diagonalization of the atomic fluctuations covariance matrix for complexes and apo 3CLpro are shown in Figure S2 (Supporting Information). The collective motions of the localized fluctuations can be defined by the first few principal components. The first 10 eigenvectors capture ⁓87%, ⁓88%, and ⁓89% of the total motion in apo, 3CLpro/α-ketoamide, and 3CLpro/Z31792168.
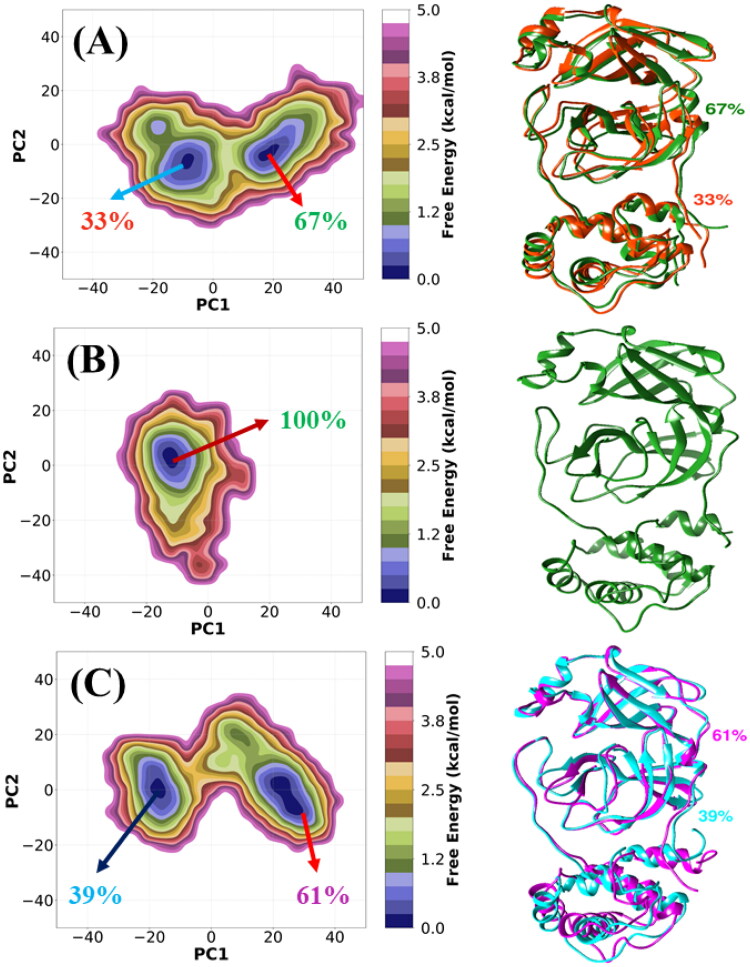
In general, the two largest principal components (PC1 and PC2) account for more than 70% of the overall fluctuations for apo and the inhibitor-bound 3CLpro. The two-dimensional free energy landscapes (FELs) of all three systems are shown in Figure 5(A–C). It is notable that the conformational space sampled in the case of 3CLpro/α-ketoamide is more restricted, whereas a wider conformational space is sampled in cases of apo and 3CLpro/Z31792168 (see Figure 5 and Figure S3). This observation suggests that both apo and 3CLpro/Z31792168 systems are more flexible compared to 3CLpro/α-ketoamide, which agrees with the RMSF plot (Figure 3). FELs of apo (Figure 5(A)) and 3CLpro/Z31792168 (Figure 5(C)) are characterized by two dispersed free energy basins, whereas, in the case of 3CLpro/α-ketoamide (Figure 5(B)), we have obtained a single and stable global free energy minimum confined within a basin on the FEL. Porcupine plots are shown in Supporting Information Figure S4, which was generated via the first mode that shows the largest collective motions of Cα atoms, which has been mapped onto the average structure using the Normal Modes Analysis plugin available in VMD (Humphrey et al., 1996). To visualize the detailed movements of each protein, corresponding structures were selected based on K-means (Hartigan & Wong, 1979) clusters of PCA distributions. The structures were obtained from cluster centers and superimposed with each other. Overall, it is observed that the mobility is higher for apo and 3CLpro/Z31792168 compared to the 3CLpro/α-ketoamide complex.
Figure 5.
Two-dimensional free energy landscapes (FELs) generated by projecting the principal components, PC1 and PC2 for (A) apo, (B) 3CLpro/α-ketoamide, and (C) 3CLpro/Z31792168. The representative structures are shown on the right panel.
3.4. Dihedral principal component (dPCA) analysis of loop
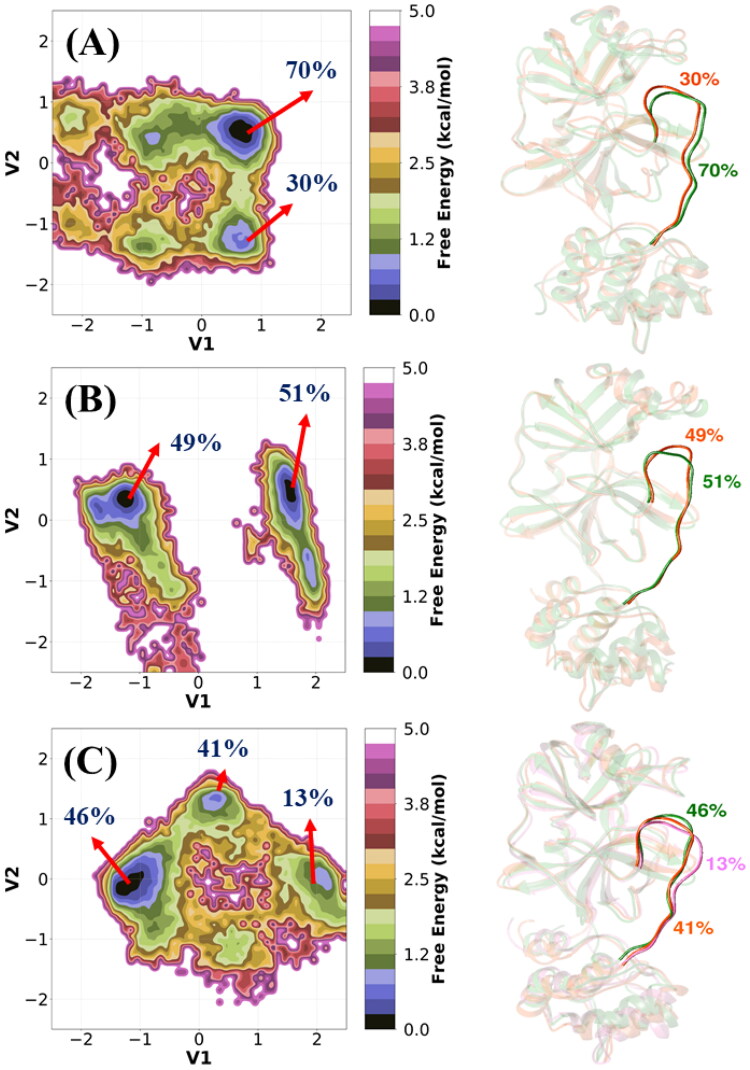
Cartesian coordinates based PCA does not provide the fully correct internal and overall dynamics. However, dPCA gives us information about internal and overall conformational dynamics. To further discover the conformational alterations of the loop (residues 185-200) connecting domains II and III, dihedral PCA (dPCA) was performed based on the dihedral angles (φi, ψi) of the peptide group in the loop (see Figure 6). The representative structures are obtained from the K-means clustering analysis and shown in Figure 6. Overall, Figure 6 indicates diverse loop conformations for each system.
Figure 6.
The two-dimensional free energy landscapes (FELs) of (A) apo, (B) 3CLpro/α-ketoamide, and (C) 3CLpro/Z31792168. FEL obtained from dPCA and their representative structures are shown on the right-hand panel.
The apo 3CLpro (Figure 6(A)) has one global minimum (70%) and one local minimum (30%). Similarly, the 3CLpro/α-ketoamide complex (Figure 6(B)) is characterized by two almost equiprobable free energy basins (51% and 49%). The conformational space of 3CLpro/Z31792168 is quite wider, as is evident from Figure 6(C). It is characterized by a global free energy basin (46%) and two local free energy minima (41% and 13%). In this analysis, we confirmed that this loop plays an important role in the inhibitor binding as well as controls the dynamical nature of 3CLpro. Finally, the inhibitor-induced fluctuation of this loop in 3CLpro demands more attention to the design of next-generation drugs.
3.5. Binding free energy analysis
To understand the biophysical basis of the molecular recognition of inhibitors by the receptor (3CLpro), the MD/MM-PBSA scheme was employed. It provides different individual components, such as ΔEvdW, ΔEelec, ΔGpol, ΔGnp, and TΔS, to the total binding free energy (ΔGBindsim). For binding free energy calculations of both complexes, 2000 structures were taken from the stable region, and 50 structures were considered for the entropy calculations.
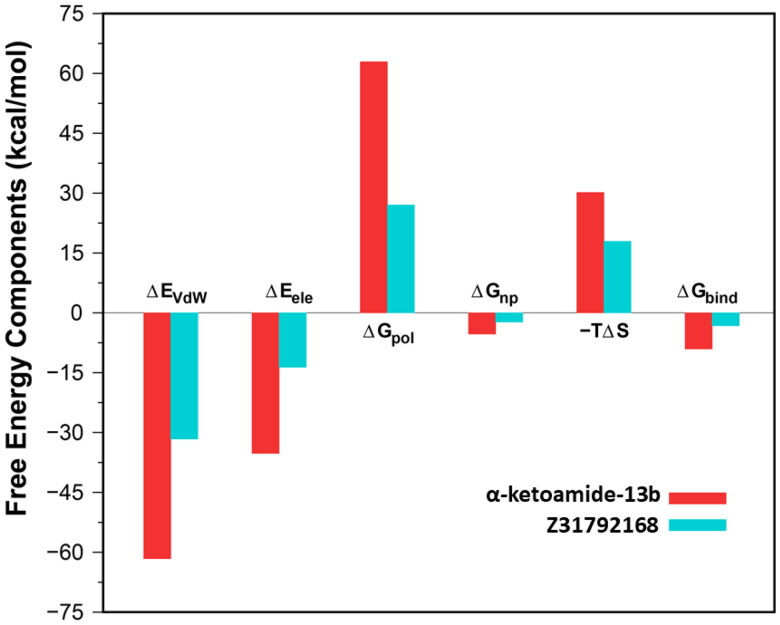
A summary of binding components in the binding free energy of inhibitors with 3CLpro is shown graphically in Figure 7, and the data are listed in Table 2. It is evident from Table 2 that the intermolecular van der Waals (ΔEvdW), electrostatic interactions (ΔEelec) and non-polar solvation energy (ΔGnp) favored the binding, while polar solvation free energy (ΔGpol) and the configurational entropy (-TΔS) disfavoured the complexation. For both cases, the net polar contribution (ΔEelec + ΔGpol) is positive, which means that the van der Waals interactions mainly drive the binding.
Figure 7.
Energy components (kcal/mol) for the binding of inhibitors to the 3CLpro. ΔEvdW, van der Waals energy; ΔEelect, electrostatics energy in the gas phase; ΔGpolar, polar solvation energy; ΔGnonpolar, nonpolar solvation energy; TΔSMM, configurational entropy contribution and ΔGbind, total binding energy.
Table 2.
Energetic components of the binding free energy for SARS-CoV-2-inhibitors complexes calculated using MM-PBSA (kcal/mol). Standard errors of the mean (SEM) are provided in parentheses.
| Components | α-ketoamide | Z31792168 | Lopinavir (Wang, 2020) | Darunavir (Sang et al., 2020) |
|---|---|---|---|---|
| ΔEvdW | −61.63 (0.10) | −31.61 (0.06) | −20.09 (0.63) | −41.32 |
| ΔEelec | −35.23 (0.13) | −13.64 (0.09) | −52.46 (0.33) | −5.80 |
| ΔGpol | 62.94 (0.13) | 27.08 (0.09) | 46.58 (0.56) | 29.01 |
| ΔGnp | −5.31 (0.00) | −2.99 (0.00) | −4.59 (0.02) | −4.75 |
| ΔGsolva | 57.63 (0.13) | 24.09 (0.09) | 41.99 (0.56) | 24.26 |
| ΔGpol + elecb | 27.71 (0.18) | 13.44 (0.13) | −5.88 (0.65) | 23.21 |
| ΔEMMc | −96.86 (0.16) | −45.25 (0.11) | −30.56 (0.71) | −47.12 |
| -TΔSd | 30.18 (0.81) | 17.92 (0.88) | −23.93 (0.01) | NA |
| ΔGTotale | −39.23 (0.11) | −21.16 (0.01) | −30.56 | −22.86 |
| ΔGBindsim | −9.05 (0.82) | −3.25 (0.88) | −6.63 (0.28) | NA |
| IC50Exp | 0.67 0.18 μM | NA | NA | NA |
ΔGsolv = ΔGnp + ΔGpol;
ΔGpol + elec = ΔEelec + ΔGpol;
ΔEMM = ΔEvdW + ΔEelec;
ΔS = configuration entropy;
ΔG = EvdW + ΔEelec + ΔGnp + ΔGpol, ΔGBind sim = EvdW + ΔEelec + ΔGnp + ΔGpol - (TΔS).
Further, Table 2 reveals that the estimated binding free energy (ΔGBindsim) of α-ketoamide is higher (-9.05 kcal/mol) than Z31792168 (-3.25 kcal/mol) although in the case of 3CLpro/α-ketoamide, unfavourable contributions from both ΔGpol (62.94 kcal/mol) and -TΔS (30.18 kcal/mol) are relatively higher compared to 3CLpro/Z31792168 (ΔGpol = 27.08 kcal/mol, TΔS = 17.92 kcal/mol). This is because ΔEvdW and ΔEelec are more favorable in 3CLpro/α-ketoamide (ΔEvdW = −61.63 kcal/mol, ΔEelec = −35.23 kcal/mol) than 3CLpro/Z31792168 (ΔEvdW = −31.61 kcal/mol, ΔEelec = −13.64 kcal/mol). Overall, our study suggests that α-ketoamide is more potent against COVID-19 main protease compared to Z31792168.
Next, in our study, the binding affinity of α-ketoamide was further evaluated and compared with the FDA approved anti-HIV protease inhibitors, such as lopinavir and darunavir, which has been reported as potent drugs against 3CLpro of SARS-CoV-2. Recently, the molecular recognition of lopinavir by the COVID-19 3CLpro has been investigated using the MMPBSA scheme (Wang, 2020), and the binding free energy of lopinavir was found to be lesser (-6.63 kcal/mol) than α-ketoamide (-9.05 kcal/mol) (see Table 2). It is further revealed that the electrostatic interaction (-52.46 kcal/mol) favored the complex formation more compared to the van der Waals interactions (-20.09 kcal/mol). This is in contrast to what has been observed for α-ketoamide. In the case of α-ketoamide, the van der Waals interactions energy is more favorable compared to the intermolecular electrostatic interactions. Similarly, in the case of darunavir/3CLpro, the van der Waals force is more favorable (-41.32 kcal/mol) than the electrostatic force (-5.80 kcal/mol) (Sang et al., 2020). Our study reports that the binding affinity decreases in the following order against COVID-19 3CLpro: α-ketoamide > lopinavir > darunavir > Z31792168 (See Table 2). Therefore, the inhibitor, α-ketoamide may be considered as a lead compound in the discovery of rational drugs against COVID-19.
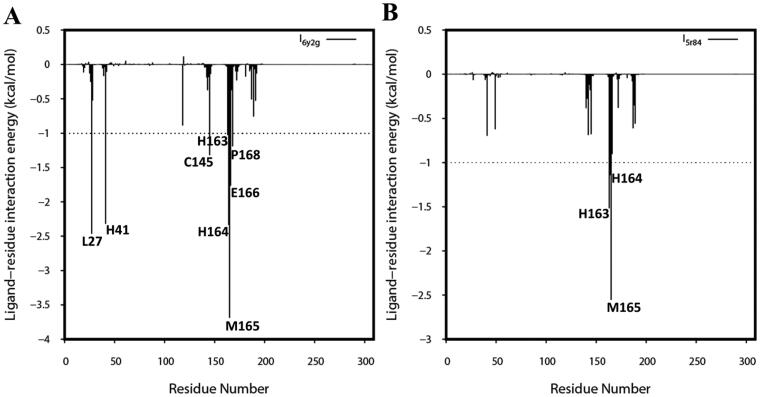
Subsequently, we explored the critical residues involved in the receptor-ligand binding by performing the per-residue decomposition of free energy using MMGBSA. The receptor-ligand interaction spectra were shown in Figure 8. A hotspot residue is considered in the MM-GBSA interaction energy when it is higher than -1.0 kcal/mol and reported in Table 3. It is evident from Table 2 that a more significant number of hotspot residues (Met165, Leu27, His164, His41, Glu166, Cys145, Pro168, and His163) contributes favorably to the binding of α-ketoamide in comparison to Z31792168 (Met165, His163, and His164). This might be one of the reasons for the higher affinity of α-ketoamide relative to Z31792168 against 3CLpro. It can further be observed from Table 3 that the catalytic dyad, His41 (-2.32 kcal/mol), and Cys145 (-1.32 kcal/mol) contribute more significantly to the binding of α-ketoamide than Z31792168. Overall, the identification of hotspot residues from our analysis can facilitate the discovery of new selective inhibitor against COVID-19 3CLpro.
Figure 8.
Decomposition of ΔGbindsim into contributions from individual residues for (A) 3CLpro/α-ketoamide and (B) 3CLpro/Z31792168.
Table 3.
Decomposition of binding free energy into contributions from individual residuesa.
| Residue | EvdW | Eelec | Gpol | Gnp | Gside_chain | Gbackbone | Gtotal |
|---|---|---|---|---|---|---|---|
| 3CLpro/α-ketoamide | |||||||
| Met165 | −2.95 | −1.82 | 1.30 | −0.23 | −2.03 | −1.67 | −3.70 |
| Leu27 | −2.05 | −0.47 | 0.23 | −0.18 | −1.79 | −0.68 | −2.47 |
| His164 | −1.80 | −4.15 | 3.70 | −0.09 | −0.31 | −2.03 | −2.34 |
| His41 | −2.04 | −2.49 | 2.43 | −0.22 | −2.18 | −0.14 | −2.32 |
| Glu166 | −3.10 | −4.14 | 5.99 | −0.51 | −0.37 | −1.39 | −1.76 |
| Cys145 | −1.86 | −0.56 | 1.26 | −0.16 | −1.08 | −0.24 | −1.32 |
| Pro168 | −1.07 | −0.02 | 0.13 | −0.23 | −0.79 | −0.40 | −1.19 |
| His163 | −0.54 | −2.98 | 2.56 | −0.06 | −0.96 | −0.06 | −1.02 |
| 3CLpro/Z31792168 | |||||||
| Met165 | −2.11 | −1.07 | 0.82 | −0.20 | −1.47 | −1.09 | −2.56 |
| His163 | −0.37 | −2.86 | 1.74 | −0.03 | −1.43 | −0.09 | −1.52 |
| His164 | −0.95 | −2.24 | 2.12 | −0.08 | −0.23 | −0.92 | −1.15 |
Energetic contributions from the van der Waals (EvdW) and electrostatic interactions (Eelec) as well as polar (Gpol) and nonpolar solvation energy (Gnp) and the total contribution of given residue (Gtotal) for SARS-CoV-2-inhibitor complexes are listed. Gside_chain and Gbackbone represent the side chain and backbone contributions. Only residues with | ΔG | ≥ 1.0 kcal/mol are shown. All values are given in kcal/mol.
Subsequently, to compliment the above results, we have performed the hydrogen bond (H-bond) analysis for both the complexes on their respective MD trajectories and the H-bond occupancies are reported in Table 4. It is observed from Table 4 that in the case of 3CLpro/α-ketoamide, residues His41, Glu166, and His164 (∼ 42%) form H-bond with the inhibitor with an occupancy of > 40% during the simulation. However, in the case of 3CLpro/Z31792168, the highest H-bond occupancy is obtained for only Glu166 (∼ 35%). This explains why the intermolecular electrostatic interaction is stronger in 3CLpro/α-ketoamide compared to 3CLpro/Z31792168. Besides, the number of H-bond as a function of simulations time is shown in Figure S5 (Supporting Information), which also ensures that a higher number of H-bond persists for 3CLpro/α-ketoamide compared to 3CLpro/Z31792168, suggesting the strong bonding of the inhibitor α-ketoamide with 3CLpro.
Table 4.
The hydrogen bonds formed between SARS-CoV-2 and inhibitor and the corresponding average distance and percent determined using the MD trajectories in the MD simulations.
| Binding couples |
MD |
||
|---|---|---|---|
| Acceptor | Donor | Avg. Distance (Å)a | Occupancy (%)b |
| 3CLpro/α-ketoamide | |||
| Lig@O40 | His41@NE2 | 2.88 | 43.12 |
| Lig@O22 | Glu166@N | 2.90 | 42.53 |
| His164@O | Lig@N38 | 2.88 | 41.76 |
| Lig@O48 | His163@NE2 | 2.83 | 29.97 |
| Glu166@O | Lig@N23 | 2.87 | 24.43 |
| Glu166@OE2 | Lig@N49 | 2.84 | 23.06 |
| Glu166@OE1 | Lig@N49 | 2.84 | 13.17 |
| Leu27@HD23 | Lig@N36 | 2.82 | 10.33 |
| Leu27@HD21 | Lig@N36 | 2.83 | 10.25 |
| Leu27@HD22 | Lig@N36 | 2.84 | 09.78 |
| Asn142@OD1 | Lig@N36 | 2.82 | 09.56 |
| Lig@O41 | Gly143@N | 2.84 | 07.98 |
| Lig@H20 | Gln189@N | 2.85 | 05.10 |
| 3CLpro/Z31792168 | |||
| Lig@O | Glu166@N | 2.87 | 34.55 |
| His164@O | Lig@N | 2.84 | 25.34 |
| Lig@N1 | His163@NE2 | 2.91 | 09.19 |
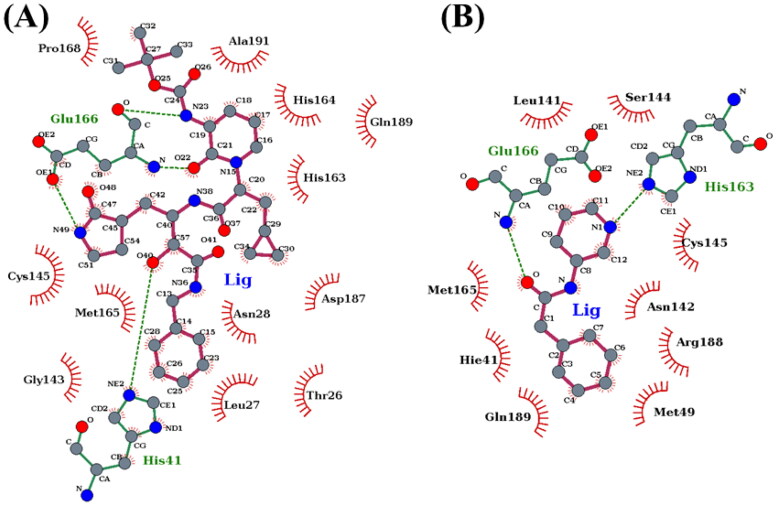
A detailed interaction profile of residues involving H-bond and hydrophobic interactions is also computed using LigPlot (Wallace et al., 1995) and shown in Figure 9. It suggests that one of the catalytic dyad residues, His41 plays a significant role in forming a strong H-bond with α-ketoamide. Also, the hydrophobic contacts resulting from the hydrophobic residues for both the complexes throughout the simulations were computed and shown in Supporting Information Figure S6. It also suggests the highest number of hydrophobic contacts remain in the case of 3CLpro/α-ketoamide, which is in agreement with the finding that the net nonpolar interaction (ΔEvdW + ΔGnp) is more favorable in 3CLpro/α-ketoamide compared to 3CLpro/Z31792168. Overall, our investigations reveal that α-ketoamide is a more potent lead molecule against 2019-nCoV 3CLpro than the FDA approved anti-HIV1 protease inhibitors, such as lopinavir and darunavir which is being recently focused in the treatment of COVID-19.
Figure 9.
The receptor-ligand interaction profile for (A) α-ketoamide and (B) Z31792168. The plots are generated by using Ligplot+. Hydrogen bonds are shown as green dotted lines. Red semicircles show the residues involved in the hydrophobic contacts, and residues involved in hydrogen bonds are represented in green. The inhibitors are described as balls and sticks.
4. Conclusion
The recent outbreak of COVID-19 has caused a severe strain in the public health system in many countries. COVID-19 can cause mild to severe illness. The current situation demands an efficacious vaccine or novel antiviral drugs targeting COVID-19. Herein, we have studied the mechanism of binding of two potential inhibitors, namely α-ketoamide and Z31792168 to COVID-19 main protease (3CLpro) by using an atomistic molecular dynamics simulation of 100 ns in conjunction with the widely used molecular mechanics/Poisson-Boltzmann surface area (MM/PBSA) scheme. Our study shows that the 3CLpro-inhibitor complexation is favored by the intermolecular van der Waals and electrostatic interactions as well as nonpolar solvation free energy. We have also demonstrated that the inhibitor α-ketoamide is more potent compared to Z31792168 due to an increased favorable contribution from the intermolecular van der Waals and electrostatic interactions relative to Z31792168. Furthermore, in the case of α-ketoamide, the nonpolar component of the solvation free energy is also slightly more favorable compared to Z31792168. We have also identified the hotspot residues controlling the receptor-ligand binding. Finally, our study also reveals that α-ketoamide has a better binding affinity compared to anti-HIV retroviral drugs, such as darunavir and lopinavir. Overall, α-ketoamide can be used as a lead compound in the development of drugs targeting SARS-CoV-2 3CLpro, and our study might play a useful role for the same.
Disclosure statement
No potential conflict of interest was reported by the authors.
Supplementary Material
Glossary
Abbreviation
- AM1-BCC
Austin Model 1- Bond Charge Correction
- 3CLpro
Chymotrypsin-like protease
- COVID-19
Coronavirus Disease 2019
- DCC
Dynamic Cross Correlation
- dPCA
Dihedral Principal Component Analysis
- DRV
Darunavir
- GAFF
Generalized Amber Force Field
- HIV
Human Immunodeficiency Virus
- LPV
Lopinavir
- MD
Molecular Dynamics
- MMPBSA
Molecular Mechanics Poisson-Boltzmann Surface Area
- nCoV
Novel Coronavirus
- NMA
Normal Mode Analysis
- PCA
Principal Component Analysis
- PME
Particle-Mesh Ewald
- RMSD
Root Mean Square Deviations
- RMSF
Root Mean Square Fluctuations
- SARS-CoV-2
Severe Acute Respiratory Syndrome-Coronavirus-2
- SASA
Solvent Accessible Surface Area
- TIP3P
Transferable Inter-Potential with 3 Point Charge
Funding Statement
This work was partially supported by the Department of Biotechnology, Govt. of India (grant number BT/RLF/Re-entry/40/2014, DBT-Ramalingaswami Re-entry Fellowship), and Department of Science and Technology (DST), Govt. of India (grant number ECR/2017/000010). MFS would like to thank DST, Govt. of India, for providing with the INSPIRE Fellowship (DST/INSPIRE Fellowship/2017/IF170145).
References
- Aanouz I., Belhassan A., El Khatabi K., Lakhlifi T., El Idrissi M., & Bouachrine M. (2020). Moroccan Medicinal plants as inhibitors of COVID-19: Computational investigations. Journal of Biomolecular Structure and Dynamics. 10.1080/07391102.07392020.01758790 [DOI] [PMC free article] [PubMed] [Google Scholar]
- Abdelli I., Hassani F., Bekkel Brikci S., & Ghalem S. (2020). In silico study the inhibition of Angiotensin converting enzyme 2 receptor of COVID-19 by Ammoides verticillata components harvested from western Algeria. Journal of Biomolecular Structure and Dynamics. 10.1080/07391102.07392020.01763199 [DOI] [PMC free article] [PubMed] [Google Scholar]
- Alamri M. A., ul Qamar M. T., & Alqahtani S. M. (2020). Pharmacoinformatics and molecular dynamic simulation studies reveal potential inhibitors of SARS-CoV-2 main protease 3CLpro. Preprints. 10.20944/preprints202002.200308.v202001. [DOI] [PMC free article] [PubMed] [Google Scholar]
- Berendsen H. J., Postma J. v., van Gunsteren W. F., DiNola A., & Haak J. (1984). Molecular dynamics with coupling to an external bath. The Journal of Chemical Physics, 81(8), 3684–3690. 10.1063/1.448118 [DOI] [Google Scholar]
- Berman H. M., Battistuz T., Bhat T. N., Bluhm W. F., Bourne P. E., Burkhardt K., Feng Z., Gilliland G. L., Iype L., Jain S., Fagan P., Marvin J., Padilla D., Ravichandran V., Schneider B., Thanki N., Weissig H., Westbrook J. D., & Zardecki C. (2002). The protein data bank. Acta Crystallographica. Section D, Biological Crystallography, 58(Pt 6 No 1), 899–907. 10.1107/s0907444902003451 [DOI] [PubMed] [Google Scholar]
- Boopathi S., Poma A. B., & Kolandaivel P. (2020). Novel 2019 Coronavirus Structure, Mechanism of Action, Antiviral drug promises and rule out against its treatment. Journal of Biomolecular Structure and Dynamics. 10.1080/07391102.07392020.01758788 [DOI] [PMC free article] [PubMed] [Google Scholar]
- Case D. A., Ben-Shalom I. Y., Brozell S. R., Cerutti D. S., Cheatham T. E. III, Cruzeiro V. W. D., Darden T. A., Duke R. E., Ghoreishi D., Gilson M. K., Gohlke H., Goetz A. W., Greene D., Harris R., Homeyer N., Izadi S., Kovalenko A., Kurtzman T., Lee T. S., … Kollman P. A. (2018). AMBER 2018. University of California. [Google Scholar]
- Chang C-K., Hou M.-H., Chang C.-F., Hsiao C.-D., & Huang T-H. (2014). The SARS coronavirus nucleocapsid protein-forms and functions. Antiviral Research, 103, 39–50. 10.1016/j.antiviral.2013.12.009 [DOI] [PMC free article] [PubMed] [Google Scholar]
- Darden T., York D., & Pedersen L. (1993). Particle mesh Ewald: An N⋅ log (N) method for Ewald sums in large systems. Journal of Chemical Physics, 98(12), 10089–10092. 10.1063/1.464397 [DOI] [Google Scholar]
- Das S., Sarmah S., Lyndem S., & Singha Roy A. (2020). An investigation into the identification of potential inhibitors of SARS-CoV-2 main protease using molecular docking study. Journal of Biomolecular Structure and Dynamics. 10.1080/07391102.07392020.01763201 [DOI] [PMC free article] [PubMed] [Google Scholar]
- Elfiky A. A. (2020). Natural products may interfere with SARS-CoV-2 attachment to the host cell. Journal of Biomolecular Structure and Dynamics. 10.1080/07391102.07392020.01761881 [DOI] [PMC free article] [PubMed] [Google Scholar]
- Elfiky A. A. (2020). SARS-CoV-2 RNA dependent RNA polymerase (RdRp) targeting: An in silico perspective. Journal of Biomolecular Structure and Dynamics. 10.1080/07391102.07392020.01761882 [DOI] [PMC free article] [PubMed] [Google Scholar]
- Elfiky A. A., & Azzam E. B. (2020). Novel Guanosine Derivatives against MERS CoV polymerase: An in silico perspective. Journal of Biomolecular Structure and Dynamics. 10.1080/07391102.07392020.01758789 [DOI] [PMC free article] [PubMed] [Google Scholar]
- Elmezayen A. D., Al-Obaidi A., Şahin A. T., & Yelekçi K. (2020). Drug repurposing for coronavirus (COVID-19): In silico screening of known drugs against coronavirus 3CL hydrolase and protease enzymes. Journal of Biomolecular Structure and Dynamics. 10.1080/07391102.07392020.01758791 [DOI] [PMC free article] [PubMed] [Google Scholar]
- Enayatkhani M., Hasaniazad M., Faezi S., Guklani H., Davoodian P., Ahmadi N., Einakian M. A., Karmostaji A., & Ahmadi K. (2020). Reverse vaccinology approach to design a novel multi-epitope vaccine candidate against COVID-19: An in silico study. Journal of Biomolecular Structure and Dynamics. 10.1080/07391102.07392020.01756411 [DOI] [PMC free article] [PubMed] [Google Scholar]
- Fearon D., Powell A. J., Douangamath A., Owen C. D., Wild C., Krojer T., Lukacik P., Strain-Damerell C. M., Walsh M. A., von Delft F. (2020). PanDDA analysis of COVID-19 main protease against the DSI-poised Fragment Library http://www.rcsb.org/structure/5R84.
- Fiser A., & Šali A. (2003). Modeller: Generation and refinement of homology-based protein structure models. Methods in Enzymology, Elsevier, 374, 461–491. [DOI] [PubMed] [Google Scholar]
- Frauenfelder H., Sligar S. G., & Wolynes P. G. (1991). The energy landscapes and motions of proteins. Science (New York, N.Y.), 254(5038), 1598–1603. 10.1126/science.1749933 [DOI] [PubMed] [Google Scholar]
- Gupta M. K., Vemula S., Donde R., Gouda G., Behera L., & Vadde R. (2020). In-silico approaches to detect inhibitors of the human severe acute respiratory syndrome coronavirus envelope protein ion channel. Journal of Biomolecular Structure and Dynamics. 10.1080/07391102.07392020.01751300 [DOI] [PMC free article] [PubMed] [Google Scholar]
- Hartigan J. A., & Wong M. A. (1979). Algorithm AS 136: A k-means clustering algorithm. Journal of the Royal Statistical Society. Series C (Applied Statistics), 28(1), 100–108. 10.2307/2346830 [DOI] [Google Scholar]
- Hasan A., Paray B. A., Hussain A., Qadir F. A., Attar F., Aziz F. M., Sharifi M., Derakhshankhah H., Rasti B., & Mehrabi M. (2020). A review on the cleavage priming of the spike protein on coronavirus by angiotensin-converting enzyme-2 and furin. Journal of Biomolecular Structure and Dynamics. 10.1080/07391102.07392020.01754293 [DOI] [PMC free article] [PubMed] [Google Scholar]
- Hess B., Kutzner C., Van Der Spoel D., & Lindahl E. (2008). GROMACS 4: Algorithms for highly efficient, load-balanced, and scalable molecular simulation. Journal of Chemical Theory and Computation, 4(3), 435–447. 10.1021/ct700301q [DOI] [PubMed] [Google Scholar]
- Hui D. S., I Azhar E., Madani T. A., Ntoumi F., Kock R., Dar O., Ippolito G., Mchugh T. D., Memish Z. A., Drosten C., Zumla A., & Petersen E. (2020). The continuing 2019-nCoV epidemic threat of novel coronaviruses to global health—The latest 2019 novel coronavirus outbreak in Wuhan. International Journal of Infectious Diseases: IJID : Official Publication of the International Society for Infectious Diseases, 91, 264–266. 10.1016/j.ijid.2020.01.009 [DOI] [PMC free article] [PubMed] [Google Scholar]
- Humphrey W., Dalke A., & Schulten K. (1996). VMD: Visual molecular dynamics. Journal of Molecular Graphics, 14(1), 33–38. 10.1016/0263-7855(96)00018-5 [DOI] [PubMed] [Google Scholar]
- Hünenberger P., Mark A., & Van Gunsteren W. (1995). Fluctuation and cross-correlation analysis of protein motions observed in nanosecond molecular dynamics simulations. Journal of Molecular Biology, 252(4), 492–503. 10.1006/jmbi.1995.0514 [DOI] [PubMed] [Google Scholar]
- Ichiye T., & Karplus M. (1991). Collective motions in proteins: A covariance analysis of atomic fluctuations in molecular dynamics and normal mode simulations. Proteins: Structure, Function, and Genetics, 11(3), 205–217. 10.1002/prot.340110305 [DOI] [PubMed] [Google Scholar]
- Islam R., Parves R., Paul A. S., Uddin N., Rahman M. S., Mamun A. A., Hossain M. N., Ali M. A., & Halim M. A. (2020). A Molecular Modeling Approach to Identify Effective Antiviral Phytochemicals against the Main Protease of SARS-CoV-2. Journal of Biomolecular Structure and Dynamics. 10.1080/07391102.07392020.01761883 [DOI] [PMC free article] [PubMed] [Google Scholar]
- Jakalian A., Jack D. B., & Bayly C. I. (2002). Fast, efficient generation of high‐quality atomic charges. AM1‐BCC model: II. Parameterization and validation. Journal of Computational Chemistry, 23(16), 1623–1641. 10.1002/jcc.10128 [DOI] [PubMed] [Google Scholar]
- Jin Z., Du X., Xu Y., Deng Y., Liu M., Zhao Y., Zhang B., Li X., Zhang L., & Peng C. (2020). Structure of Mpro from COVID-19 virus and discovery of its inhibitors. Nature. 10.1038/s41586-41020-42223-y. [DOI] [PubMed] [Google Scholar]
- Jonniya N. A., & Kar P. (2020). Investigating specificity of the anti-hypertensive inhibitor WNK463 against With-No-Lysine kinase family isoforms via multiscale simulations. Journal of Biomolecular Structure & Dynamics, 38(5), 1306–1321. 10.1080/07391102.2019.1602079 [DOI] [PubMed] [Google Scholar]
- Jonniya N. A., Sk M. F., & Kar P. (2019). Investigating Phosphorylation-Induced Conformational Changes in WNK1 Kinase by Molecular Dynamics Simulations. ACS Omega, 4(17), 17404–17416. 10.1021/acsomega.9b02187 [DOI] [PMC free article] [PubMed] [Google Scholar]
- Joshi R. S., Jagdale S. S., Bansode S. B., Shankar S. S., Tellis M. B., Pandya V. K., Chugh A., Giri A. P., & Kulkarni M. J. (2020). Discovery of potential multi-target-directed ligands by targeting host-specific SARS-CoV-2 structurally conserved main protease$. Journal of Biomolecular Structure and Dynamics. 10.1080/07391102.07392020.01760137 [DOI] [PMC free article] [PubMed] [Google Scholar]
- Kar P., & Knecht V. (2012. a). Energetic basis for drug resistance of HIV-1 protease mutants against amprenavir. Journal of Computer-Aided Molecular Design, 26(2), 215–232. 10.1007/s10822-012-9550-5 [DOI] [PubMed] [Google Scholar]
- Kar P., & Knecht V. (2012. b). Energetics of mutation-induced changes in potency of lersivirine against HIV-1 reverse transcriptase. The Journal of Physical Chemistry B, 116(22), 6269–6278. 10.1021/jp300818c [DOI] [PubMed] [Google Scholar]
- Kar P., & Knecht V. (2012. c). Mutation-induced loop opening and energetics for binding of tamiflu to influenza N8 neuraminidase. The Journal of Physical Chemistry B, 116(21), 6137–6149. 10.1021/jp3022612 [DOI] [PubMed] [Google Scholar]
- Kar P., & Knecht V. (2012. d). Origin of decrease in potency of darunavir and two related antiviral inhibitors against HIV-2 compared to HIV-1 protease. The Journal of Physical Chemistry B, 116(8), 2605–2614. 10.1021/jp211768n [DOI] [PubMed] [Google Scholar]
- Kar P., Lipowsky R., & Knecht V. (2011). Importance of polar solvation for cross-reactivity of antibody and its variants with steroids. The Journal of Physical Chemistry B, 115(23), 7661–7669. 10.1021/jp201538t [DOI] [PubMed] [Google Scholar]
- Kar P., Lipowsky R., & Knecht V. (2013). Importance of polar solvation and configurational entropy for design of antiretroviral drugs targeting HIV-1 protease. The Journal of Physical Chemistry B, 117(19), 5793–5805. 10.1021/jp3085292 [DOI] [PubMed] [Google Scholar]
- Kar P., Seel M., Hansmann U. H., & Höfinger S. (2007). Dispersion Terms and Analysis of size- and charge dependence in an enhanced Poisson-Boltzmann approach . The Journal of Physical Chemistry B, 111(30), 8910–8918. 10.1021/jp072302u [DOI] [PMC free article] [PubMed] [Google Scholar]
- Kar P., Wei Y., Hansmann U. H., & Höfinger S. (2007). Systematic study of the boundary composition in Poisson Boltzmann calculations. Journal of Computational Chemistry, 28(16), 2538–2544. 10.1002/jcc.20698 [DOI] [PubMed] [Google Scholar]
- Khan R. J., Jha R. K., Amera G., Jain M., Singh E., Pathak A., Singh R. P., Muthukumaran J., & Singh A. K. (2020). Targeting SARS-CoV-2: A systematic drug repurposing approach to identify promising inhibitors against 3C-like Proteinase and 2’-O-RiboseMethyltransferase. Journal of Biomolecular Structure and Dynamics. 10.1080/07391102.07392020.01753577 [DOI] [PMC free article] [PubMed] [Google Scholar]
- Khan S. A., Zia K., Ashraf S., Uddin R., & Ul-Haq Z. (2020). Identification of Chymotrypsin-like Protease Inhibitors of SARS-CoV-2 Via Integrated Computational Approach. Journal of Biomolecular Structure and Dynamics. 10.1080/07391102.07392020.01751298 [DOI] [PubMed] [Google Scholar]
- Kollman P. A., Massova I., Reyes C., Kuhn B., Huo S., Chong L., Lee M., Lee T., Duan Y., Wang W., Donini O., Cieplak P., Srinivasan J., Case D. A., & Cheatham T. E. (2000). Calculating structures and free energies of complex molecules: Combining molecular mechanics and continuum models. Accounts of Chemical Research, 33(12), 889–897. 10.1021/ar000033j [DOI] [PubMed] [Google Scholar]
- Kräutler V., van Gunsteren W. F., & Hünenberger P. H. (2001). A fast SHAKE algorithm to solve distance constraint equations for small molecules in molecular dynamics simulations. Journal of Computational Chemistry, 22(5), 501–508. [DOI] [Google Scholar]
- Lin S., Shen R., He J., Li X., & Guo X. (2020). Molecular modeling evaluation of the binding effect of ritonavir, lopinavir and darunavir to severe acute respiratory syndrome coronavirus 2 proteases. bioRxiv. 10.1101/2020.1101.1131.929695. [DOI] [Google Scholar]
- Loncharich R. J., Brooks B. R., & Pastor R. W. (1992). Langevin dynamics of peptides: The frictional dependence of isomerization rates of N-acetylalanyl-N'-methylamide. Biopolymers: Original Research on Biomolecules, 32(5), 523–535. 10.1002/bip.360320508 [DOI] [PubMed] [Google Scholar]
- Maier J. A., Martinez C., Kasavajhala K., Wickstrom L., Hauser K. E., & Simmerling C. (2015). ff14SB: improving the accuracy of protein side chain and backbone parameters from ff99SB. Journal of Chemical Theory and Computation, 11(8), 3696–3713. 10.1021/acs.jctc.5b00255 [DOI] [PMC free article] [PubMed] [Google Scholar]
- McCammon J. (1984). Protein dynamics. Reports on Progress in Physics, 47(1), 1–46. 10.1088/0034-4885/47/1/001 [DOI] [Google Scholar]
- Muralidharan N., Sakthivel R., Velmurugan D., & Gromiha M. M. (2020). Computational studies of drug repurposing and synergism of lopinavir, oseltamivir and ritonavir binding with SARS-CoV-2 Protease against COVID-19. Journal of Biomolecular Structure and Dynamics. 10.1080/07391102.07392020.01752802 [DOI] [PubMed] [Google Scholar]
- Olsson M. H., Søndergaard C. R., Rostkowski M., & Jensen J. H. (2011). PROPKA3: Consistent treatment of internal and surface residues in empirical pKa Predictions. Journal of Chemical Theory and Computation, 7(2), 525–537. 10.1021/ct100578z [DOI] [PubMed] [Google Scholar]
- Onufriev A., Bashford D., & Case D. A. (2004). Exploring protein native states and large‐scale conformational changes with a modified generalized born model. Proteins: Structure, Function, and Bioinformatics, 55(2), 383–394. 10.1002/prot.20033 [DOI] [PubMed] [Google Scholar]
- Pant S., Singh M., Ravichandiran V., Murty U., & Srivastava H. K. (2020). Peptide-like and small-molecule inhibitors against Covid-19. Journal of Biomolecular Structure and Dynamics. 10.1080/07391102.07392020.01757510 [DOI] [PMC free article] [PubMed] [Google Scholar]
- Pettersen E. F., Goddard T. D., Huang C. C., Couch G. S., Greenblatt D. M., Meng E. C., & Ferrin T. E. (2004). UCSF Chimera-a visualization system for exploratory research and analysis. Journal of Computational Chemistry, 25(13), 1605–1612. 10.1002/jcc.20084 [DOI] [PubMed] [Google Scholar]
- Price D. J., & Brooks C. L. III, (2004). A modified TIP3P water potential for simulation with Ewald summation. The Journal of Chemical Physics, 121(20), 10096–10103. 10.1063/1.1808117 [DOI] [PubMed] [Google Scholar]
- Roe D. R., & Cheatham T. E. III, (2013). PTRAJ and CPPTRAJ: Software for processing and analysis of molecular dynamics trajectory data. Journal of Chemical Theory and Computation, 9(7), 3084–3095. 10.1021/ct400341p [DOI] [PubMed] [Google Scholar]
- Rota P. A., Oberste M. S., Monroe S. S., Nix W. A., Campagnoli R., Icenogle J. P., Peñaranda S., Bankamp B., Maher K., Chen M.-H., Tong S., Tamin A., Lowe L., Frace M., DeRisi J. L., Chen Q., Wang D., Erdman D. D., Peret T. C. T., … Bellini W. J. (2003). Characterization of a novel coronavirus associated with severe acute respiratory syndrome. Science (New York, N.Y.), 300(5624), 1394–1399. 10.1126/science.1085952 [DOI] [PubMed] [Google Scholar]
- Roy R., Ghosh B., & Kar P. (2020). Investigating conformational dynamics of Lewis Y Oligosaccharides and elucidating blood group dependency of cholera using molecular dynamics. ACS Omega, 5(8), 3932–3942. 10.1021/acsomega.9b03398 [DOI] [PMC free article] [PubMed] [Google Scholar]
- Salomon‐Ferrer R., Case D. A., & Walker R. C. (2013). An overview of the Amber biomolecular simulation package. Wiley Interdisciplinary Reviews: Computational Molecular Science, 3(2), 198–210. 10.1002/wcms.1121 [DOI] [Google Scholar]
- Sang P., Tian S.-H., Meng Z.-H., & Yang L.-Q. (2020). Insight derived from molecular docking and molecular dynamics simulations into the binding interactions between HIV-1 protease inhibitors and SARS-CoV-2 3CLpro. chemRxiv. 10.26434/chemrxiv.11932995.v11932991. [DOI] [Google Scholar]
- Sarma P., Sekhar N., Prajapat M., Avti P., Kaur H., Kumar S., Singh S., Kumar H., Prakash A., & Dhibar D. P. (2020). In-silico homology assisted identification of inhibitor of RNA binding against 2019-nCoV N-protein (N terminal domain). Journal of Biomolecular Structure and Dynamics, 10.1080/07391102.07392020.01753580 [DOI] [PMC free article] [PubMed] [Google Scholar]
- Sinha S. K., Shakya A., Prasad S. K., Singh S., Gurav N. S., Prasad R. S., & Gurav S. S. (2020). An in-silico evaluation of different Saikosaponins for their potency against SARS-CoV-2 using NSP15 and fusion spike glycoprotein as targets. Journal of Biomolecular Structure and Dynamics. 10.1080/07391102.07392020.01762741 [DOI] [PMC free article] [PubMed] [Google Scholar]
- Sk M. F., Roy R., & Kar P. (2020). Exploring the potency of currently used drugs against HIV-1 protease of subtype D variant by using multiscale simulations. Journal of Biomolecular Structure and Dynamics. 10.1080/07391102.07392020.01724196 [DOI] [PubMed] [Google Scholar]
- Umesh D. K., Selvaraj C., Singh S. K., & Dubey V. K. (2020). Identification of new anti-nCoV drug chemical compounds from Indian spices exploiting SARS-CoV-2 main protease as target. Journal of Biomolecular Structure and Dynamics. 10.1080/07391102.07392020.01763202 [DOI] [PMC free article] [PubMed] [Google Scholar]
- Wahedi H. M., Ahmad S., & Abbasi S. W. (2020). Stilbene-based natural compounds as promising drug candidates against COVID-19. Journal of Biomolecular Structure and Dynamics. 10.1080/07391102.07392020.01762743 [DOI] [PubMed] [Google Scholar]
- Wallace A. C., Laskowski R. A., & Thornton J. M. (1995). LIGPLOT: A program to generate schematic diagrams of protein-ligand interactions. Protein Engineering, Design and Selection, 8(2), 127–134. 10.1093/protein/8.2.127 [DOI] [PubMed] [Google Scholar]
- Wan Y., Shang J., Graham R., Baric R. S., & Li F. (2020). Receptor recognition by the novel coronavirus from wuhan: An analysis based on decade-long structural studies of SARS coronavirus. Journal of Virology, 94(7), e00127–00120. 10.1128/JVI.00127-20 [DOI] [PMC free article] [PubMed] [Google Scholar]
- Wang J. (2020). Fast identification of possible drug treatment of coronavirus disease-19 (COVID-19) through computational drug repurposing study. Journal of Chemical Information and Modeling. 10.1021/acs.jcim.1020c00179 [DOI] [PMC free article] [PubMed] [Google Scholar]
- Wang J., Wang W., Kollman P. A., & Case D. A. (2001). Antechamber: An accessory software package for molecular mechanical calculations. J. Am. Chem. Soc, 222, U403. [Google Scholar]
- Wang J., Wang W., Kollman P. A., & Case D. A. (2006). Automatic atom type and bond type perception in molecular mechanical calculations. Journal of Molecular Graphics & Modelling, 25(2), 247–260. 10.1016/j.jmgm.2005.12.005 [DOI] [PubMed] [Google Scholar]
- Wang J., Wolf R. M., Caldwell J. W., Kollman P. A., & Case D. A. (2004). Development and testing of a general amber force field. Journal of Computational Chemistry, 25(9), 1157–1174. 10.1002/jcc.20035 [DOI] [PubMed] [Google Scholar]
- Webb B., & Sali A. (2014). Comparative protein structure modeling using MODELLER. Current Protocols in Bioinformatics, 47(1), 5.6.1–5.6.32. 5.6. 1-5.6. 32. 10.1002/0471250953.bi0506s47 [DOI] [PubMed] [Google Scholar]
- Woo P. C., Huang Y., Lau S. K., & Yuen K.-Y. (2010). Coronavirus genomics and bioinformatics analysis. Viruses, 2(8), 1804–1820. 10.3390/v2081803 [DOI] [PMC free article] [PubMed] [Google Scholar]
- Wu J. T., Leung K., & Leung G. M. (2020). Nowcasting and forecasting the potential domestic and international spread of the 2019-nCoV outbreak originating in Wuhan, China: A modelling study. The Lancet, 395(10225), 689–697. 10.1016/S0140-6736(20)30260-9 [DOI] [PMC free article] [PubMed] [Google Scholar]
- Xu B., Shen H., Zhu X., & Li G. (2011). Fast and accurate computation schemes for evaluating vibrational entropy of proteins. Journal of Computational Chemistry, 32(15), 3188–3193. 10.1002/jcc.21900 [DOI] [PubMed] [Google Scholar]
- Zhang L., Lin D., Sun X., Curth U., Drosten C., Sauerhering L., Becker S., Rox K., & Hilgenfeld R. (2020). Crystal structure of SARS-CoV-2 main protease provides a basis for design of improved α-ketoamide inhibitors. Science, 368, 409–412. [DOI] [PMC free article] [PubMed] [Google Scholar]
Associated Data
This section collects any data citations, data availability statements, or supplementary materials included in this article.


