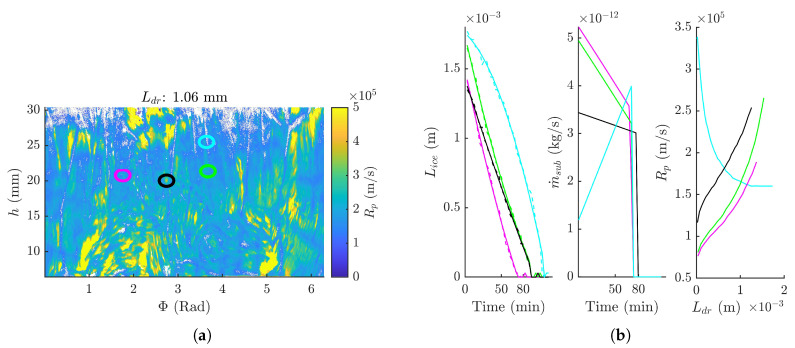
Figure 7.
(a) at a of 1.06 mm for every (, h) coordinate for the 4% BSA formulation. Four noteworthy different regions (circles) were selected in the surface plot. (b) Following data were plotted for each of the selected point: in function of time (left) with dashed lines the raw data and full lines the smoothed data; in function of time (middle); in function of (right).

