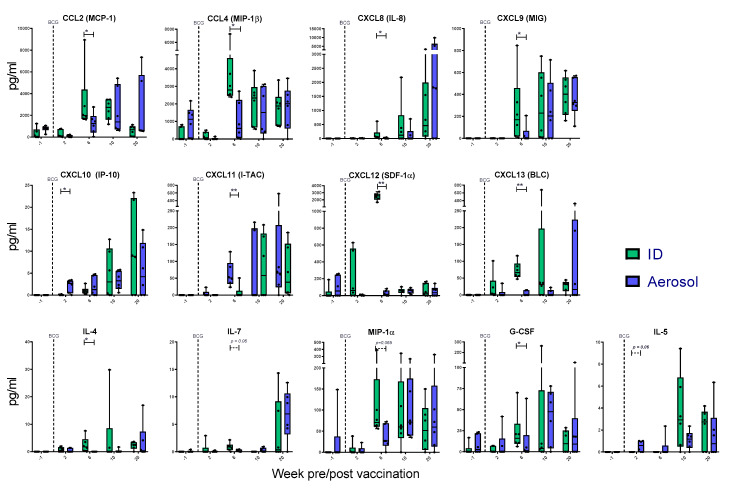
Figure 9.
PPD-specific secretion of cytokine and chemokine biomarkers measured in whole blood culture supernatant. Box plots display the group median titre of each cytokine or chemokine +/- interquartile range measured prior to (-1) and at weeks 2, 4, 10 and 20 following vaccination. Dots represent titres measured in individual animals with the group minimum and maximum values shown by whiskers. Significant differences measured by Mann–Whitney U-test between the groups are indicated, * p ≤ 0.05; ** p ≤ 0.01.

