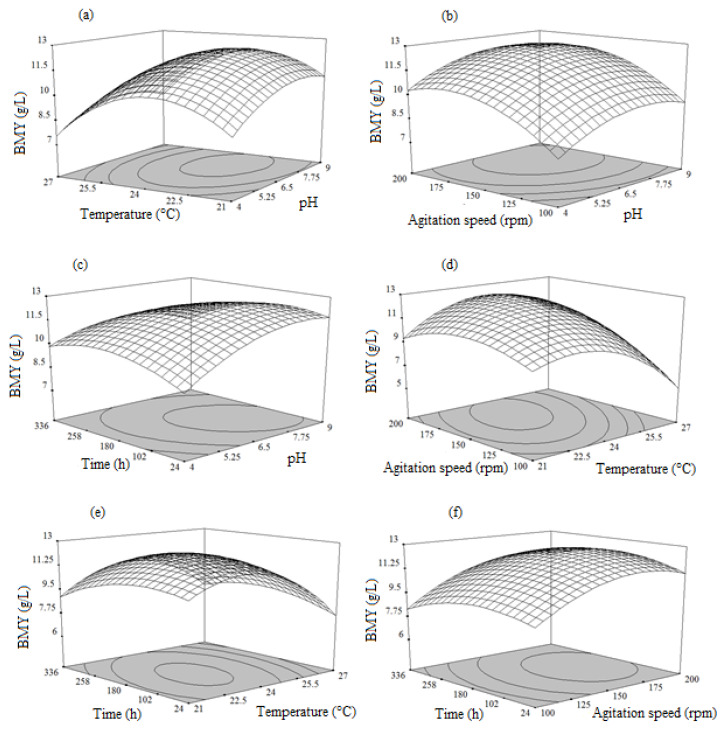
Figure 3.
Response surface plots showing the influence of the process variables on dry biomass yield: (a) Interaction between temperature and pH; (b) Interaction between agitation speed and pH; (c) Interaction between time and pH; (d) Interaction between agitation speed and temperature; (e) Interaction between time and temperature; (f) Interaction between time and agitation speed.

