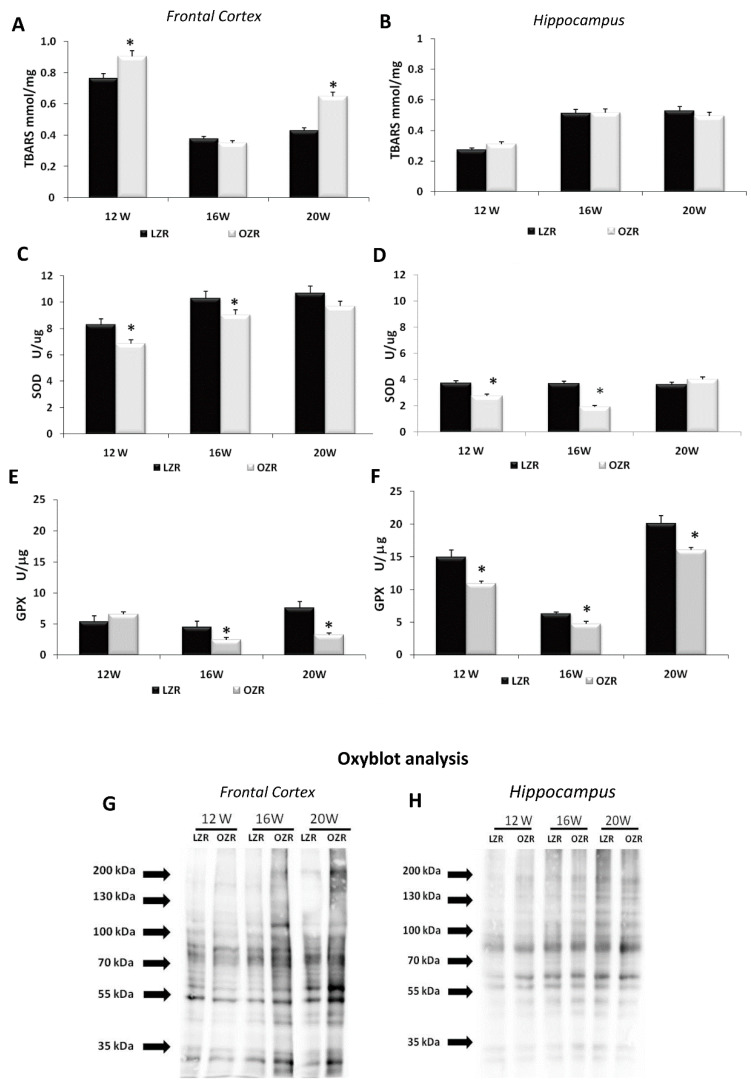
Figure 2.
Oxidative stress parameters in the frontal cortex (A,C,E,G) and hippocampus (B,D,F,H) for LZRs and OZRs of 12-, 16-, and 20-weeks age. The data of thiobarbituric acid reactive substances TBARS level (expressed in mmol/mg of tissue) (A,B), superoxide dismutase activity SOD (expressed as U/μg of proteins where one unit is the amount of enzyme needed to exhibit 50% dismutation of the superoxide radical) (C,D), and glutathione peroxidase activity GPX (expressed U/μg where one unit define as the amount of enzyme that will cause the oxidation of 1.0 nmol of NADPH to NADP+ per minute at 25 °C) (E,F). Data are the mean + SEM. * p < 0.05 vs. age-matched LZRs. The two inferior panels represent the results of Oxyblot of proteins extracted from the frontal cortex (G) and hippocampus (H).

