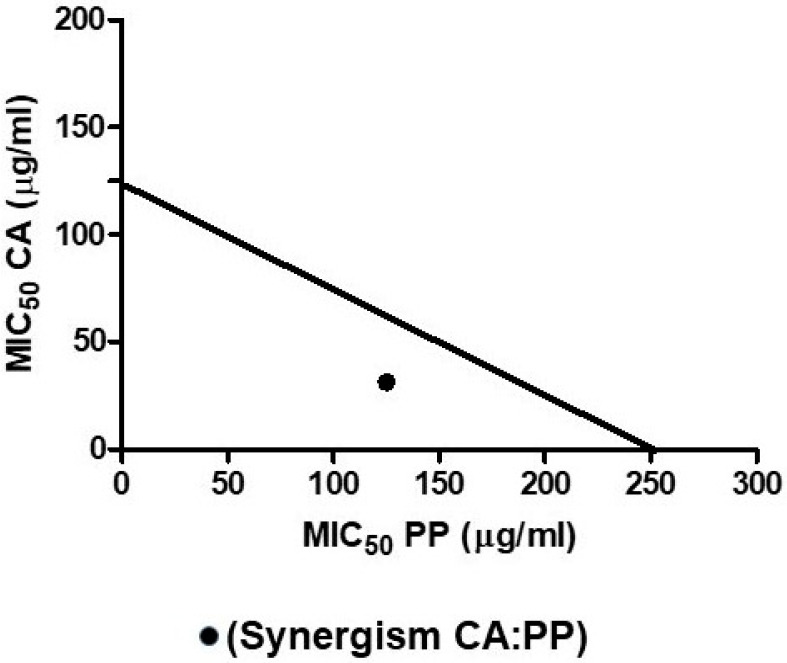
Figure 4.
Isobologram plot showing the synergistic action of CA and PP on the C. albicans SC5314 strain. The individual MIC50 values calculated for CA and PP are represented on the Cartesian axes. The combination of both compounds gives rise to a point that falls inside in the right triangle obtained by drawing the line that joins the MICs of the individual agents.

