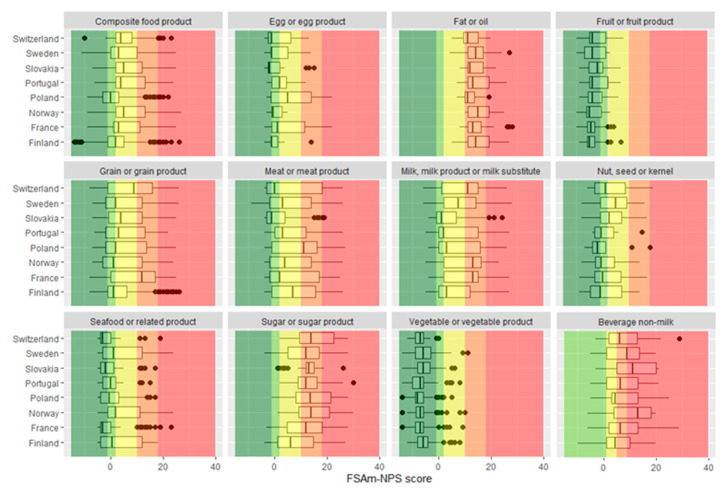
Figure 1.
Overall distribution of products within the main food groups and across countries. Dark green: Nutri-Score “A”, light green: Nutri-Score “B”, yellow: Nutri-Score “C”, light orange: Nutri-Score “D”, and dark orange: Nutri-Score “E”. No Nutri-Score “A” was represented on the graphic of beverages, given that only waters can be classified as “A” and were thus excluded from the graphic. Values are the number of food products (%).

