Abstract
Here we apply state-of-the-art CRISPR technologies to study the impact that PTENP1 pseudogene transcript has on the expression levels of its parental gene PTEN, and hence on the output of AKT signaling in cancer. Our data expand the repertoire of approaches that can be used to dissect competing endogenous RNA (ceRNA)-based interactions, while providing further experimental evidence in support of the very first one that we discovered.
Keywords: PTENP1, PTEN, ceRNA, CRISPR, CasRx-mediated knock-down, Cas9-mediated knock-in
Main text
In our 2010 paper entitled “A coding independent function of gene and pseudogene mRNAs regulates tumor biology”, we provided the first evidence that RNA molecules, including non-coding RNAs (such as pseudogenes) and mRNAs, may be endowed with a biological function that specifically relies on their ability to compete for microRNA binding [1].
Our findings have contributed to an evolving microRNA-RNA interaction paradigm, where RNAs are not only “passive” targets of microRNAs, but also “active” regulators of microRNA availability, through a mechanism termed competing endogenous RNA (ceRNA) [2, 3]. Since our publication, a plethora of mRNAs and non-coding RNAs (lincRNAs, pseudogenes, circular RNAs) have been reported to function as ceRNAs in vitro and in animal models. Furthermore, ceRNA functions have been demonstrated to go beyond individual RNA-RNA interactions and extend into complex transcript interaction networks that can be severely dysregulated in cancer [4, 5].
Subsequent to our 2010 publication, many studies independently confirmed PTENP1 pseudogene as a ceRNA for PTEN in prostate cancer, in other cancer types (e.g., bladder cancer, breast cancer, clear cell renal cell carcinoma, endometrial carcinoma, gastric cancer, head and neck squamous cell carcinoma, hepatocellular carcinoma), and in other physio-pathological conditions (see Supplementary references for a list). Nonetheless, a number of articles published in prestigious journals have repeatedly raised concerns about this functional interaction. Herein, we wish to address those concerns raised regarding the techniques we used to modulate PTENP1 expression and show its impact on PTEN expression.
To rule out potential non-specific effects associated with (1) supra-physiological expression of a 3′UTR [6–9] and (2) congestion of RNA interference machinery caused by siRNA transfection [7], we have chosen to downregulate PTENP1 expression at the transcriptional or post-transcriptional level, taking advantage of CRISPR technology.
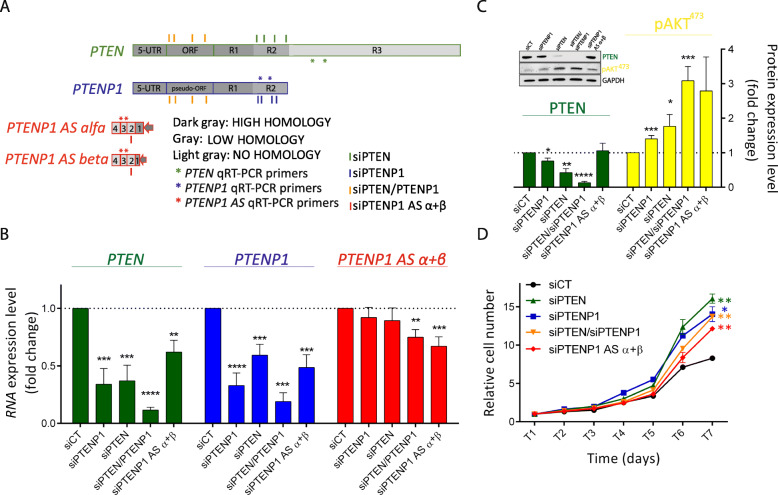
To begin, we successfully replicated results reported in our original paper, in spite of the fact that the source of DU145 cells and the batch of siRNAs against PTEN and PTENP1 were different, and that the experiments were performed in a different lab (Fig. 1).
Fig. 1.
siRNA-mediated knock-down of PTENP1 RNA results in the downregulation of PTEN expression and in an increase in DU145 cell proliferation. a Schematic representation of the location of the siRNAs used to downregulate PTEN (green), PTENP1 (blue), PTEN + PTENP1 (orange), and PTENP1 AS α + β (red) transcripts. The 5′UTR and open reading frame of PTEN and PTENP1 are highly homologous (dark gray). Their 3′UTRs are composed of an R1 high homology region (dark gray), an R2 low homology region (gray), and an R3 region with no homology (light gray). The first exon of PTENP1 AS α and β is transcribed in antisense compared to the 5′UTR of PTENP1. The location of the siRNAs is chosen so that only the intended transcript(s) are selectively knocked down. The location of qRT-PCR primers used to detect PTEN, PTENP1, and PTENP1 AS α + β is indicated with green, blue, and red asterisks, respectively. b qRT-PCR quantification of PTEN, PTENP1, and PTENP1 AS α + β transcripts performed 24 h after the transfection of the indicated siRNAs. c (upper left) Representative western blot detection of PTEN, pAKT, and GAPDH proteins, performed 48 h after the transfection of the indicated siRNAs. (lower) Quantification of protein levels. d Growth curve of DU145 cells transfected with the indicated siRNAs. T1/2/3/4/5/6/7: days after the transfection. The results reported in b–d confirm the data reported in [1]: the knock-down of PTENP1 negatively affects PTEN expression. Conversely, PTEN knock-down negatively affects PTENP1 expression. As a consequence, AKT gets hyper-phosphorylated and cell proliferation increases. The graphs represent the mean ± SEM of three independent experiments. Statistically significant differences are indicated with asterisks: *p < 0.05, **p < 0.01, ***p < 0.001, ****p < 0.0001
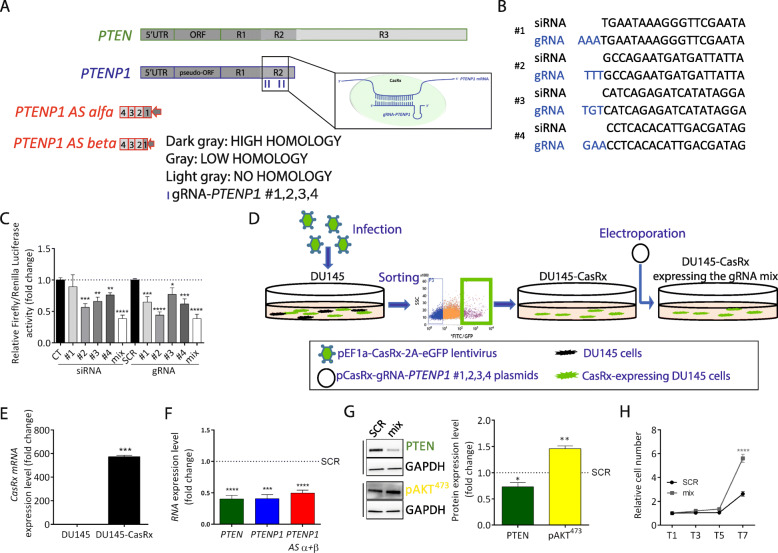
Next, in order to downregulate PTENP1 post-transcriptionally, we used the recently reported CRISPR/CasRx system [10]. For this, we utilized 4 gRNAs designed on the same sequence of the 4 siRNAs composing the siPTENP1 mix (Fig. 2a, b) and we tested them for their ability to decrease the expression of a reporter construct in which PTENP1 3′UTR is cloned downstream of Luciferase coding sequence. As shown in Fig. 2c, the gRNAs work similarly to the corresponding siRNAs, with the mix of all 4 gRNAs working best. Therefore, we decided to use the combination of all 4, as we had done with siRNAs. In Fig. 2d–h, we show the results obtained upon the transient transfection of the gRNA mix in GFP-sorted DU145 prostate cancer cells that stably express CasRx-eGFP (Fig. 2d, e). Consistent with the RNA interference approach (Fig. 1), the gRNA mix caused a downregulation of the intended target PTENP1 RNA, as well as of PTEN mRNA (Fig. 2f). The decrease in mRNA level was mirrored by a decrease in PTEN protein level and accompanied by increases in pAKT levels (Fig. 2g) and cell proliferation (Fig. 2h).
Fig. 2.
CRISPR-mediated knock-down of PTENP1 RNA results in the downregulation of PTEN expression and in an increase in DU145 cell proliferation. a, b Schematic representation of the location of the 4 gRNAs used to knock down PTENP1 expression (a). The sequence of PTENP1 gRNAs (#1 to #4) corresponds to the sequence of the siRNAs described in Fig. 1, extended by 3 nt (blue, b). c Luciferase assay performed in HEK293T cells to compare the efficiency of single siRNAs and gRNAs, as well as their mixes, in downregulating the expression of PTENP1. The assay was performed 36 h after the co-transfection of pGLU/ψ3′UTR plasmid with the indicated siRNAs (siCT; siPTENP1 #1,2,3,4) or gRNA-expressing plasmids (pCasRx-gRNA (SCR); pCasRx-gRNA-PTENP1 #1,2,3,4). In pGLU/ψ3′UTR plasmid, the R1 high homology and the R2 low homology regions of PTENP1 3′UTR are cloned downstream of Luciferase coding sequence [1]. d Cartoon summarizing the experimental protocol used to test the gRNAs in DU145 cells. DU145 cells were stably infected using the lentiviral vector pEF1a-CasRx-2A-eGFP, then sorted for high eGFP expression and, finally, electroporated with pCasRx-gRNA plasmid or the mix of pCasRx-gRNA-PTENP1 #1,2,3,4 plasmids. e qRT-PCR quantification of CasRx mRNA in DU145 cells that were stably infected with pEF1a-CasRx-2A-eGFP and then sorted for high eGFP expression (DU145-CasRx). f qRT-PCR quantification of the indicated transcripts 24 h after the transfection of pCasRx-gRNA (SCR) or pCasRx-gRNA-PTENP1 #1,2,3,4 mix in DU145-CasRx cells. g (left) Representative western blot detection of PTEN/GAPDH and pAKT/GAPDH proteins, performed 48 h after the transfection of pCasRx-gRNA (SCR) or pCasRx-gRNA-PTENP1 #1,2,3,4 mix in DU145-CasRx cells. (right) Quantification of protein levels. h Growth curves of DU145-CasRx cells transfected with pCasRx-gRNA (SCR) or pCasRx-gRNA-PTENP1 #1,2,3,4 mix. T1/3/5/7: days after the transfection. The results reported in f–h confirm the data obtained using siRNAs: the knock-down of PTENP1 negatively affects PTEN expression. As a consequence, AKT gets hyper-phosphorylated and cell proliferation increases. The graphs represent the mean ± SEM of three independent experiments. Statistically significant differences are indicated with asterisks: *p < 0.05, **p < 0.01, ***p < 0.001, ****p < 0.0001
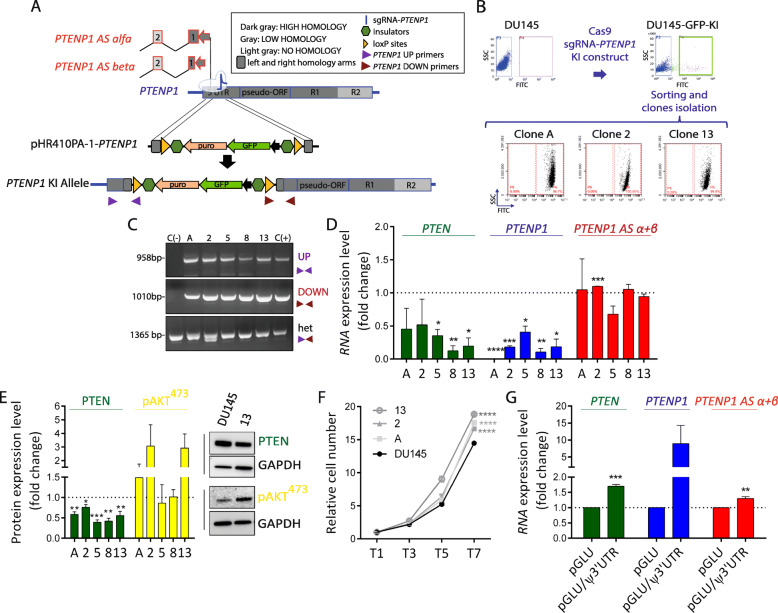
We also adapted the CRISPR/Cas9-based gene replacement strategy [11] in order to achieve the downregulation of PTENP1 at the transcriptional level. Specifically, we engineered an sgRNA-mediated cut between the promoter and the transcribed region of PTENP1 gene. Then, by exploiting homology-mediated recombination, we “knocked-in” a GFP expression cassette in the reverse orientation, which interferes with PTENP1 transcription (Fig. 3a). Using this strategy, we identified 11 GFP-positive KI clones (Fig. 3b), of which 7 harbored correct recombination of both homology arms and 5 showed the expected drop in PTENP1 mRNA levels (clones #A, 2, 5, 8, and 13 reported in Fig. 3c, d). In these clones, we also observed a decrease in both PTEN mRNA and protein levels (Fig. 3d, e). In addition, clones #A, 2, and 13 had accompanying increases in pAKT levels (Fig. 3e) and cell proliferation (Fig. 3f). Crucially, in Fig. 3g, we show that endogenous PTEN mRNA levels are rescued in clone #13, if PTENP1 3′UTR is reintroduced by means of a plasmid that expresses it downstream of Luciferase coding sequence.
Fig. 3.
CRISPR-mediated knock-in of a GFP expression cassette in PTENP1 gene results in the downregulation of PTEN expression and in an increase in DU145 cell proliferation. a Schematic representation of the CRISPR/Cas9-mediated cleavage of PTENP1 gene region, followed by the homology recombination-mediated knock-in of a GFP expression cassette. Being oriented in the opposite direction, the cassette interferes with the transcription of PTENP1 itself. The double-strand cut of genomic DNA produced by Cas9/sgRNA-PTENP1 (blue) is located within the 5′UTR region of PTENP1, upstream of the promoter of PTENP1 AS α and β. Therefore, the transcriptional unit of the antisense transcripts is preserved. Besides the arms required for homology recombination and the GFP expression cassette, the knock-in construct contains 2 insulators and 2 loxP sites. b Cartoon summarizing the experimental protocol used. DU145 that constitutively express Cas9 and sgRNA-PTENP1 were electroporated with pHR410PA-1-PTENP1 plasmid that contains the knock-in construct. Then, Cas9-mediated cleavage of PTENP1 genomic DNA was induced by adding doxycycline. After waiting 10–14 days in order to allow the dilution of non-integrated plasmid, cells that stably express GFP were sorted and seeded at 1-cell/96-well density to obtain individual knock-in clones. c PCR-based screening of the clones that are correctly knocked in. The junction regions located upstream and downstream of the knock-in construct were amplified using the primers shown in panel a as purple and dark red arrows, respectively. The purple forward and the dark red reverse primers (they give a PCR band only on wt alleles, not on knocked-in alleles) were also used to test whether the integration of the construct occurred on all chromosome 9 copies or not (het). The genomic DNA extracted from parental DU145 cells was used as negative control (C−). The genomic DNA extracted from DU145-GFP-KI cells right before 1-cell/96-well seeding was used as positive control (C+). Clones #A, 2, 5, 8, and 13 all show the correct integration of the construct, although non-knocked-in copies of chromosome 9 remain. d qRT-PCR quantification of the indicated transcripts in DU145 cells (taken as control) and clones #A, 2, 5, 8, and 13. e (left) Quantification of PTEN/GAPDH and pAKT/GAPDH protein levels in DU145 cells (taken as control) and in clones #A, 2, 5, 8, and 13. (right) Representative western blot detection of PTEN, pAKT and GAPDH proteins in DU145 cells and in clone #13. f Growth curves of DU145 cells and clones #A, 2, and 13. T1/3/5/7: days after seeding. g qRT-PCR quantification of the indicated transcripts 24 h after the electroporation of 1.5 μg of pGLU empty plasmid or of pGLU/ψ3′UTR plasmid in clone #13. The results reported in d–g confirm what obtained by RNA interference and CRISPR/CasRx: the knock-down of PTENP1 negatively affects PTEN expression. As a consequence, AKT gets hyper-phosphorylated and cell proliferation increases. The graphs represent the mean ± SEM of three independent experiments. Statistically significant differences are indicated with asterisks: *p < 0.05, **p < 0.01, ***p < 0.001, ****p < 0.0001
In summary, using 2 CRISPR-based technologies (Figs. 2 and 3), we confirmed our results achieved using RNA interference (ref. [1] and Fig. 1): knock-down of PTENP1 leads to the repression of PTEN expression, hence the hyperactivation of oncogenic AKT signaling. In addition, we confirmed that siRNA-mediated knock-down of PTENP1 antisense alpha + beta transcripts results in a downregulation of PTENP1 and PTEN transcripts (Fig. 1b), as previously reported in [12]. Conversely, we showed that the knock-down of PTEN plus PTENP1 transcripts by RNA interference (Fig. 1b) and of PTENP1 by CRISPR/CasRx technology (Fig. 2f) represses the expression of PTENP1 antisense transcripts, whereas the upregulation of PTENP1 transcript elicits the opposite effect (Fig. 3g). In sum, we provide evidence that uncovers a dynamic cross-talk between PTENP1 and PTEN sense transcripts on one side and antisense PTENP1 transcripts on the other.
In the decade since our discovery, numerous groups have independently validated the regulatory interaction between PTENP1 and PTEN. Altogether, these data provide a persuasive body of work to support the existence of a robust and reproducible functional interaction between this gene-pseudogene pair [13]. Finally, the new data presented herein further reinforces the PTENP1-PTEN paradigm and highlights the utility of CRISPR technologies for investigations of pseudogene-parental gene transcript relationships in cancer and other diseases.
Supplementary information
Additional file 1. Supplementary references.
Additional file 2. Supplementary methods.
Additional file 3. Supplementary Figure 1. a sgRNA-PTENP1 sequence. b (left) PTENP1 genomic sequence recognized by sgRNA-PTENP1 (bold), and PAM sequence (5'-TGG-3', underlined). (right) Orthologous PTEN genomic sequence. sgRNA-PTENP1 cannot mediate the cleavage of PTEN because of 4 mismatches (red), one of which falls in the PAM sequence. c Electropherogram of PTENP1 genomic sequence, where the consequences of the cut by Cas9/sgRNA-PTENP1 are shown. The electropherogram was obtained by PCR analysis of the genomic DNA extracted from DU145-Cas9/sgRNA-PTENP1 double infected cells, 3 days after Cas9 induction using 2ug/ml doxycycline. The primers used for amplification were: Fw- attcgtcttctccccattcc; Rv-tctgcaggaaatcccatagc.
Acknowledgements
The authors thank C. Baldanzi, A. Prantera, and L. Maresca for technical support.
Abbreviations
- ceRNA
competing endogenous RNA
- CRISPR
Clustered regularly interspaced short palindromic repeats
Authors’ contributions
MV, PPP, and LP conceived the project. MV, YZ, and LP designed the experiments. MV and ME performed the experiments. MV, LS, PPP, and LP analyzed the data. PPP and LP supervised the research. LP wrote the manuscript with the help of all authors. The manuscript was discussed and approved by all authors.
Funding
This work was supported by ISPRO-Istituto per lo Studio, la Prevenzione e la Rete Oncologica [institutional funding to LP]. It was also partially supported by AIRC-Associazione Italiana Ricerca sul Cancro [MFAG #17095 to LP] and by R35CA197529-01 grant to PPP. MV was supported by an AIRC fellowship.
Availability of data and materials
Not applicable
Ethics approval and consent to participate
Not applicable
Consent for publication
Not applicable
Competing interests
None to declare
Footnotes
Publisher’s Note
Springer Nature remains neutral with regard to jurisdictional claims in published maps and institutional affiliations.
Contributor Information
Pier Paolo Pandolfi, Email: pierpaolo.pandolfiderinaldis@unito.it.
Laura Poliseno, Email: laura.poliseno@cnr.it, Email: laura.poliseno@gmail.com.
Supplementary information
Supplementary information accompanies this paper at 10.1186/s13045-020-00894-2.
References
- 1.Poliseno L, Salmena L, Zhang J, Carver B, Haveman WJ, Pandolfi PP. A coding-independent function of gene and pseudogene mRNAs regulates tumour biology. Nature. 2010;465:1033–1038. doi: 10.1038/nature09144. [DOI] [PMC free article] [PubMed] [Google Scholar]
- 2.Salmena L, Poliseno L, Tay Y, Kats L, Pandolfi PP. A ceRNA hypothesis: the Rosetta Stone of a hidden RNA language? Cell. 2011;146:353–358. doi: 10.1016/j.cell.2011.07.014. [DOI] [PMC free article] [PubMed] [Google Scholar]
- 3.Tay Y, Rinn J, Pandolfi PP. The multilayered complexity of ceRNA crosstalk and competition. Nature. 2014;505:344–352. doi: 10.1038/nature12986. [DOI] [PMC free article] [PubMed] [Google Scholar]
- 4.Chan JJ, Tay Y. Noncoding RNA:RNA Regulatory networks in cancer. Int J Mol Sci. 2018;19. [DOI] [PMC free article] [PubMed]
- 5.Anastasiadou E, Jacob LS, Slack FJ. Non-coding RNA networks in cancer. Nat Rev Cancer. 2018;18:5–18. doi: 10.1038/nrc.2017.99. [DOI] [PMC free article] [PubMed] [Google Scholar]
- 6.Ebert MS, Sharp PA. Roles for microRNAs in conferring robustness to biological processes. Cell. 2012;149:515–524. doi: 10.1016/j.cell.2012.04.005. [DOI] [PMC free article] [PubMed] [Google Scholar]
- 7.Jens M, Rajewsky N. Competition between target sites of regulators shapes post-transcriptional gene regulation. Nat Rev Genet. 2015;16:113–126. doi: 10.1038/nrg3853. [DOI] [PubMed] [Google Scholar]
- 8.Denzler R, Agarwal V, Stefano J, Bartel DP, Stoffel M. Assessing the ceRNA hypothesis with quantitative measurements of miRNA and target abundance. Mol Cell. 2014;54:766–776. doi: 10.1016/j.molcel.2014.03.045. [DOI] [PMC free article] [PubMed] [Google Scholar]
- 9.Broderick JA, Zamore PD. Competitive endogenous RNAs cannot alter microRNA function in vivo. Mol Cell. 2014;54:711–713. doi: 10.1016/j.molcel.2014.05.023. [DOI] [PubMed] [Google Scholar]
- 10.Konermann S, Lotfy P, Brideau NJ, Oki J, Shokhirev MN, Hsu PD. Transcriptome engineering with RNA-targeting type VI-D CRISPR effectors. Cell. 2018;173:665–676. doi: 10.1016/j.cell.2018.02.033. [DOI] [PMC free article] [PubMed] [Google Scholar]
- 11.Zheng Q, Cai X, Tan MH, Schaffert S, Arnold CP, Gong X, Chen CZ, Huang S. Precise gene deletion and replacement using the CRISPR/Cas9 system in human cells. Biotechniques. 2014;57:115–124. doi: 10.2144/000114196. [DOI] [PubMed] [Google Scholar]
- 12.Johnsson P, Ackley A, Vidarsdottir L, Lui WO, Corcoran M, Grander D, Morris KV. A pseudogene long-noncoding-RNA network regulates PTEN transcription and translation in human cells. Nat Struct Mol Biol. 2013;20:440–446. doi: 10.1038/nsmb.2516. [DOI] [PMC free article] [PubMed] [Google Scholar]
- 13.Kerwin J, Khan I. Reproducibility Project: Cancer B, Iorns E, Tsui R, Denis A, Perfito N, Errington TM: Replication study: a coding-independent function of gene and pseudogene mRNAs regulates tumour biology. Elife. 2020;9. [DOI] [PMC free article] [PubMed]
Associated Data
This section collects any data citations, data availability statements, or supplementary materials included in this article.
Supplementary Materials
Additional file 1. Supplementary references.
Additional file 2. Supplementary methods.
Additional file 3. Supplementary Figure 1. a sgRNA-PTENP1 sequence. b (left) PTENP1 genomic sequence recognized by sgRNA-PTENP1 (bold), and PAM sequence (5'-TGG-3', underlined). (right) Orthologous PTEN genomic sequence. sgRNA-PTENP1 cannot mediate the cleavage of PTEN because of 4 mismatches (red), one of which falls in the PAM sequence. c Electropherogram of PTENP1 genomic sequence, where the consequences of the cut by Cas9/sgRNA-PTENP1 are shown. The electropherogram was obtained by PCR analysis of the genomic DNA extracted from DU145-Cas9/sgRNA-PTENP1 double infected cells, 3 days after Cas9 induction using 2ug/ml doxycycline. The primers used for amplification were: Fw- attcgtcttctccccattcc; Rv-tctgcaggaaatcccatagc.
Data Availability Statement
Not applicable


