

Abstract
The development of amorphous phosphate-based materials is of major interest in the field of biomaterials science, and especially for bone substitution applications. In this context, we herein report the synthesis of gel-derived hydrated amorphous calcium/sodium ortho/pyrophosphate materials at ambient temperature and in water. For the first time, such materials have been obtained in a large range of tunable orthophosphate/pyrophosphate molar ratios. Multi-scale characterization was carried out thanks to various techniques, including advanced multinuclear solid state NMR. It allowed the quantification of each ionic/molecular species leading to a general formula for these materials: [(Ca2+y Na+z H+3+x-2y-z)(PO43−)1−x(P2O74−)x](H2O)u. Beyond this formula, the analyses suggest that these amorphous solids are formed by the aggregation of colloids and that surface water and sodium could play a role in the cohesion of the whole material. Although the full comprehension of mechanisms of formation and structure is still to be investigated in detail, the straightforward synthesis of these new amorphous materials opens up many perspectives in the field of materials for bone substitution and regeneration.
Keywords: Amorphous materials, mixed calcium ortho/pyrophosphate, soft chemistry, biomaterials
Introduction
Among inorganic materials for bone substitution, amorphous solids have attracted a lot of attention. Indeed, their metastability often improves their (bio)chemical reactivity. The subsequent release of active ions [1], and/or dissolution/precipitation reactions lead to neoformed apatite, that positively impacts osteoconduction and osteoinduction [2]. The most famous example of amorphous biomaterials is probably that of the bioactive silicate-based glasses (either sol-gel or melt-derived), which have been extensively studied [2,3]. The present paper, however, focuses on new types of phosphate-based amorphous materials for bone regeneration. Two main families of materials belonging to this category are studied by different scientific communities and are referenced in the literature as phosphate-based glasses and amorphous calcium phosphates.
On the one hand, phosphate-based glasses are generally made by fusion. Considering pure binary P2O5-CaO glasses [4], the nature of the phosphate units (as expressed by the Qn terminology, where n is the number of bridging oxygen atoms per PO4 tetrahedron) can be controlled through the atomic Ca/P ratio. This ratio can vary from ultraphosphates (phosphate 3D network mainly based on Q3 species) to metaphosphate glasses (linear phosphate chains, mainly Q2) and eventually to invert glasses (isolated pyrophosphates and orthophosphates, Q1 and Q0 respectively). This range of composition and the use of additives allow the elaboration of such glasses and the control of their dissolution [5–9].
On the other hand, amorphous calcium phosphate powders can be synthesized by precipitation in solution at room temperature, most of the time in water and without further high temperature treatment [10]. These are generally obtained by double decomposition between soluble calcium and phosphate salt precursors, and some processes lead to dense liquid “coacervates” [11]. Several kinds of phosphate precursors have been used: long-chain polyphosphates (polyP) [12,13], cyclic polyphosphates [14], diphosphates (also called pyrophosphates: P2O74-)[15–17] or orthophosphates (PO43-) [10]. Without any high temperature treatment, the polyP associations are preserved in the final materials, which remain amorphous. In contrast, crystallization can occur when only orthophosphates or pyrophosphates (smaller anions) are present. In this case, the amorphous/crystalline nature depends on the synthetic parameters used (pH, concentration…) [16–18].
In this context, we recently reported the synthesis of different compositions of monolithic calcium and potassium pyrophosphate materials (PYG materials, PYrophosphate Glasses) prepared using soft conditions (in aqueous solution with a drying step at 70°C) [17]. We showed that an increase of the Ca2+/P2O74- ratio in the precursor batch solution resulted in an increase of the proportion of crystalline calcium pyrophosphate phase in the final material. This behavior was suggested to be induced by small amounts of orthophosphate ions formed by partial hydrolysis of the initial pyrophosphate entities during the synthesis process, which inhibited calcium pyrophosphate crystallization.
Considering this result, the aim of this paper is to present an original strategy for the low-temperature synthesis of gel-derived amorphous calcium phosphate materials (NaPYG) containing both pyrophosphate and orthophosphate entities in controlled amounts, and calcium and sodium as metal cations. To the best of our knowledge, this approach has never been described previously. Moreover, sodium phosphate salts were chosen here (in preference to the potassium ones), because sodium exhibits no side effects in vivo like hyperkalemia [19] (contrary to potassium).
Beyond the novelty of this synthesis, these mixed ortho/pyrophosphate materials appeared to us as potentially attractive candidates for bone substitution applications. Indeed, the interest of pure calcium pyrophosphate biomaterials has been demonstrated in the literature, through acellular and cellular in vitro tests [20,21], in vivo animal studies [22], and a clinical trial [23]. Pyrophosphates have been shown to hydrolyze in vivo by enzymatic reactions [20] and/or acidic pH [24] (due to inflammatory response after implantation), leading to orthophosphate ions, which are one of the key “building ions” of bone mineral. Pyrophosphate is one of the mineral ions considered to inhibit mineral formation. In osteoblast cultures especially, pyrophosphate inhibition occurs by binding to the mineral, up-regulating osteopontin, and inhibiting alkaline phosphatase activity [25.]. It has been observed, however, that, in vivo, the pyrophosphate level is rather well controlled and that its variations, due to physical activity for example, are regulated [26]. More generally, in humans, the total production of pyrophosphate ions per day is evaluated, from 0.7 to several kg [26] and more that 170 biological reactions involving pyrophosphate ions have been identified [26].
Therefore, the control of the ortho/pyrophosphate ratio within an amorphous material (synthesized at a temperature of only 70°C and without any additives) could potentially be an interesting adjustable parameter for tuning the kinetics of biomaterial degradation and bone mineral formation.
In this work, we thus investigate in detail the effect of the ortho/pyrophosphate content on the nature, structure and morphology of newly-synthesized amorphous biomaterials, using complementary characterization techniques and in particular advanced multinuclear solid state NMR. Advanced solid state NMR are of paramount importance in the studies of amorphous derivatives such as bioglasses for which XRD data are much less informative. The smart use of the NMR interactions (indirect J couplings and spatial dipolar couplings, D) allows to safely establish through-bond and through-space connectivities. In this work, 31P INADEQUATE MAS experiments were explored to disentangle the contributions of ortho- and pyrophosphates groups in 1D 31P MAS experiments (especially for amorphous materials). Most importantly, homo- (31P-31P) and heteronuclear (23Na-31P) 2D correlation experiments were implemented to highlight the presence/absence of segregated domains (both from the anionic, ie ortho- and pyrophosphates, and cationic, ie Na+ and Ca2+, points of view).
Experimental section
Precursors
Calcium chloride dihydrate (CaCl2.2H2O, Merck) and tri-sodium phosphate dodecahydrate (Na3PO4.12H2O, GRP rectapur, VWR Chemicals) were used as received, as calcium and orthophosphate sources, respectively. The pyrophosphate precursor, anhydrous tetrasodium pyrophosphate (Na4P2O7), was prepared by heating disodium hydrogen phosphate powder (Na2HPO4, VWR Chemicals) at 400°C during 15 hours in a muffle furnace. The formation of this salt was verified by XRD, Raman and 31P solid state NMR spectroscopies before its use (in particular, no residual orthophosphate entity was detected by NMR).
Synthesis
Calcium and phosphate reagent solutions were prepared separately by dissolving CaCl2·2H2O in 40 mL of deionized water (solution A), and orthophosphate (Na3PO4·12H2O) and pyrophosphate (Na4P2O7) precursors in 400 mL of deionized water (Solution B). Solution B was prepared with different molar ratios of orthophosphate and pyrophosphate ions (PO43−/(P2O74− + PO43−)), in order to study the influence of this parameter on the nature and composition of the final material. Samples are labelled NaPYG-0X0, from the lowest (X = 0) to the highest (X = 6) ortho/pyrophosphate ratio (Table 1). Solution A was then added to solution B using a peristaltic pump at a constant volumetric flowrate (32 mL.min−1) for all samples. The mixture turned transparent to translucent. After complete addition, the solution was stirred for 5 more minutes (aliquots of the solution were collected during this step in order to measure the pH), and the final colloidal solution was centrifuged 5 minutes at 7500 rpm. The resulting dense gel at the bottom of the centrifuge tube was washed three times with deionized water. Finally, the washed gel was poured into a glass crystallizing dish and dried at 70°C during 7 days. Samples were then stored at −20°C before their characterization (carried out at ambient temperature).
Table 1:
Number of moles of calcium and phosphate salt precursors involved in the initial solutions (A and B) and A and B solution volumes. Molar ratio, percentage, and pH after mixing the two solutions are also reported.
| NaPYG 000 | NaPYG 010 | NaPYG 020 | NaPYG 030 | NaPYG 040 | NaPYG 050 | NaPYG 060 | |
|---|---|---|---|---|---|---|---|
| CaCl2·2H2O (mmol) | 7.210 ± 0.020 | ||||||
| Na4P2O7 (mmol) | 33.30 ± 0.008 | 28.300 ± 0.008 | 23.310 ± 0.008 | 16.650 ± 0.008 | 9.990 ± 0.008 | 4.990 ± 0.008 | 0 |
| Na3PO4·12H2O (mmol) | 0 | 4.990 ± 0.006 | 9.99 ± 0.005 | 16.65 ± 0.006 | 23.31 ± 0.006 | 28.30 ± 0.006 | 33.330 ± 0.006 |
| Calcium solution (A) volume (mL) | 40.0 ± 0.1 | ||||||
| Phosphate solution (B) volume (mL) | 400.0 ± 0.1 | ||||||
| Ca/P (molar ratio) | 0.109 ± 0.003 | 0.119 ± 0.004 | 0.128 ± 0.003 | 0.145 ± 0.003 | 0.166 ± 0.003 | 0.190 ± 0.004 | 0.220 ± 0.003 |
| Orthophosphate initial molar %: PO43−/(P2O74− + PO43−) | 0 | 15.00 ± 0.25 | 30.00 ± 0.14 | 50.00 ± 0.11 | 70.00 ± 0.12 | 85.00 ± 0.20 | 100 |
| pH after mixing A and B solutions | 10.1 ± 0.1 | 11.5 ± 0.1 | 11.8 ± 0.1 | 11.9 ± 0.1 | 12.0 ± 0.1 | 12.1 ± 0.1 | 12.1 ± 0.1 |
α-canaphite (Na2CaP2O7.4H2O) and nanocrystalline apatite were prepared for use as reference compounds for Raman spectroscopy, XRD, and solid state NMR characterizations, because they were occasionally identified in some of the final materials. The nanocrystalline apatite reference sample was synthesized according to a previously published protocol [27]. The canaphite reference sample was prepared by adapting the protocol reported by Cheng et al [28] (SI-1). These two reference samples were characterized by solid state NMR and Raman spectroscopy and XRD, and were demonstrated to be pure compounds.
Characterization
The synthesized materials were characterized using complementary structural, microstructural, elemental, spectroscopic and thermal characterization methods.
Powder X-ray diffraction analysis was performed using a diffractometer (Bruker D8 advanced) with a copper anticathode (λ(Kα1) = 1.54056 Å, λ(Kα2) = 1.54433 Å), stepsize of 0.03° between 10° and 70°. Samples were crushed without sieving in a mortar before measurements.
Magic-angle spinning (MAS) solid state NMR experiments were performed to analyze 31P, 23Na, 1H and 43Ca local environments in the materials. 1H single pulse, 23Na single pulse, 31P single pulse, 1H→31P CP (Cross-Polarization) and 31P CP INADEQUATE [29] (Incredible Natural Abundance DoublE QUAntum Transfer Experiment) spectra were recorded on a VNMRS-600 MHz (14.1 T) instrument equipped with a Varian T3 3.2 mm triple resonance probe using 14 to 20 kHz spinning speeds. 1H single pulse and 1H Hahn echo spectra were acquired at 14.1 T using a Varian 1.2 mm triple resonance probe spinning at 40 kHz. 1H{31P}HETCOR (HETeronuclear CORrelation) spectra and additional 1H Hahn-echo experiments were also recorded at 14.1 T using a 1.6 mm triple resonance probe, with 22 to 30 kHz spinning speeds. 31P CP SQ-DQ (Single Quantum-Double Quantum) experiments with SPC5 recoupling were performed on a 700 MHz (16.4 T) Bruker AVANCE III spectrometer, equipped with a 4 mm double resonance MAS probe spinning at 14 kHz [30]. The 23Na{31P}D-HMQC (Heteronuclear Multiple-Quantum Correlation) [31] spectra were acquired on a 800 MHz Bruker Advance NEO 4 spectrometer (18.8 T) equipped with a 3.2 mm HXY MAS probe using 20 kHz spinning speed. 43Ca multi-DFS (Double Frequency Sweep) NMR [32] spectra were acquired on a 850 MHz Bruker NEO 4 spectrometer (20.0 T), a 800 MHz Bruker advance NEO spectrometer (18.8 T), or the 35.2 T SCH magnet in Tallahassee (FL-USA, using a Bruker AVANCE NEO console), respectively equipped with a 7 mm X low gamma probe, a 4 mm HX Tallahassee probe and a 3.2 mm MAS Tallahassee probe using 5 to 10 kHz spinning speed [33,34]. The complete set of acquisition parameters can be found in supporting information (SI-2), including information on temperature regulation and the referencing of spectra, and a table with all acquisition parameters (Table S1).
Raman scattering analyses were performed using a Raman Labram HR 800 confocal microscope Horiba Yvon Jobin. The sample was exposed to continuous laser radiation provided by a 532 nm Argon diode laser with a power of 14 mW. The analyses were carried out under a BX 41 Olympus microscope equipped with a x100 lens with a numerical aperture of 0.9, which confers to the system a lateral resolution of 1.0 μm and an axial resolution of 4.5 μm. The spectrum of each microdomain was acquired through a grating of 600 lines per mm with a spectral resolution of 1.5 cm−1 and collected with a quantum well detector cooled at −60 °C by double Peltier effect (CCD Synapse). A certified silicon standard was used to calibrate the frequency of the equipment using the first order silicon line at 520.7 cm−1. Each spectrum was acquired with an integration time of 30 seconds and 5 accumulations. The methodology for Raman lines decomposition to evaluate the ortho/pyrophosphate ratio in the synthesized materials is described in the Supporting Information (SI-3, Table S2).
Scanning Electron Microscopy (SEM) analyses were performed on a LEO 435 VP microscope with an accelerating voltage in the 8–12 kV range. Except for NaPYG-000, all samples were crushed in a mortar until getting submillimetric grains (without sieving ) that were stuck on adhesive carbon discs and finally silver sputter-coated before observation.
Thermogravimetric Analyses (TGA) and Differential Thermal Analysis (DTA) were performed using a Setaram instrument (Setsys Evolution System) from 25 to 600°C with a stage of 20 min at 600°C, and a heating rate of 4°C per minute in air flow.
Inductively Coupled Plasma-Optical Emission Spectrometry ICP-OES (Ultima Expert machine) was used to analyze solutions of dissolved powders in order to determine the Ca, P and Na contents in in the materials (λCa = 318.12 nm, λP = 177.43 nm, λNa = 589.59 nm).
Ultra High Pressure Phase Liquid Chromatography (UHPLC) coupled with an Evaporative Light Scattering Detector (ELSD) was used for the detection of chloride ions (using a Waters Acquity apparatus). The analyzed solutions were the same as for ICP-OES spectrometry analysis. Standard calibration solutions were used (with [Cl−] from 0 to 1.5 ppm).
Statistics and errors
Uncertainties in Table 1 are due to volume, mass and pH measurement errors and subsequent propagation of uncertainty. Uncertainties in pyrophosphate, orthophosphate (Table 2 and Figure 7) calcium, phosphorus and sodium (Table 3) quantification correspond to the standard deviation (triplicate) determined on values obtained by Raman and NMR spectra deconvolution and ICP measurements. Uncertainty associated to water quantification (Table 3) is the nominal value associated to the TGA apparatus. Those associated to the final composition, charges and the corresponding summations (Figure 5) have been calculated by the propagation of uncertainty with previous results.
Table 2:
Percentage of phosphorus atom involved in orthophosphate and pyrophosphate ions introduced as precursors in the initial solutions and in the final materials measured by 31P solid state NMR and Raman spectroscopy.
| Precursors in the initial solution | 31P solid state NMR of materials | Raman spectroscopy of materials | ||||
|---|---|---|---|---|---|---|
| % Ppyro | % Portho | % Ppyro | % Portho | % Ppyro | % Portho | |
| NaPYG-000 | 100 | 0 | 100 ± 0 | 0 ± 0 | 100 ± 0 | 0 ± 0 |
| NaPYG-010 | 92 | 8 | 74 ± 3 | 26 ± 3 | 67 ± 2 | 33 ± 2 |
| NaPYG-020 | 82 | 18 | 58 ± 3 | 42 ± 3 | 52 ± 1 | 48 ± 1 |
| NaPYG-030 | 67 | 33 | 50 ± 4 | 50 ± 4 | 47 ± 1 | 53 ± 1 |
| NaPYG-040 | 46 | 54 | 37 ± 3 | 63 ± 3 | 37 ± 2 | 63 ± 2 |
| NaPYG-050 | 26 | 74 | 26 ± 6 | 74 ± 6 | 31 ± 4 | 69 ± 4 |
| NaPYG-060 | 0 | 100 | 0 ± 0 | 100 ± 0 | 0 ± 0 | 100 ± 0 |
Figure 7.
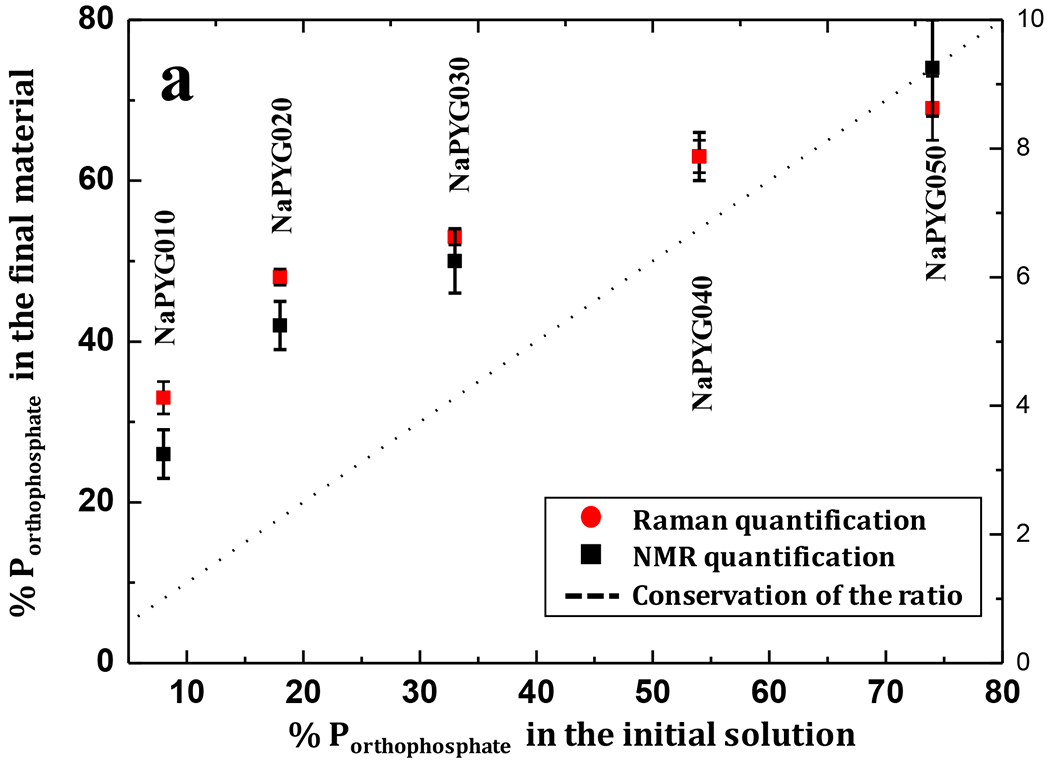
Molar percentage of phosphorus atoms involved in orthophosphate ions (compared to pyrophosphate) in materials (as determined by solid state NMR and Raman spectroscopy) as a function of the molar percentage of orthophosphate ions in the initial precursor solution.
Table 3:
Chemical composition (Ca, P and Na) of the synthesized NaPYG materials determined by ICP-OES (moles/100 g of dissolved material) and total weight percent of water determined by TGA.
| Samples | Ca (mol/100 g) | P (mol/100 g) | Na (mol/100 g) | H2O w% |
|---|---|---|---|---|
| NaPYG-000 | 0.320 ± 0.003 | 0.591 ± 0.004 | 0.583 ± 0.003 | 20.1 ± 0.5 |
| NaPYG-010 | 0.620 ± 0.003 | 0.599 ± 0.004 | 0.100 ± 0.001 | 13.7 ± 0.5 |
| NaPYG-020 | 0.645 ± 0.004 | 0.581 ± 0.004 | 0.100 ± 0.001 | 12.7 ± 0.5 |
| NaPYG-030 | 0.669 ± 0.003 | 0.568 ± 0.005 | 0.060 ± 0.001 | 15.3 ± 0.5 |
| NaPYG-040 | 0.686 ± 0.003 | 0.545 ± 0.002 | 0.030 ± 0.001 | 15.6 ± 0.5 |
| NaPYG-050 | 0.672 ± 0.006 | 0.520 ± 0.002 | 0.030 ± 0.001 | 15.0 ± 0.5 |
| NaPYG-060 | 0.772 ± 0.005 | 0.540 ± 0.005 | 0.020 ± 0.001 | 4.9 ± 0.5 |
Figure 5.

(a) Evolution of weight percentages of Ca2+, Na+, PO43−, P2O74−, H2O, and summation of all these ions and (b) Evolution of charges (number of moles of each ionic entity for 100 g of material normalized by its respective charge) for calcium, sodium, total phosphate and summation for each amorphous NaPYG material (x axis is the percentage of Porthophosphate with respect to the total phosphorus content).
Results
1). Morphology
Seven calcium phosphate materials (NaPYG-000 to NaPYG-060) were prepared in water under mild conditions, using a fixed amount of Ca2+ and different molar ratios of ortho and pyrophosphate entities: PO43−/(P2O74− + PO43−) (Table 1). Although the synthesized materials were obtained as powders for all synthesis conditions, they appeared visually different: a fine powder was observed for NaPYG-000 (prepared from only pyrophosphate precursor solution), whereas grains of several millimeters size with mechanical cohesion were observed for the other compositions (prepared from mixed ortho and pyrophosphate precursor solutions). Scanning Electron Microscopy observations (Figure 1) show that: NaPYG-000 is composed of grains with diameters between 20 and 100 μm. These grains are either spherulites or bundles formed by plate-like crystals of around 2 μm width and 0.5 μm thickness. For the other samples, after grinding, the particles appear to have angular shapes, with smooth and compact fracture surfaces with irregular morphologies. These conchoidal fractures are typical of brittle materials [35]. Figure 1 (j, k, l) shows an increase in the submicronic surface roughness, associated with an increase of the initial ortho/pyrophosphate molar ratio in solution (from NaPYG-010 to NaPYG-060).
Figure 1:

SEM micrographs of synthesized NaPYG materials at different magnifications: NaPYG-000 (a, e, i), NaPYG-010 (b, f, j), NaPYG-030 (c, g, k) and NaPYG-060 (d, h, l).
2). Structural analyses
The nature of the phases involved was determined by X-ray diffraction analysis (Figure 2–a). Samples NaPYG-010 to 050, prepared from solutions containing both pyro- and orthophosphates, were found to be amorphous (very broad halo between 26° and 34°). On the contrary, well-defined crystalline peaks were observed for NaPYG-000. These peaks were identified as those of α-canaphite [36], Na2CaP2O7·4H2O. X-ray diffractogram of NaPYG-060, showed features of a nanocrystalline apatite [18], although the apparent crystallite sizes (length and thickness) should be different than that of the nanocrystalline apatite reference sample (3 days of maturation, non-carbonated). Indeed, L(200) (giving information on the length of apatite nanocrystals) and L(310) (giving information on the thickness of apatite nanocrystals) have been calculated using Scherrer’s law. These values are respectively: L(200)ref = 17.2 ± 0.6 nm, L(310)ref = 8.3 ± 0.6 nm, L(200)NaPYG060 = 29.2 ± 0.6 nm, L(310) NaPYG060= 9.2 ± 0.6 nm.
Figure 2:

(a) XRD patterns and (b) Raman spectra of NaPYG materials prepared with different ortho/pyrophosphate molar ratios: from NaPYG-000 (top) to NaPYG-060 (bottom). Results for the synthesized canaphite and nanocrystalline apatite reference samples are also presented for comparison. (see supporting information).
For NaPYG materials, six main domains in the corresponding Raman spectra (Figure 2–b) could be distinguished for the phosphate/pyrophosphate entities [16]:
One domain between 410 - 650 cm−1 corresponding to vibrational bands of both orthophosphate and pyrophosphate ions (δPO3 and ρPO3 of P2O7 and ν4 PO4).
Four domains assigned to the pyrophosphate entities only, including the bending mode of the POP bridge (δPOP) around 350 cm−1; the symmetric stretching of POP (νsPOP, between 695 and 795 cm−1) and the intense lines of νsPO3, between 1015 and 1070 cm−1 and of νas PO3 between 1080 and 1195 cm−1.
One domain corresponding mainly to the symmetric stretching of orthophosphate entities (νsPO4) between 915 and 990 cm-1.
For NaPYG-000 and NaPYG-060, only the bands associated with pyrophosphate or orthophosphate ions were observed, respectively, as expected. Moreover, these bands, especially νsPO3 (orthophosphate) and νsPO4 (pyrophosphate) were found to be narrower (FWHM000 = 13 cm−1 and FWHM060 = 13 cm−1) than for other compositions. It indicates the predominant presence of well-defined environments belonging to crystalline phases, matching with α-canaphite (FWHMpyro = 10 cm−1) for NaPYG-000 and nanocrystalline apatite (FWHMortho = 12 cm−1) for NaPYG-060. For the other compositions, broad lines typical of amorphous phases (FWHMpyro = 25-29 cm−1 and FWHMortho = 26-29 cm−1) were observed. Considering the νsPO4 band of the orthophosphate ion at 955 cm−1, its intensity was found to increase, as expected, with the increase in the relative proportion of orthophosphate ions in the initial solution (from NaPYG-010 to NaPYG-050). This trend is opposite for the pyrophosphate stretching band (νsPO3 at 1038 cm−1), showing a decrease in the pyrophosphate when the orthophosphate/pyrophosphate ratio in the synthesis solution was increased (Table 2).
31P MAS solid state NMR spectra were recorded in order to analyze more accurately the environments of ortho- and pyrophosphate anions. First, using single-pulse excitation experiments in quantitative mode, the general trends observed in Raman spectroscopy were confirmed (Figure 3–a). Indeed, two regions were observed on the spectra, which correspond predominantly to the different types of phosphate units, based on previous NMR studies [16,17] and on additional 31P CP-INADEQUATE (discrimination of pyrophosphate entities) experiments (see Supporting Information, SI-4, Figure S1): i) between 8 and −1 ppm mainly for orthophosphate species,
Figure 3.

a) 31P single pulse MAS NMR spectra recorded at 14.1 T, using νr = 14 kHz. b) 23Na single pulse MAS NMR spectra recorded at 14.1 T using νr = 20 kHz. c) 1H single pulse MAS NMR spectra recorded at 14.1 T using νr = 40 kHz. d) 43Ca multi-DFS MAS NMR spectra recorded at 18.8 or 20.0 T using νr = 4-6 kHz. Full details on the acquisition conditions are provided in Supporting Information (SI-2).
ii) between −2 and −10 ppm for pyrophosphate species
For NaPYG-000 and NaPYG-060, narrow resonances were observed, which were respectively attributed to the pyrophosphate environment of α-canaphite (−2.5 and −5.8 ppm) and orthophosphate environment of nanocrystalline apatite (2.8 ppm). However, it is worth noting that in the case of NaPYG-000, a broad underlying component due to pyrophosphate environment was also observed, accounting for ~ 23% of the overall phosphorus intensity. This implies that NaPYG-000 also contains an amorphous component (in addition to α-canaphite). For samples NaPYG-010 to NaPYG-050, broad resonances were observed, as expected for amorphous materials. Their relative intensity was found to vary in the same way as the proportion of orthophosphate versus pyrophosphate species in the initial precursor solution, in line with Raman spectroscopic analyses (Table 2). 1H→31P CP-MAS experiments were also carried out on all samples (SI-4, Figure S1), showing that both types of phosphate units are in close proximity to protons, which belong mainly to water molecules (main resonance on the 1H MAS NMR spectra of all compounds, centered at ~5 ppm, Figure 3–c). A similar observation was made in the case of amorphous potassium ortho/pyrophosphate materials [17]. A more complete discussion of the 1H and 31P environments is given later in this manuscript.
The local environments of Na+ and Ca2+ cations were also probed using solid state NMR. Regarding 23Na MAS NMR data, all samples were analyzed at two different magnetic fields, to ensure a sounder interpretation of the data, as 23Na is a spin 3/2 quadrupolar nucleus (Figure 3–b, and supporting information SI-5). NaPYG-000 showed two distinct Na environments with well-defined second-order quadrupolar lineshapes (as expected from the crystal structure of α-canaphite [36], see Figure S4). However, no broad 23Na resonance related to the amorphous 31P was observed, suggesting the presence of an amorphous calcium pyrophosphate. On the other hand, NaPYG-060 showed a narrow and yet slightly distributed Na environment, which corresponds to Na+-substitutions in nanocrystalline apatite [37]. For samples NaPYG-010 to NaPYG-050, a broad asymmetric resonance was observed in all cases, with a tailing towards the lower frequencies. Spectral deconvolutions of these samples were performed considering the presence of two distinct Na environments (see SI-5, Figure S3 and Table S3), as no satisfactory fit could be achieved using a single one. The relative proportion between both components did not appear to vary significantly with the ortho/pyrophosphate ratio, and remained equal to ~20/80 along the series. The narrowest 23Na resonance could correspond to Na+ ions which are in a more symmetric and/or more mobile environment due to a higher amount of water molecules in their vicinity.
Concerning 43Ca MAS NMR, all analyses were performed at ultra-high field (B0 ≥ 18.8 T), as 43Ca is a spin 7/2 quadrupolar nucleus of low resonance frequency and with a natural abundance of only 0.14% (Figure 3–d). All 43Ca NMR spectra showed a broad resonance centered at ~ 0 ppm. Based on the comparison of the data recorded at 20.0 and 35.2 T (see SI-6, Figure S5), and on previous 43Ca NMR studies of amorphous Ca-(pyro)phosphate phases, the breadth of these signals mainly attests of a chemical shift distribution, possibly caused by distributions in Ca-O bond distance variations [34,38,39]. For two samples (NaPYG-010 and NaPYG-050), an additional distinct environment was also visible, with an underlying component at the lower frequencies (Figure 3–d). However, due to the difficulties in recording such spectra at natural abundance, and despite the use of signal-enhancement schemes, no exact quantification of this component was accessible at this stage. Taken together, 23Na and 43Ca NMR analyses underscore the complex nature of the amorphous NaPYG-010 to NaPYG-050 materials, in which not only two different types of anions are present (ortho and pyrophosphates), but also a variety of cation environments.
3). Thermal behavior and chemical compositions
The thermal evolution of the NaPYG samples was studied by TGA-DTA. Figure 4 shows the TGA and DTA curves of NaPYG-000, NaPYG-010, NaPYG-030 and NaPYG-060. Only four samples are presented for the ease of reading, since the curves were very similar for samples NaPYG-020, NaPYG-040 and NaPYG-050 (see SI-7, Figure S6). The weight losses of water for all the synthesized materials are reported in Figure 4 and summarized in Table 3. These weight losses can be due to the release of water which is either adsorbed, directly involved in the bulk structure of these materials or resulting from P-OH condensation. For NaPYG-000 (which contains a significant amount of crystalline α-canaphite), the main weight loss (~ 16%) appeared at fairly low temperatures (between 80°C and 170°C), and was associated with an important endothermic event. The final weight loss was below the theoretical value expected for the loss of the four water molecules (21.6%) involved in α-canaphite (Na2CaP2O7.4H2O), and consistent with the loss of three water molecules. The missing water molecules could be due to the remaining amorphous component part for which the hydration rate can be different from the crystalline part. They could also be involved in the internal hydrolysis of part of pyrophosphate ions into orthophosphate ones (Equation (1)), associated with a small exothermic contribution around 173°C (SI-7, Figure S6). Such a phenomenon has been reported in other hydrated calcium pyrophosphates [15,16].
Figure 4.

(a) TGA and (b) DTA curves for NaPYG-000, NaPYG-010, NaPYG-030, NaPYG-060 materials. An expansion of the DTA curves is given in Figure S6–c.
| (1) |
Finally, the peak at 433°C corresponds to the crystallization of anhydrous Na2CaP2O7 phase (XRD data not shown). The general aspect of the weight loss curves was found to be quite similar for the amorphous samples NaPYG-020 to NaPYG-050 (see SI-7, Figure S6), with final percentage losses between 12 and 16%. All showed broad endothermic peaks attributed to water release (between 50 and 190°C). In contrast, a first plateau was observed for NaPYG-010 (at ~ 194°C), corresponding to a slowdown of water loss. This plateau was probably due to an internal hydrolysis (associated with an exothermic peak around 173°C) as water molecules are involved in this reaction. It is not observed for the other amorphous samples probably due to their lower initial pyrophosphate amount. An endothermic event associated to this plateau then occurred (from ~ 220°C) due to the quick loss of H2O after hydrolysis. For NaPYG-060 (nanocrystalline apatite), the weight loss was continuous (dehydration) up to 600°C, with a total weight loss below 5%. This value is consistent with those of nanocrystalline apatites (between 4 and 10%) [40].
Ca, Na and P amounts in NaPYG-0X0 materials were measured by ICP-OES spectrometry, after dissolution of the materials. Results were used to extrapolate the number of moles of each of these elements in 100 g of material (see Table 3 and supporting information SI-8 for the %). UHPLC was used to quantify chloride ions after dissolution: for all NaPYG material compositions, chloride concentrations were found to be below the detection limit, i.e.10−6 mol of Cl− for 100 g of material. For NaPYG-060 the concentrations of Ca, P and Na were consistent with Na-substituted nanocrystalline apatite [41]. For NaPYG-000, these values were found to be comparable to those of canaphite (Ca/P = 0.5 and Ca/Na = 0.5): (Ca/P)exp = 0.541 and (Ca/Na)exp = 0.548. The difference can be attributed to the presence of the amorphous phase as shown by 31P MAS NMR. For the other samples (amorphous), Ca amount increased with the ortho/pyrophosphate ratio from NaPYG-010 to NaPYG-040 and slightly decreased for NaPYG-050. At the same time, the phosphorus and sodium proportions decreased. These interdependent evolutions of calcium, sodium and phosphorus will be further discussed below.
Discussion
1). Texture and composition of the amorphous NaPYG materials
Considering SEM observations (Figure 1) at the lowest magnification, the morphologies of the materials containing mixed ortho/pyrophosphate entities (NaPYG-010 to NaPYG-050) were similar to those observed for sol-gel derived silica or bioactive silicate glasses [42]. Indeed, without taking any particular precaution during the gel drying step, a powder was observed with angular shapes, smooth compact surfaces, and irregular fractures due to solvent evaporation. This was the case for all amorphous NaPYG materials, contrary to NaPYG-000 for which the size of powder grains seemed essentially related to the crystallite size of the α-canaphite component. Conventional sol-gel processes involving silicon alkoxide precursors [43], colloidal gels are formed (at basic pH), leading to materials composed either of aggregated colloids when drying at moderate temperatures, or of a continuous network of coalesced particles (depending on the temperature of the final thermal treatment). Although this conventional sol-gel method was not implemented in the present study, preliminary TEM measurements were performed on NaPYG-030 materials (SI-9, Figure 7), suggesting that the millimetric grains of amorphous NaPYG materials were not formed of a continuous network but by the aggregation of colloids/nanoparticles (with a diameter from a few nanometers to several dozens of nanometers with a hierarchical organization). Considering the large amount of remaining water (between 12 and 16 w%), one could suggest that part of it is due to non-structural water located in the inter-colloidal spaces. Although it has not be demonstrated, it may play a key role in the material cohesion as the hydrated layer at the surface of apatite nanocrystals [44].
The relative proportions of phosphorus atoms involved as pyrophosphate (%Ppyro) and orthophosphate (%Portho) species were determined by fitting the 31P solid state NMR and Raman spectroscopic data (methodology for Raman in SI-3, Table S2). These results (Table 2) were compared to the proportions %Ppyro and %Portho in the initial solutions. First, it should be noted that similar values were found by 31P NMR for materials of different synthetic batches corresponding to the same targeted composition, showing the reproducibility of these syntheses (SI-10). Second, Raman and NMR quantifications were found to be consistent with each other (maximum difference of 7%). The small variations between both quantifications could be due to slight differences in the Raman scattering coefficients of respective orthophosphate and pyrophosphate bands (SI-3). The percentages of each phosphate species in the amorphous solids were found to globally follow the same trend as in the phosphate precursor solutions, i.e. a progressive increase of orthophosphates from NaPYG-010 to NaPYG-050, at the expense of pyrophosphates (non-linearity of evolution and excess of orthophosphates are discussed below). Combining these results with those of ICP-OES spectrometry and TGA, weight percentage of Ca2+, Na+, PO43−, P2O74− ions and H2O have been calculated for each composition. All weight percentages are reported in Figure 5–a (and SI-8, Table S4). The calcium and orthophosphate amounts were found to be clearly correlated, and to increase from NaPYG-010 to NaPYG-050 for orthophosphates and from NaPYG-010 to NaPYG-040 for Ca2+ ions. Simultaneously, sodium and pyrophosphate contents decreased.
The ionic charge balance was determined (per 100 g of sample) for each composition. As a first assumption, ortho- and pyrophosphate ions were considered as non-protonated in these calculations (Figure 5–b). They demonstrate that the relative value of the charge of phosphate species decreases when the relative amount of orthophosphates increases. The calcium charge evolution has the opposite curve trend to compensate it. Calcium is then the main counter-ion of phosphate species. It can be considered as a “linker” maintaining the cohesion of the phosphate network in these materials. Sodium, however, appears to only act as a positive “calcium substitute” when the amount of the latter is not high enough to balance the phosphate negative charges (NaPYG-010 and NaPYG-020). This effect of the local electric field should be predominant in absence of any additional steric effect as both cations have similar ionic radius (116 pm for Na+ and 114 pm for Ca2+, respectively). The sum of charges is still slightly negative and decreases with the amount of orthophosphate ions as previously indicated, suggesting an increase of protonation of phosphate entities. Considering this hypothesis, the calculated protonation rate of P-O groups are low and varies from 1.0% (NaPYG-010) to 3.6% (NaPYG-050) whatever the phosphate species (ortho/pyrophosphate).
Additional 1H solid state NMR analyses were thus carried out to investigate in more detail the protonation of the phosphate groups. While single pulse experiments essentially showed one main resonance corresponding to water molecules (Figure 3–c), Hahn echo experiments revealed the presence of underlying signals at higher chemical shifts (> 8 ppm) (Figure 6–a), which are consistent with protonated phosphates [45]. Additional 1H→31P HETCOR experiments were performed, which revealed correlations between these additional 1H resonances and the ortho and pyrophosphate 31P peaks at short contact times, thereby confirming their assignment to P-OH species (Figure 6–b and SI-11, Figures S9 and S10). Pyrophosphate are overall less protonated than orthophosphate. At this stage, a general chemical formula (Formula 1) can be proposed by combining 31P solid state NMR, ICP-OES spectrometry and TGA (assuming that the sum of orthophosphate and pyrophosphate equals to 1):
| (1) |
The stoichiometric coefficient of H+ was not measured but calculated considering the neutrality of the compound. In the case of NaPYG-030 for example, we determined that the chemical formula (Formula 2) is:
| (2) |
Figure 6.

a) 1H Hahn echo MAS NMR spectra of NaPYG-010 material recorded at 14.1 T, spinning at 22 kHz, using different echo delays (τ = 33, 133 and 533 μs), showing the presence of protonated phosphate resonances at higher chemical shifts (> 8 ppm); b) 1H→31P HETCOR NMR spectrum of NaPYG-010 recorded at 14.1 T, spinning at 22 kHz and using a short contact time (0.1 ms). The 1H Hahn echo spectrum recorded with τ = 533 μs is shown on the 1H projection of the HETCOR. The 1H NMR spectra in blue and red correspond to the 1H signals of the HETCOR which correlate with the pyro- and ortho-phosphate species, respectively.
In such materials orthophosphates and pyrophosphates can be considered as forming entities of the network whereas Ca2+ are bridging bivalent cations between phosphate species (pyro- and/or orthophosphates) and Na+/H+ non-bridging cations. As stated in our previous work [17], such compositions are close to those of invert glasses [46,47], that are elaborated by fusion with high amounts of glass modifying oxide (CaO) compared to forming oxide (P2O5). However, contrary to invert glasses, NaPYG materials contain a high amount of water and no clear glass transition temperature (Tg) was observed in thermal analyses. Hydrated amorphous calcium pyro- or orthophosphates synthesized at ambient temperature have also been described [10,15], but without both phosphate entities (or with small amount of orthophosphate generated in situ [16]).
2). Control of the ortho/pyrophosphate ratio and mechanism of formation of NaPYG materials
The formation of amorphous NaPYG materials is allowed by the inhibitory effect of orthophosphate ions on calcium pyrophosphate phase crystallization (and reciprocally) as illustrated by the data (NaPYG crystalline samples resulting from solutions containing only ortho- or pyrophosphate and amorphous samples resulting from solutions containing both phosphate species) and already described in the literature [47,48,49]. The possibility to finely control the pyro/orthophosphate ratio from the initial solution to give amorphous materials is particularly interesting in a view of biomedical applications to potentially reach tunable degradation due to pyrophosphate hydrolysis. Figure 7 presents the evolution of % Porthophosphate (vs %Ppyrophosphate) in NaPYG materials as a function of the initial %Porthophosphate in the precursor solution. 31P solid state NMR and Raman spectra evolutions showed the same trend: %Porthophosphate in the materials are higher than those of the precursor solution for materials synthesized with solutions rich in pyrophosphate entities (NaPYG-010/020/030), becoming closer in the case of orthophosphate rich solutions (NaPYG-040/050). Several hypotheses can be proposed to explain this orthophosphates overconcentration in the final material compared to pyrophosphates.
The first explanation is a partial hydrolysis of pyrophosphates into orthophosphates for low initial ortho/pyrophosphate ratios. Considering the basic pH of all the solutions (Table 1), this hydrolysis reaction is unlikely to occur during the first steps (colloidal solution and gel) [16] However, a solid state hydrolysis may occur during the drying step at 70°C. This assertion is supported by the fact that stronger correlations are observed on the 1H-31P HETCOR spectra between the P-OH groups and the orthophosphate 31P resonances (rather than the pyrophosphate ones) (see Figure 6–b). Nevertheless, the protonation rates of P-O groups calculated above (1.0% - 3.6%) are too low to explain the overconcentration of orthophosphate.
The second explanation could be linked to the mechanism of colloids formation in the solution and the preferential association of orthophosphate with calcium (vs pyrophosphate). Here, this would imply two different possibilities: i) orthophosphate and pyrophosphate ions are segregated into two different entities (ions pair, clusters…) and the solubility of the first one is higher leading to higher orthophosphate amount in the final material. Unfortunately, the pK of such amorphous entities has been poorly described, preventing the (in)validation of this hypothesis, ii) colloids are formed of entities associating both pyrophosphate and orthophosphate ions, the latter being predominant due to charges equilibrium. The results obtained for non-washed samples could confirm the segregation. Indeed, without any washing of the gel, canaphite was mainly formed for NaPYG-010, and nanocrystalline apatite for NaPYG-050, while a mix of both was observed for NaPYG-030 (SI-12). This is a proof that two kinds of nuclei are formed in the solution either containing orthophosphate or pyrophosphate. Moreover, it demonstrates that the washing step is critical to form amorphous materials, by removing remaining ions (not involved in the nuclei) from the gel.
Beyond the colloidal solution, one might wonder if the phosphate ions are still segregated in amorphous materials and how they are structured or associated. For this purpose, amorphous NaPYG could be compared to amorphous calcium (ortho)phosphates (ACPs) [10] for which the most common theory considers they are formed by building blocks called Posner’s cluster [50]. These clusters are around 1 nm in diameter and have a core chemical composition of Ca9(PO4)6 and a well-defined structure [51]. These units have been identified in the first steps of hydroxyapatite and several other crystalline calcium orthophosphates formation [52]. Analogous cluster models of amorphous Ca-pyrophosphates have not been described to date. However, previous PDF (pair distribution function) studies [15,53] on hydrated and amorphous pyrophosphate phases (Ca2P2O7.nH2O) demonstrated a complete loss of structural coherence beyond interatomic separations greater than 7.5–8.0 Å that can be attributed to calcium pyrophosphate clusters.
Additional high resolution solid state NMR experiments were performed to analyze in more detail the nature of the domains forming the NaPYG amorphous materials. First, a 31P SQ-DQ NMR experiment was performed, which allows probing the proximities between ortho- and pyrophosphate units (Figure 8–a). The observation of cross peaks on the 2D spectrum is a proof of the spatial proximity between ortho- and pyrophosphate units. Second, 23Na-31P D-HMQC experiments were performed (Figure 8–b), in order to probe the Na+/phosphate proximities. The same correlation was observed between the broad 23Na resonance and the two types of phosphate units, which further confirms that these anions are intimately associated in the material. While both of these NMR experiments demonstrate the existence of mixed ortho-/pyrophosphate entities, the additional presence of some segregated ortho- or pyrophosphate domains/clusters cannot be ruled out at this stage.
Figure 8.

(a) 31P SQ-DQ spectrum of NaPYG030 acquired at 16.4 T, spinning at 14 kHz. The dashed red boxes show the cross-peaks between ortho and pyrophosphate units, (b) 23Na31P D-HMQC spectrum of NaPYG010 material, acquired at 18.8 T using 20 kHz spinning speed (the 23Na NMR spectra in blue and red correspond to correlations with pyro- and orthophosphate ions, respectively).
The charge compensation within clusters is meant to be ensured by both Ca2+ and Na+ ions. A recent molecular dynamics study [54] has shown that the stoichiometry of orthophosphate clusters can slightly vary depending on several parameters such as ageing of the solution, protonation of phosphate groups, partial calcium substitution by sodium ions, variation of supersaturation ratios. When orthophosphates are partially protonated, sodium was shown to be a substitute for calcium in the external layer of the Posner-like clusters, with various Na/Ca ratios. Another recent study has demonstrated that sodium could facilitate the aggregation of charged clusters and could substitute for calcium as cluster-binding cation [55]. Based on these studies, a hypothesis of mixed ortho/pyrophosphates cluster can be proposed explaining the 23Na NMR data (Figure 3–d). Indeed, the two Na+ environments which were detected could correspond to intra-cluster sodium sites (broad signal which correlates to the ortho and pyrophosphate signals) and more mobile sodium ions at the surface of these clusters. Naturally such hypothesis will need to be confirmed by complementary investigations (coupled WAXS/SAXS associated with simulation).
Conclusion
This article describes the low temperature synthesis of hydrated amorphous calcium/sodium ortho-/pyrophosphate materials (NaPYG). For the first time, these compounds were obtained in a large range of orthophosphate/pyrophosphate molar ratios, mainly due to reciprocal inhibitory effect of the two phosphate entities on their respective crystallization with calcium. This ratio can be controlled in the final material as its evolution follows the same trend than that of phosphate precursors in the initial solution (with orthophosphates in excess in the amorphous materials). Controlling this ratio is of major interest as it could open the way for the tuning of enzyme or pH-driven degradation rate of such materials.
Preliminary results regarding the behavior of the samples in vitro have been obtained, revealing that : i) the pyrophosphates could be hydrolyzed in water, in standard SBF solutions and in TRIS media supplemented or not with ALP enzymes ii) the evolutions of the different materials are correlated with their initial ortho/pyro-phosphate ratio. Clearly this ratio appears as a key parameter potentially offering the ability to tune up the biological behaviour. The complete in vitro and in vivo study of these materials will be presented in a forthcoming publication. Beyond their synthesis, multi-scale characterizations have been carried out, including advanced multinuclear solid state NMR. This led to a general formula quantifying their composition. The data suggest that these solids are formed by the aggregation of colloids. They are also consistent with a cluster-based material. Although their existence will need to be investigated in detail by complementary techniques, such clusters could be formed by calcium, sodium and partially protonated ortho- and pyrophosphate entities and be associated together through surface water and sodium cations, ensuring the overall cohesion of the whole material.
Supplementary Material
SI-1: Synthesis of α-canaphite
SI-2: Full experimental details of the solid state NMR experiments.
SI-3: Methodology for the determination of the orthophosphate and pyrophosphate proportions from Raman spectra
SI-4: 31P CP-INADEQUATE and CP-MAS solid state NMR spectra
SI-5: 23Na solid state NMR data, including spectral deconvolutions
SI-6: 43Ca solid state NMR data of NaPYG-050, recorded at both 20.0 T and 35.2 T.
SI-7: TGA and DTA of NaPYG-020, NaPYG-030, NaPYG-040, NaPYG-050 samples.
SI-8: Mass percentages of Ca2+, Na+, PO43−, P2O74− and H2O in NaPYG materials.
SI-9: TEM picture of NaPYG030 sample.
SI-10: Comparison of 31P and 23Na NMR spectra of materials from different synthetic batches of NaPYG-010.
SI-11: 1H Hahn echo spectra of NaPYG materials, and 1H→31P HETCOR study of NaPYG-010.
SI-12: XRD diagrams and Raman spectra of NaPYG materials obtained without the washing step.
Statement of Significance.
The metastability of amorphous phosphate-based materials with various chain length often improves their (bio)chemical reactivity. However, the control of the ratio of the different phosphate entities has not been yet described especially for small ions (pyrophosphate/orthophosphate) and using soft chemistry, whereas it opens the way for the tuning of enzyme- and/or pH-driven degradation and biological properties. Our study focuses on elaboration of amorphous gel-derived hydrated calcium/sodium ortho/pyrophosphate solids at 70°C with a large range of orthophosphate/pyrophosphate ratios. Multi-scale characterization was carried out using various techniques such as advanced multinuclear SSNMR ( 31P, 23Na, 1H, 43Ca). Analyses suggest that these solids are formed by colloids aggregation and that the location of mobile water and sodium could play a role in the material cohesion.
Acknowledgments
The authors would like to thank the Agence Nationale de la Recherche (PyVerres project - grant n°ANR-16-CE19-0013) for supporting this research work. The authors are grateful for access to UK 850 MHz solid-state NMR Facility used in this research and funded by EPSRC and BBSRC (contract reference PR140003), as well as University of Warwick including via part funding through Birmingham Science City Advanced Materials Project 1 and 2, supported by Advantage West Midlands (AWM) and the European Regional Development Fund (ERDF). A portion of this work was performed at the National High Magnetic Field Laboratory, which is supported by the National Science Foundation Cooperative Agreement No. DMR-1157490 & DMR-1644779, and the State of Florida. The French Région Ile de France - SESAME program is acknowledged for financial support (700 MHz NMR spectrometer). Dinu Iuga isacknowledged for their assistance in some of the NMR experiments.
Footnotes
Conflicts of interest
There are no conflicts to declare.
References
- [1].Hoppe A, Güldal NS, Boccaccini AR, A review of the biological response to ionic dissolution products from bioactive glasses and glass-ceramics. Biomater, 32 (2011) 2757–2774 [DOI] [PubMed] [Google Scholar]
- [2].Hench LL, The story of Bioglass. J. Mater. Sci. Mater. Med. 17 (2006) 967–78. [DOI] [PubMed] [Google Scholar]
- [3].Jones JR, Review of bioactive glass: from Hench to hybrids. Acta Biomater. 9, (2013) 4457–86. [DOI] [PubMed] [Google Scholar]
- [4].Brow RK. Review: the structure of simple phosphate glasses. J. Non. Cryst. Solids (2000) 263–264. [Google Scholar]
- [5].Knowles JC, Phosphate based glasses for biomedical applications. J. Mater. Chem. 13, (2003) 2395. [Google Scholar]
- [6].Ahmed I, Collins CA, Lewis MP, Olsen I, Knowles JC, Processing , characterisation and biocompatibility of iron-phosphate glass fibres for tissue engineering. 25, (2004) 3223–3232. [DOI] [PubMed] [Google Scholar]
- [7].Kasuga T, Hosoi Y, Nogamie M, Apatite Formation on Calcium Phosphate Invert Glasses in Simulated Body Fluid. 52, (2001) 450–452. [Google Scholar]
- [8].Brauer DS, Karpukhina N, Law RV, Hill RG, Effect of TiO2 addition on structure , solubility and crystallisation of phosphate invert glasses for biomedical applications. J. Non. Cryst. Solids 356, (2010) 2626–2633. [Google Scholar]
- [9].Sharmin N, Rudd CD, Parsons AJ, Ahmed I, Structure, viscosity and fibre drawing properties of phosphate-based glasses: effect of boron and iron oxide addition. J. Mater. Sci. 51, (2016) 7523–7535. [Google Scholar]
- [10].Combes C, Rey C, Amorphous calcium phosphates: Synthesis, properties and uses in biomaterials. Acta Biomater 6, (2010) 3362–3378. [DOI] [PubMed] [Google Scholar]
- [11].Pickup DM, JNewport R.Barney RJ Kim ER Valappil JY Knowles SP J.C.Characterisation of phosphate coacervates for potential biomedical applications. Journal of biomaterials applications 28, (2014) 226–1234. [DOI] [PMC free article] [PubMed] [Google Scholar]
- [12].Gomez F, Vas P, Willot G. Influence of pH on the Formation of Polyphosphate Coacervates. Phosphorus Res. Bull. 11, (2015) 53–60. [Google Scholar]
- [13].Pilliar RM, Kandel RA, Grynpas MD, Hu Y, Porous calcium polyphosphate as load-bearing bone substitutes: In vivo study, J. Biomed. Mater. Res. - Part B Appl. Biomater 101 B (2013) 1–8. [DOI] [PubMed] [Google Scholar]
- [14].Momeni A, Filiaggi MJ, Comprehensive study of the chelation and coacervation of alkaline earth metals in the presence of sodium polyphosphate solution. Langmuir 30, (2014) 5256–5266. [DOI] [PubMed] [Google Scholar]
- [15].Slater C, Laurencin D, Burnell V, Smith ME, Grover LM, Hriljac A JA.J. Wright Enhanced stability and local structure in biologically relevant amorphous materials containing pyrophosphate. J. Mater. Chem. 21, (2011) 18783–18791. [Google Scholar]
- [16].Gras P, Rey C, Marsan O, Sarda S, Combes C, Synthesis and characterisation of hydrated calcium pyrophosphate phases of biological interest, Eur. J. Inorg. Chem. (2013) 5886–5895. [Google Scholar]
- [17].Soulié J, Gras P, Marsan O, Laurencin D, Rey C, Combes C, Development of a new family of monolithic calcium (pyro)phosphate glasses by soft chemistry, Acta Biomater 41 (2016) 320–327. [DOI] [PubMed] [Google Scholar]
- [18].Rey C, Combes C, Drouet C, Sfihi H, Barroug A, Physico-chemical properties of nanocrystalline apatites: Implications for biominerals and biomaterials, Mater. Sci. Eng. C. 27 (2007) 198–205. [Google Scholar]
- [19].Gennari FJ, Disorders of potassium homeostasis. Hypokalemia and hyperkalemia. Crit. Care Clin. 18 (2002) 273–88. [DOI] [PubMed] [Google Scholar]
- [20].Grover LM, Wright AJ, Gbureck U, Bolarinwa A, Song J, Liu Y, Farrar DF, Howling G, Rose J, Barralet JE, The effect of amorphous pyrophosphate on calcium phosphate cement resorption and bone generation, Biomaterials 34 (2013) 6631–6637. [DOI] [PubMed] [Google Scholar]
- [21].Naga SM, Awaad M, El-Maghraby HF, El-Kady A, Biological AM performance of calcium pyrophosphate-coated porous alumina scaffolds. Int. J. Appl. Ceram. Technol. 11 (2014) 111. [Google Scholar]
- [22].Koo S, König B, Allegrini S, Yoshimoto M, Carbonari MJ, Mitri-Luiz FF, Titanium implant osseointegration with calcium pyrophosphate in rabbits, J. Biomed. Mater. Res. - Part B Appl. Biomater 76 (2006) 373–380. doi: 10.1002/jbm.b.30383.Koo, S. König, S. Allegrini, M. [DOI] [PubMed] [Google Scholar]
- [23].Lee JH, Chang BS, Jeung UO, Park KW, Kim MS, Lee CK, The first clinical trial of beta-calcium pyrophosphate as a novel bone graft extender in instrumented posterolateral Lumbar fusion, Clin. Orthop. Surg 3 (2011) 238–244. [DOI] [PMC free article] [PubMed] [Google Scholar]
- [24].Flodgaard H, Fleron P, Thermodynamic parameters for the hydrolysis of inorganic pyrophosphate at pH 7.4 as a function of [Mg2+], [K+], and ionic strength determined from equilibrium studies of the reaction, J. Biol. Chem. 249 (1974) 3465–3474. [PubMed] [Google Scholar]
- [25].Addison WN, Azari F, Sørensen ES, Kaartinen MT, McKnee MD Pyrophosphate inhibits mineralization of osteoblast cultures by binding to mineral, up-regulating osteopontin, and inhibiting alkaline phosphatase activity., J. Biol. Chem.. 282 (2007) 15872–15883. [DOI] [PubMed] [Google Scholar]
- [26].Heinonen JK. Biological Role of Inorganic Pyrophosphate, (2001),25, Springer [Google Scholar]
- [27].Vandecandelaère N, Champion E, Rossignol F, Navrotsky A, Grossin D, Aufray M, Rollin-Martinet S, Drouet C, Rey C, Nanocrystalline apatites: The fundamental role of water, Am. Mineral. 103 (2018) 550–564. [Google Scholar]
- [28].Cheng P, Pritzker KPH, Nyburg SC, Calcium Disodium Pyrophosphate Tetrahydrate, Acta Crystallogr. B 36 (1980) 921–924. [Google Scholar]
- [29].Fayon F, Le Saout G, Emsley L, Massiot D, Through-bond phosphorus-phosphorus connectivities in crystalline and disordered phosphates by solid-state NMR, Chem. Commun. 2 (2002) 1702–1703. [DOI] [PubMed] [Google Scholar]
- [30].Hohwy M, Rienstra CM, Jaroniec CP, Griffin RG, Fivefold symmetric homonuclear dipolar recoupling in rotating solids: Application to double quantum spectroscopy, J. Chem. Phys. 110 (1999) 7983–7992. [Google Scholar]
- [31].Lafon O, Wang Q, Hu B, Vasconcelos F, Trébosc J, Cristol S, Deng F, Amoureux JP, Indirect detection via spin-1/2 nuclei in solid state NMR spectroscopy: Application to the observation of proximities between protons and quadrupolar nuclei, J. Phys. Chem. A. 113 (2009) 12864–12878. [DOI] [PubMed] [Google Scholar]
- [32].Perras FA, Viger-Gravel J, Burgess KMN, Bryce DL, Signal enhancement in solid-state NMR of quadrupolar nuclei, Solid State Nucl. Magn. Reson. 51–52 (2013) 1–15. [DOI] [PubMed] [Google Scholar]
- [33].Gan Z, Hung I, Wang X, Paulino J, Wu G, Litvak IM, Gor’kov PL, Brey WW, Lendi P, Schiano JL, Bird MD, Dixon IR, Toth J, Boebinger GS, Cross TA, NMR spectroscopy up to 35.2 T using a series-connected hybrid magnet, J. Magn. Reson. 284 (2017) 125–136. [DOI] [PMC free article] [PubMed] [Google Scholar]
- [34].Bonhomme C, Wang X, Hung I, Gan Z, Gervais C, Sassoye C, Rimsza J, Du J, Smith ME, Hanna JV, Sarda S, Gras P, Combes C, Laurencin D, Pushing the limits of sensitivity and resolution for natural abundance 43 Ca NMR using ultra-high magnetic field (35.2 T) , Chem. Commun. 54 (2018) 9591–9594. [DOI] [PubMed] [Google Scholar]
- [35].Pilar Sepulveda LLH, Julian R Jones, Characterization of Melt-Derived 45S5 and sol-gel–derived 58S Bioactive Glasses, J. Biomed. Mater. Res. (2001) 564–569. [DOI] [PubMed] [Google Scholar]
- [36].Rouse C, Peacor D, Freed R, Pyrophosphate groups in the structure of canaphite : The first phosphate as a mineral occurrence of a condensed phosphate as a mineral, 7 (1988) 161–171. [Google Scholar]
- [37].Mason HE, Kozlowski A, Phillips BL, Solid-state NMR study of the role of H and Na in AB-type carbonate hydroxylapatite-Supporting Information 1, (2008) 1–6.
- [38].Gras P, Baker A, Combes C, Rey C, Sarda S, Wright AJ, Smith ME, Hanna JV, Gervais C, Laurencin D, Bonhomme C, From crystalline to amorphous calcium pyrophosphates: A solid state Nuclear Magnetic Resonance perspective, Acta Biomater 31 (2016) 348–357. [DOI] [PubMed] [Google Scholar]
- [39].Gambuzzi E, Pedone A, Menziani MC, Angeli F, Florian P, Charpentier T, Calcium environment in silicate and aluminosilicate glasses probed by 43Ca MQMAS NMR experiments and MD-GIPAW calculations, Solid State Nucl. Magn. Reson. 68 (2015) 31–36. [DOI] [PubMed] [Google Scholar]
- [40].Rollin-Martinet S, Navrotsky A, Champion E, Grossin D, Drouet C, Thermodynamic basis for evolution of apatite in calcified tissues., Am. Mineral. 98 (2013) 2045. [Google Scholar]
- [41].Ratnayake JTB, Mucalo M, Dias GJ, Substituted hydroxyapatites for bone regeneration: A review of current trends, J. Biomed. Mater. Res. - Part B Appl. Biomater 105 (2017) 1285–1299. [DOI] [PubMed] [Google Scholar]
- [42].Soulié J, Lao J, Jallot E, Nedelec JM, Influence of mesostructuration on the reactivity of bioactive glasses in biological medium: a PIXE-RBS study, J. Mater. Chem. 22 (2012) 20680. [Google Scholar]
- [43].Brinker C & Scherer G Sol → gel → glass: I. Gelation and gel structure. 70, (1985) 301–322. [Google Scholar]
- [44].Grossin D, Rollin-Martinet S, Estournès C, Rossignol F, Champion E, Combes C, Rey C, Geoffroy C, Drouet C, Biomimetic apatite sintered at very low temperature by spark plasma sintering: Physico-chemistry and microstructure aspects, Acta Biomater 6 (2010) 577–585. [DOI] [PubMed] [Google Scholar]
- [45].Pourpoint F, Gervais C, Bonhomme-Coury L, Azaïs T, Coelho C, Mauri F, Alonso B, Babonneau F, Bonhomme C, Calcium phosphates and hydroxyapatite: Solid-state NMR experiments and first-principles calculations, Appl. Magn. Reson. 32 (2007) 435–457. [Google Scholar]
- [46].Brauer DS, Rüssel C, Kraft J, Solubility of glasses in the system P2O5-CaO-MgO-Na2O-TiO2: Experimental and modeling using artificial neural networks, J. Non. Cryst. Solids. 353 (2007) 263–270. [Google Scholar]
- [47].Brauer DS, Wilson RM, Kasuga T, Multicomponent phosphate invert glasses with improved processing, J. Non. Cryst. Solids. 358 (2012) 1720–1723. [Google Scholar]
- [48].Herbert F, Sylvia B, Mechanism of calcification: inhibitory role of pyrophosphate, Nature. (1962) 911. [DOI] [PubMed] [Google Scholar]
- [49].Eidelman N, Brown WE, The effect of pyrophosphate concentrations on calcium phosphate growth on well-crystallized octacalcium phosphate and hydroxyapatite seed crystals, 108 (1990) 385–393. [Google Scholar]
- [50].Thouverey C, Bechkoff G, Pikula S, Buchet R, Inorganic pyrophosphate as a regulator of hydroxyapatite or calcium pyrophosphate dihydrate mineral deposition by matrix vesicles, Osteoarthr. Cartil 17 (2009) 64–72. [DOI] [PubMed] [Google Scholar]
- [51].Betts F, Posner AS, An X-ray radial distribution study of amorphous calcium phosphate, Mater. Res. Bull. 9 (1974) 353–360. [Google Scholar]
- [52].Treboux G, Layrolle P, Kanzaki N, Onuma K, Ito A, Existence of posner’s cluster in vacuum, J. Phys. Chem. A. 104 (2000) 5111–5114. [Google Scholar]
- [53].Andersson M, Transformation of amorphous calcium phosphate to bone-like apatite, Nat. Commun (2018). [DOI] [PMC free article] [PubMed] [Google Scholar]
- [54].Gras P Etude Physico-Chimique Et Structurale De Pyrophosphates De Calcium Hydrates: Application Aux Micro-Calcifications Associees a L’Arthrose. PhD. Univ. Toulouse (2014) 208. [Google Scholar]
- [55].De Leeuw NH, Di D, De Leeuw NH, Detection of Posner’s clusters during calcium phosphate nucleation: a molecular dynamics study, J. Mater. Chem. B 5 (2017) 7274–7284. [DOI] [PubMed] [Google Scholar]
- [56].Yang X, Wang M, Yang Y, Cui B, Xu Z, Yang X, Physical origin underlying the prenucleation-cluster-mediated nonclassical nucleation pathways for calcium phosphate, Phys. Chem. Chem. Phys. 9 (2019). [DOI] [PubMed] [Google Scholar]
Associated Data
This section collects any data citations, data availability statements, or supplementary materials included in this article.
Supplementary Materials
SI-1: Synthesis of α-canaphite
SI-2: Full experimental details of the solid state NMR experiments.
SI-3: Methodology for the determination of the orthophosphate and pyrophosphate proportions from Raman spectra
SI-4: 31P CP-INADEQUATE and CP-MAS solid state NMR spectra
SI-5: 23Na solid state NMR data, including spectral deconvolutions
SI-6: 43Ca solid state NMR data of NaPYG-050, recorded at both 20.0 T and 35.2 T.
SI-7: TGA and DTA of NaPYG-020, NaPYG-030, NaPYG-040, NaPYG-050 samples.
SI-8: Mass percentages of Ca2+, Na+, PO43−, P2O74− and H2O in NaPYG materials.
SI-9: TEM picture of NaPYG030 sample.
SI-10: Comparison of 31P and 23Na NMR spectra of materials from different synthetic batches of NaPYG-010.
SI-11: 1H Hahn echo spectra of NaPYG materials, and 1H→31P HETCOR study of NaPYG-010.
SI-12: XRD diagrams and Raman spectra of NaPYG materials obtained without the washing step.