

Abstract
Low parasympathetic regulation of cardiac activity, known as cardiac vagal control (CVC), is robustly associated with poor health outcomes. However, the etiological mechanism that undergirds this association remains largely unknown. One explanation is a causal relationship wherein health problems cause low CVC, or vice versa. However, an alternative explanation is that a common set of genetic factors contributes to both increased liability for poor health and low CVC (i.e., pleiotropy). The present study uses polygenic risk scores for a number of health-related phenotypes (physical, mental, behavioral) to test whether genetic liability for poor health has pleiotropic effects on CVC. We report evidence for shared genetic liability between low CVC and both poor physical health (elevated triglycerides) and risky health-related behaviors (increased drinking and sexual activity). The present findings are consistent with shared genetic liability explaining, at least in part, the well-documented correlation between CVC and health.
Keywords: cardiac vagal control, heart rate variability, genetic liability, polygenic scores
A mounting body of evidence links poor cardiac vagal control (CVC; parasympathetic regulation of the heart) with a constellation of negative health conditions and psychosocial factors including cardiovascular disease, symptoms of anxiety and depression, dysregulated emotions, and limited behavioral control (Beauchaine, 2015; Thayer, Yamamoto, & Brosschot, 2010). In light of the myriad associations between low CVC and dysregulated health and behavior, researchers routinely use CVC as a biomarker, particularly for health-related outcomes (Gidron, Deschepper, De Couck, Thayer, & Velkeniers, 2018; Holzman & Bridgett, 2017). However, scientists’ utilization of low CVC as a risk factor for poor health may have outstripped comprehensive scientific understanding of how CVC relates to health.
Despite strong evidence for an association between low CVC and poor health-related outcomes, particularly poor physical and behavioral health (Appelhans & Luecken, 2006), the etiology of these relationships remains largely unknown (Heathers, Brown, Coyne, & Friedman, 2015). On the one hand, some evidence suggests poor health may precede low CVC (Gidron et al., 2018). On the other hand, direct augmentation of CVC can precede improvements in mental health and performance on socio-emotional tasks (Sellaro, de Gelder, Finisguerra, & Colzato, 2018; Wheat & Larkin, 2010). Consequently, the etiology of the association between health and CVC remains difficult to discern, in part, because evidence is consistent with bi-directional or reciprocal effects.
However, little to no work has tested an alternative explanation for the association between low CVC and poor health: a common set of genetic factors contributes to both increased liability for low CVC and poor health (for a relevant exception, see Su et al., 2009). The present article explores this possibility by testing whether polygenic liability for poor health (physical, mental, and behavioral) is associated with CVC in a large, nationally-representative sample of adults in the United States.
Method
Sample
The present sample includes data from participants who were enrolled in the biomarker project of the Study of Midlife Development in the United States (MIDUS). Participants consented to provide genetic data and were of European ancestry as determined by genotype principal components analysis (N = 1293, Mage = 56.61, 51% female). Additional information regarding participant recruitment and data collection can be found elsewhere (Ryff & Krueger, 2018).
Measures
Genotyping, Imputation, & Polygenic Risk Scoring.
DNA collection and genotype calling for MIDUS are detailed elsewhere (Mann, Shabalin, Docherty, & Krueger, 2019). Genotypes were imputed using the Michigan Imputation Server pipeline and the 1000 Genomes phase 3 as a reference panel, including phasing and imputation using Eagle (Loh et al., 2016) and minimac3 software (Das et al., 2016). Single nucleotide polymorphisms (SNPs) with ambiguous strand orientation, >5% missing calls, or out of Hardy-Weinberg equilibrium (p < 0.001) were excluded. SNPs with minor allele frequency below 0.01 or imputation R2 < 0.5 were also excluded. PLINK (Chang et al., 2015) was used to handle all genomic data and perform quality control checks. Using an a priori p-value threshold of 1.0 (i.e. including the infinitesimal effects of all measured and imputed SNPs), polygenic risk scores for physical and behavioral health outcomes were calculated using PRSice 2.0 (Euesden, Lewis, & O’Reilly, 2014) based on genome wide association summary statistic weights from current GWASs for each phenotype (Duncan et al., 2018; Genetics et al., 2018; Linnér et al., 2019; Okbay et al., 2016; Otowa et al., 2016; Schunkert et al., 2011; Teslovich et al., 2010; van den Berg et al., 2016; Wray et al., 2018).
Selection and validation of polygenic risk scores.
For the purposes of the present study, we began by identifying 15 polygenic risk scores for potential analysis with CVC, basing our selection on previous literature reporting associations between biological and psychological variables and cardiac vagal control. The 15 phenotypes naturally grouped into three broad categories: physical health (HDL, LDL, total cholesterol, and triglycerides), mental health (anxiety disorder symptoms, depression symptoms, major depressive disorder, obsessive-compulsive disorder, and post-traumatic stress disorder), and behavioral control (adventurousness, automobile speeding propensity, history of regular smoking, number of sexual partners, frequency of drinking alcoholic beverages, and a general index of risky behavior that reflects the previous four behaviors). We first estimated zero-order correlations to evaluate potential collinearity within each of these natural groupings of polygenic scores (see Figure S1 in the Supplemental Materials). We then validated the initially selected polygenic scores with relevant health and behavioral data (when available) from the MIDUS study (consult the Supplemental Materials for full information regarding the validation procedure). Since the quality of polygenic scores is impacted by the sample size of the discovery GWAS, we report the sample size for each of the discovery GWASs in Appendix A. In this manuscript, no discovery GWAS that was used to calculate a PRS had a sample size below 95,000.
For 9 of the 15 PRSs (HDL, LDL, total cholesterol, triglycerides, depression symptoms, anxiety symptoms, adventurousness, drinking frequency, ever smoked) there were corresponding phenotypic data available for PRS validation. The predictive validity of these 9 polygenic scores varied considerably such that not all polygenic scores were significantly predictive of their respective phenotypes. The squared semi-partial correlations between depressive symptoms, HDL, LDL, total cholesterol, triglycerides and whether or not a participant had ever regularly smoked with their respective polygenic scores were all in the predicted direction and statistically significant (ps < .05; consult Supplemental Materials Table 2 for full results). Moreover, these associations control for chronological age, biological sex as determined by genotype, and the first five genetic principal components. However, squared semi-partial correlations between anxiety symptoms, adventurousness, and alcoholic drinking propensity with their respective polygenic scores were approximately zero, although the zero-order correlation between drinks per week and its polygenic score was just beyond traditional levels of statistical significance for rejecting the null hypothesis of no association (p = .097).
Based on evidence for predictive validity, polygenic scores for depressive symptoms, HDL, LDL, total cholesterol, triglycerides, and whether or not the participant ever smoked were included in further analyses with CVC. The polygenic score for risky health behaviors could not be directly validated in the MIDUS dataset because the measure of risky health behaviors was calculated in the discovery GWAS as a combination of smoking, drinking, speeding, and number of lifetime sexual partners , and data on automobile speeding and lifetime number of sexual partners were not collected in MIDUS. Nevertheless, the PRS for smoking was validated in the current study, and the PRSs for smoking, speeding, number of sexual partners, and risky health behaviors were derived from GWASs that were based on overlapping samples from similar source populations1.
Therefore, despite not having the phenotype data to test predictive validity, we included the risky health behavior PRS, as well as the PRS for speeding and lifetime number of sexual partners as potential predictors of CVC in the present study. However, we excluded polygenic scores from further analyses that were not at least marginally associated (ps > .10) with their respective phenotypes in both univariate and multivariate validation checks (see Table S2 in the Supplemental Material). Thus, our final group of polygenic scores consisted of a set of 10: HDL, LDL, total cholesterol, triglycerides, depression symptoms, ever smoked, drinking frequency, speeding propensity, number of sexual partners, and a risky health behaviors index— encompassing the previous 4 behaviors).
Cardiac vagal control.
Cardiac vagal control was assessed during an 11-minute resting baseline period via high-frequency heart rate variability (HF-HRV). High-frequency heart rate variability was calculated by the natural log transform of the summed spectral power of the inter-beat interval series between .15 and .5 Hz. Although .15-.4 Hz has recently become the recommended frequency range for HF-HRV (Laborde, Mosley, & Thayer, 2017), the MIDUS biomarker project began and HRV was calculated before this range was widely adopted among researchers. All psychophysiology data and polygenic scores are available on the MIDUS Colectica portal, along with extensive documentation regarding how each measure was calculated (http://midus.colectica.org/).
Results
As expected, the distributions of CVC (as indicated by high-frequency heart rate variability) and polygenic scores approximated normality. Therefore, zero-order Pearson product-moment correlations between CVC and the 10 selected polygenic scores were estimated (Hallquist & Wiley, 2018; Muthén, & Muthén, 2017). The magnitude of zero-order correlations was generally small (range r = −.091 to .048). Nonetheless, CVC showed notable correlations with polygenic liability for elevated triglycerides (r = −.082, SE = .03, p = .007) and polygenic liability for risky health behavior (r = −.091, SE = .03, p = .002). Furthermore, CVC was associated with polygenic liability for two other risky health behaviors, even after adjusting the false discovery-rate among these four measures using the Benjamini-Hochberg method (Benjamini & Hochberg, 1995): number of sexual partners (r = −.067, SE = .03, p = .048), and number of drinks per week (r = −.089, SE = .03, p = .012).
We followed up these four zero-order associations with a set of multiple linear regressions to test their robustness in the presence of potential covariates. In four separate models, we regressed CVC on the polygenic score for the phenotype (e.g. triglycerides, sexual partners, drinks per week, or the risky health behavior index), age (mean-centered), biological sex (coded m = −.5, female = .5), and the first five genetic principal components. In these models, the polygenic risk scores for triglycerides (b = −0.072, CI95% [−0.128, −0.016], p = .015), drinks per week (b = −0.066, CI95% [−0.125, −0.012], p = .020), and the risky health behavior index (b = −0.067, CI95% [−0.122, −0.017], p = .013), had small but statistically significant effects on HF-HRV. After accounting for the effects of covariates, the association between CVC and the polygenic score for number of sexual partners remained negative (b = −0.052, CI95% [−0.107, 0.000], p = .060), but the probability of the observed semi-partial association assuming the null hypothesis were true just exceeded conventional standards for statistical significance (i.e. p > .05). The percentage of variance in CVC explained by individual polygenic risk scores after removing variance explained by covariates was small (triglycerides: .5%; drinks per week: .4%; risky health behavior index: .5%). As Mplus does not report multiple partial or semi-partial correlations for regression models, they were manually estimated by defining a user-specified parameter (see a detailed description of the same procedures, see (Mann et al., 2019).
We used R version 3.5.2, MPlus version 8.1, and the 'MplusAutomation' package version 0.7.1 to interface from R to MPlus. Since the present sample includes siblings and twins, we implemented a Huber-White sandwich estimator in all models to adjust standard errors for by-family non-independence. Results of null hypothesis significance tests remain unchanged and effect sizes are similar when observations from siblings are excluded from analyses (n = 1186). Furthermore, since respiratory rate may influence CVC estimates, an additional, identical set of analyses was run on HF-HRV adjusted for respiratory rate. The effect size and precision of the estimated regressions reported in the main text remain unchanged after adjustment for respiration rate. In efforts to promote open and reproducible science, all analysis scripts are publicly available via the Open Science Framework (https://osf.io/hz6qw/).
Discussion
The present findings illuminate complex etiological relations that exist between CVC and physical and behavioral aspects of health by showing that genetic liability for elevated triglycerides and risky health behaviors is associated with low CVC. The results reported here do not preclude the possibility of a causal relationship between CVC and health-related outcomes and should interpreted with caution prior to replication. However, the results of the present study are consistent with pleiotropy explaining, at least in part, the relationship between CVC and health-related outcomes, as genetic liability for health-related outcomes was significantly associated with individual differences in CVC.
The current study is not without limitations. Polygenic scores provide an imperfect genetic proxy for a phenotype, including only the additive effects of common SNPs (i.e. point mutations). Therefore, a limitation to any polygenic risk score analysis is that PRSs do not include the effects of rare variants, insertions, deletions, nor copy number variants. Non-additive genetic effects including dominance and epistasis are also not captured by polygenic scores. Finally, polygenic scores provide a “main effect” estimate of genetic effects, which is assumed to remain stable across different environments, cohorts, and socio-demographic strata (i.e. no gene-by-environment interaction). The small effect sizes for polygenic scores documented in the current study might be expected in light of the above considerations. Future studies may benefit from testing whether the strength of genetic effects documented in the current study wax or wane across putatively moderating environmental conditions.
Although small, the incremental effects of polygenic scores on CVC were statistically significant, even after accounting for age, biological sex, and the first five genetic principal components. For comparison, in the discovery GWAS for risky health behaviors, the percent of variance explained by SNPs on their respective phenotypes was relatively small (R2 = .04 to .13) and less than the percent of variance explained by the first genetic principal component for risky health behaviors (R2 = .16; Linnér etl al., 2019). Given that polygenic scores in the current study were used to predict a related yet distinct and distal phenotype, and the first five genetic pincipal components were included as covariates, the small incremental effect of polygenic scores on CVC is consistent with what might be expected based on extant research. As discovery GWASs continue to grow in size, the percent of variation explained by polygenic scores will likely continue to grow.
With respect to research on CVC, the findings reported here strengthen the position of those who employ CVC as a biomarker for physical and behavioral health, as variation in CVC is significantly associated with genetic liability for physical and behavioral health. The present findings also strengthen a central claim of the Neurovisceral Integration Model, one leading theoretical framework for the function of CVC, which argues that CVC is a peripheral indicator of regulated health and behavior (Thayer & Lane, 2000). In light of an independent stream of neuroscientific evidence implicating prefrontal control systems with both CVC and behavioral regulation and bolstered by the results of the current study, CVC may be considered a biologically-undergirded peripheral correlate of inter-individual differences in behavioral control (Amodio, Master, Yee, & Taylor, 2008; Thayer, Åhs, Fredrikson, Sollers Iii, & Wager, 2012; Wager et al., 2005).
Beyond adding nuance to the debate concerning the directionality of the relationships between CVC and health and risky behavior, the present findings also open avenues for future research. If low CVC shares genetic liability with elevated triglycerides and propensity for risky health behaviors, what are the intermediary phenotypes (a.k.a. endophenotypes) that mediate the effects of genes on complex phenotypes? As an example of one potential approach to answering this question, researchers could investigate gene expression data. For example, in light of mutual associations between CVC, the biological stress response, and poor behavioral control, future work could assess the extent to which low CVC is related to the expression of genes which control the body’s stress and immune responses, potentially mediating genetic effects of poor physical and mental health on CVC (Cole, 2019; Cooper et al., 2015; Lyons, Lopez, Yang, & Schatzberg, 2000; Schwaiger et al., 2016; Sorrells & Sapolsky, 2007; Thayer & Sternberg, 2006). By documenting shared genetic liability between low CVC and physical and behavioral health, the present findings contribute to a better understanding of the interplay between CVC and health, guiding future research to fully explicate how CVC participates in a regulated body and mind.
Supplementary Material
Figure 1: Scatterplots & Marginal Histograms of Zero-Order Associations Between CVC and Polygenic Scores for Elevated Triglycerides (A), and Risky Health Behaviors (B).
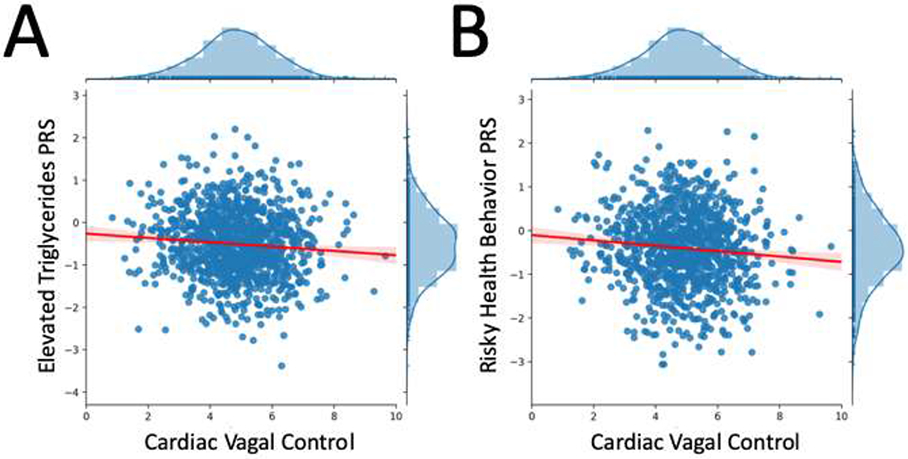
Note: Panel A displays cardiac vagal control (CVC) alongside the polygenic score for elevated triglycerides, whereas Panel B displays cardiac vagal control (CVC) alongside the polygenic score for risky health behaviors, a composite PRS reflecting automobile speeding propensity, number of sexual partners, frequent drinking, and history of regular smoking. Each figure is accompanied by a linear trend line with a 95% confidence interval, as well as marginal distributions for the variables labeled on the x and y axes.
Highlights.
Cardiac vagal control (CVC) shows robust associations with health, but the mechanisms are not fully understood.
We test whether CVC and poor health are in pleiotropy, sharing common genetic liability.
We report evidence from a nationally-representative sample of adults in the United States that polygenic risk for elevated triglycerides and poor behavioral control predict low CVC.
Acknowledgements
The MIDUS study is supported by the John D. and Catherine T. MacArthur Foundation Research Network, National Institute on Aging (P01-AG020166), and the National institute on Aging (U19-AG051426). Further financial support was provided by the John Templeton Foundation, through the Genetics and Human Agency project.
Footnotes
Publisher's Disclaimer: This is a PDF file of an unedited manuscript that has been accepted for publication. As a service to our customers we are providing this early version of the manuscript. The manuscript will undergo copyediting, typesetting, and review of the resulting proof before it is published in its final form. Please note that during the production process errors may be discovered which could affect the content, and all legal disclaimers that apply to the journal pertain.
. Data Availability
Data analyzed in this manuscript are archival data not directly under our control; requests to access the data should be directed to ICPSR at the University of Michigan. Our analysis scripts are publicly available at https://osf.io/hz6qw/.
Competing Interests
The authors declare no competing interests
Data from n = 315,894 participants from the UK Biobank and TAG Consortium were used to conduct the GWAS for smoking; n = 404,291 and n = 370,711 participants from the UK Biobank were used to conduct the GWASs for speeding and number of sexual partners, respectively; n = 939,908 participants from the UK Biobank and 23andMe were used to conduct the GWAS for risky health behavior).
References
- Amodio DM, Master SL, Yee CM, & Taylor SE (2008). Neurocognitive components of the behavioral inhibition and activation systems: implications for theories of self-regulation. Psychophysiology, 45(1), 11–19. doi: 10.1111/j.1469-8986.2007.00609.x [DOI] [PubMed] [Google Scholar]
- Appelhans BM, & Luecken LJ (2006). Heart Rate Variability as an Index of Regulated Emotional Responding. Review of General Psychology, 10(3), 229–240. doi: 10.1037/1089-2680.10.3.229 [DOI] [Google Scholar]
- Beauchaine TP (2015). Respiratory Sinus Arrhythmia: A Transdiagnostic Biomarker of Emotion Dysregulation and Psychopathology. Curr Opin Psychol, 3, 43–47. doi: 10.1016/j.copsyc.2015.01.017 [DOI] [PMC free article] [PubMed] [Google Scholar]
- Benjamini Y, & Hochberg Y (1995). Controlling the false discovery rate: a practical and powerful approach to multiple testing. Journal of Royal Statistical Society, Series B, 57(1), 289–300. [Google Scholar]
- Chang CC, Chow CC, Tellier LCAM, Vattikuti S, Purcell SM, & Lee JJ (2015). Second-generation PLINK: rising to the challenge of larger and richer datasets. Gigascience, 4(1), 7. [DOI] [PMC free article] [PubMed] [Google Scholar]
- Cole SW (2019). The conserved transcriptional response to adversity. Current Opinion in Behavioral Sciences, 28, 31–37. [DOI] [PMC free article] [PubMed] [Google Scholar]
- Cooper TM, McKinley PS, Seeman TE, Choo TH, Lee S, & Sloan RP (2015). Heart rate variability predicts levels of inflammatory markers: Evidence for the vagal anti-inflammatory pathway. Brain, Behavior, and Immunity, 49, 94–100. doi: 10.1016/j.bbi.2014.12.017 [DOI] [PMC free article] [PubMed] [Google Scholar]
- Das S, Forer L, Schönherr S, Sidore C, Locke AE, Kwong A, … McGue M (2016). Next-generation genotype imputation service and methods. Nature Genetics, 48(10), 1284. [DOI] [PMC free article] [PubMed] [Google Scholar]
- Duncan LE, Ratanatharathorn A, Aiello AE, Almli LM, Amstadter AB, Ashley-Koch AE, … Bisson J (2018). Largest GWAS of PTSD (N= 20 070) yields genetic overlap with schizophrenia and sex differences in heritability. Molecular Psychiatry, 23(3), 666. [DOI] [PMC free article] [PubMed] [Google Scholar]
- Euesden J, Lewis CM, & O’Reilly PF (2014). PRSice: polygenic risk score software. Bioinformatics, 31(9), 1466–1468. [DOI] [PMC free article] [PubMed] [Google Scholar]
- Genetics IOCDF, Arnold PD, Askland KD, Barlassina C, Bellodi L, Bienvenu OJ, … Burton CL (2018). Revealing the complex genetic architecture of obsessive–compulsive disorder using meta-analysis. Molecular Psychiatry, 23(5), 1181. [DOI] [PMC free article] [PubMed] [Google Scholar]
- Gidron Y, Deschepper R, De Couck M, Thayer JF, & Velkeniers B (2018). The Vagus Nerve Can Predict and Possibly Modulate Non-Communicable Chronic Diseases: Introducing a Neuroimmunological Paradigm to Public Health. J Clin Med, 7(10). doi: 10.3390/jcm7100371 [DOI] [PMC free article] [PubMed] [Google Scholar]
- Hallquist MN, & Wiley JF (2018). MplusAutomation: An R Package for Facilitating Large-Scale Latent Variable Analyses in M plus. Structural equation modeling: a multidisciplinary journal, 25(4), 621–638. [DOI] [PMC free article] [PubMed] [Google Scholar]
- Heathers JA, Brown NJ, Coyne JC, & Friedman HL (2015). The Elusory Upward Spiral: A Reanalysis of Kok et al. (2013). Psychological Science, 26(7), 1140–1143. doi: 10.1177/0956797615572908 [DOI] [PubMed] [Google Scholar]
- Holzman JB, & Bridgett DJ (2017). Heart rate variability indices as bio-markers of top-down self-regulatory mechanisms: A meta-analytic review. In. [DOI] [PubMed]
- Laborde S, Mosley E, & Thayer JF (2017). Heart Rate Variability and Cardiac Vagal Tone in Psychophysiological Research - Recommendations for Experiment Planning, Data Analysis, and Data Reporting. Frontiers in Psychology, 8(FEB), 213. doi: 10.3389/fpsyg.2017.00213 [DOI] [PMC free article] [PubMed] [Google Scholar]
- Linnér RK, Biroli P, Kong E, Meddens SFW, Wedow R, Fontana MA, …Hammerschlag AR (2019). Genome-wide association analyses of risk tolerance and risky behaviors in over 1 million individuals identify hundreds of loci and shared genetic influences. Nature Genetics, 51(2), 245. [DOI] [PMC free article] [PubMed] [Google Scholar]
- Loh P-R, Danecek P, Palamara PF, Fuchsberger C, Reshef YA, Finucane HK, … Abecasis GR (2016). Reference-based phasing using the Haplotype Reference Consortium panel. Nature Genetics, 48(11), 1443. [DOI] [PMC free article] [PubMed] [Google Scholar]
- Lyons DM, Lopez JM, Yang C, & Schatzberg AF (2000). Stress-level cortisol treatment impairs inhibitory control of behavior in monkeys. Journal of Neuroscience, 20(20), 7816–7821. [DOI] [PMC free article] [PubMed] [Google Scholar]
- Mann FD, Shabalin AA, Docherty AR, & Krueger RF (2019). Genetic liability in the study of Midlife in the United States (MIDUS): Predictive, convergent, and discriminant validity of polygenic scores. under review.
- Muthén LK, Muthén BO, Muthén LK, & Muthén BO (2017). Mplus User’s Guide.
- Okbay A, Baselmans BML, De Neve J-E, Turley P, Nivard MG, Fontana MA, … Derringer J (2016). Genetic variants associated with subjective well-being, depressive symptoms, and neuroticism identified through genome-wide analyses. Nature Genetics, 48(6), 624. [DOI] [PMC free article] [PubMed] [Google Scholar]
- Otowa T, Hek K, Lee M, Byrne EM, Mirza SS, Nivard MG, … Wolen A (2016). Meta-analysis of genome-wide association studies of anxiety disorders. Molecular Psychiatry, 21(10), 1391. [DOI] [PMC free article] [PubMed] [Google Scholar]
- Ryff CD, & Krueger RF (2018). The Oxford Handbook of Integrative Health Science: Oxford University Press. [Google Scholar]
- Schunkert H, König IR, Kathiresan S, Reilly MP, Assimes TL, Holm H, … Gieger C (2011). Large-scale association analysis identifies 13 new susceptibility loci for coronary artery disease. Nature Genetics, 43(4), 333. [DOI] [PMC free article] [PubMed] [Google Scholar]
- Schwaiger M, Grinberg M, Moser D, Zang JCS, Heinrichs M, Hengstler JG, … Kumsta R (2016). Altered stress-induced regulation of genes in monocytes in adults with a history of childhood adversity. Neuropsychopharmacology, 41(10), 2530–2540. [DOI] [PMC free article] [PubMed] [Google Scholar]
- Sellaro R, de Gelder B, Finisguerra A, & Colzato LS (2018). Transcutaneous vagus nerve stimulation (tVNS) enhances recognition of emotions in faces but not bodies. Cortex, 99, 213–223. doi: 10.1016/j.cortex.2017.11.007 [DOI] [PubMed] [Google Scholar]
- Sorrells SF, & Sapolsky RM (2007). An inflammatory review of glucocorticoid actions in the CNS. Brain, Behavior, and Immunity, 21(3), 259–272. [DOI] [PMC free article] [PubMed] [Google Scholar]
- Su S, Lampert R, Zhao J, Bremner JD, Miller A, Snieder H, … Vaccarino V (2009). Pleiotropy of C-reactive protein gene polymorphisms with C-reactive protein levels and heart rate variability in healthy male twins. American Journal of Cardiology, 104(12), 1748–1754. doi: 10.1016/j.amjcard.2009.07.063 [DOI] [PMC free article] [PubMed] [Google Scholar]
- Teslovich TM, Musunuru K, Smith AV, Edmondson AC, Stylianou IM, Koseki M, … Willer CJ (2010). Biological, clinical and population relevance of 95 loci for blood lipids. Nature, 466(7307), 707. [DOI] [PMC free article] [PubMed] [Google Scholar]
- Thayer JF, Åhs F, Fredrikson M, Sollers Iii JJ, & Wager TD (2012). A meta-analysis of heart rate variability and neuroimaging studies: implications for heart rate variability as a marker of stress and health. Neuroscience & Biobehavioral Reviews, 36(2), 747–756. [DOI] [PubMed] [Google Scholar]
- Thayer JF, & Lane RD (2000). A model of neurovisceral integration in emotion regulation and dysregulation. Journal of Affective Disorders, 61(3), 201–216. doi: 10.1016/S0165-0327(00)00338-4 [DOI] [PubMed] [Google Scholar]
- Thayer JF, & Sternberg E (2006). Beyond heart rate variability: vagal regulation of allostatic systems. Annals of the New York Academy of Sciences, 1088(1), 361–372. [DOI] [PubMed] [Google Scholar]
- Thayer JF, Yamamoto SS, & Brosschot JF (2010). The relationship of autonomic imbalance, heart rate variability and cardiovascular disease risk factors. International Journal of Cardiology, 141(2), 122–131. [DOI] [PubMed] [Google Scholar]
- van den Berg SM, de Moor MHM, Verweij KJH, Krueger RF, Luciano M, Vasquez AA, … Gordon SD (2016). Meta-analysis of genome-wide association studies for extraversion: Findings from the genetics of personality consortium. Behavior Genetics, 46(2), 170–182. [DOI] [PMC free article] [PubMed] [Google Scholar]
- Wager TD, Sylvester C-YC, Lacey SC, Nee DE, Franklin M, & Jonides J (2005). Common and unique components of response inhibition revealed by fMRI. NeuroImage, 27(2), 323–340. doi: 10.1016/j.neuroimage.2005.01.054 [DOI] [PubMed] [Google Scholar]
- Wheat AL, & Larkin KT (2010). Biofeedback of heart rate variability and related physiology: A critical review. Applied Psychophysiology and Biofeedback, 35(3), 229–242. [DOI] [PubMed] [Google Scholar]
- Wray NR, Ripke S, Mattheisen M, Trzaskowski M, Byrne EM, Abdellaoui A, … Andlauer TMF (2018). Genome-wide association analyses identify 44 risk variants and refine the genetic architecture of major depression. Nature Genetics, 50(5), 668. [DOI] [PMC free article] [PubMed] [Google Scholar]
Associated Data
This section collects any data citations, data availability statements, or supplementary materials included in this article.