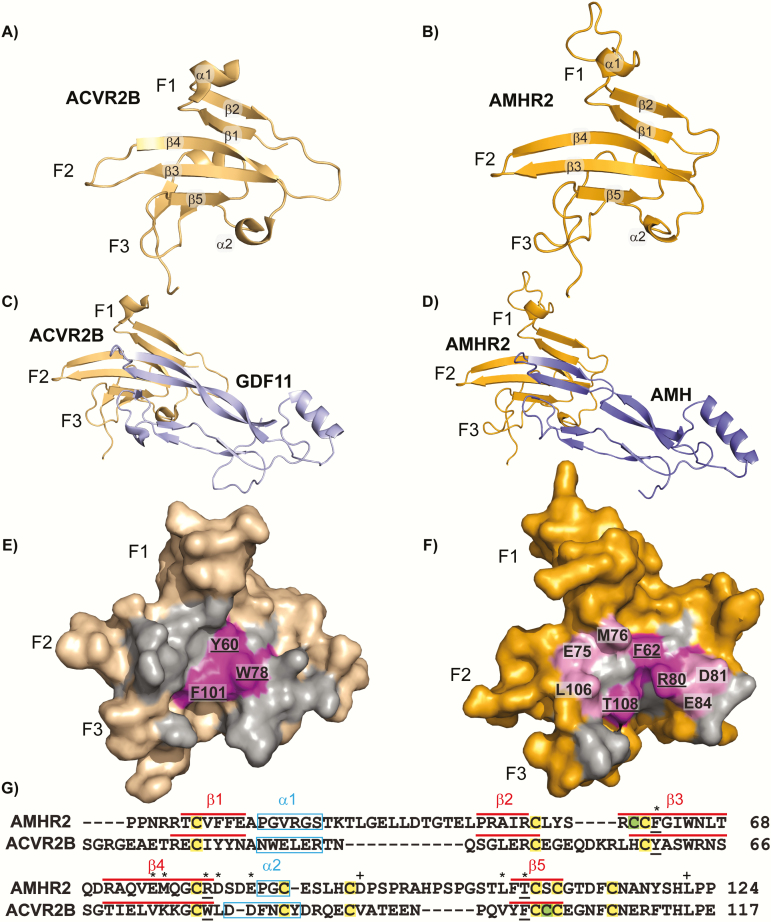
Figure 2.
Model and sequence alignments of ACVR2B and AMHR2. (A) Structure of ACVR2B-ECD (wheat) in cartoon representation. (B) Swiss-MODEL of AMHR2-ECD (orange) in cartoon representation. Secondary structure elements are labeled accordingly (α-alpha helix, β-beta sheet). (C) Structure of ACVR2B-ECD (wheat) and GDF11 mature (pale blue) in complex from ternary complex (PDBID:6MAC) in cartoon representation. (D) Swiss-MODEL of AMHR2-ECD residues 21–126 (orange) and AMH mature residues 458 through 560 (blue) in complex and in cartoon representation. (E) Surface representation of ACVR2B-ECD and (F) AMHR2-ECD model with all residues within 5Å of the respective ligand highlighted in gray and residues matching the hydrophobic triad of ACVR2B residues in magenta, labeled with underline. Residues used in experiments are highlighted light pink and labeled. Fingers 1, 2, and 3, of the receptors are labeled as F1, F2, and F3, respectively. (G) Sequence alignment of AMHR2 and ACVR2B with residue number indicated to right. Residues used for mutational analysis are labeled with an asterisk. Residues used as controls for mutational analysis are labeled with a plus sign. Residues underlined are part of the hydrophobic triad. Predicted secondary structure is denoted (α-helix in light blue box, β-sheet in red line). Conserved cysteines (C) are highlighted yellow, whereas unique cysteines are highlighted green.

