Abstract
Crosstalk between deregulated hepatocyte metabolism and cells within the tumour microenvironment, and consequent effects on liver tumourigenesis, are incompletely understood. We show here that hepatocyte-specific loss of the gluconeogenic enzyme fructose 1,6-bisphosphatase 1 (FBP1) disrupts liver metabolic homeostasis and promotes tumour progression. FBP1 is universally silenced in both human and murine liver tumours. Hepatocyte-specific Fbp1 deletion results in steatosis, concomitant with activation and senescence of hepatic stellate cells (HSCs), exhibiting a senescence-associated secretory phenotype (SASP). Depleting senescent HSCs by “senolytic” treatment with dasatinib/quercetin or ABT-263 inhibits tumour progression. We further demonstrate that FBP1-deficient hepatocytes promote HSC activation by releasing HMGB1; blocking its release with the small molecule inflachromene limits FBP1-dependent HSC activation, subsequent SASP development, and tumour progression. Collectively, these findings provide genetic evidence for FBP1 as a metabolic tumour suppressor in liver cancer and establish a critical crosstalk between hepatocyte metabolism and HSC senescence that promotes tumour growth.
Hepatocellular carcinoma (HCC) remains a leading cause of cancer-related mortality worldwide1. Considerable heterogeneity in HCC’s mutational landscape2 makes targeted therapies less broadly effective, and recent studies have focused instead on potentially targeting the liver tumour microenvironment (TME), including fibrosis and chronic inflammation3, 4. Hepatic fibrosis contributes to more than 80% of HCC and results from activation and transdifferentiation of quiescent hepatic stellate cells (HSCs)5, 6. Similarly, various immune cell subsets have been identified as key factors for HCC progression4, 7–9. Non-alcoholic fatty liver disease (NAFLD), caused by aberrant liver metabolism and lipid accumulation, has also emerged as an important predisposing factor for HCC10–12. Overall, the crosstalk between deregulated hepatocyte metabolism and stromal cells within the HCC TME remains to be fully elucidated.
The rate-limiting gluconeogenic enzyme FBP1 has been increasingly implicated as a tumour suppressor. FBP1 antagonizes glycolysis through its cytosolic catalytic activity13, 14, while nuclear FBP1 directly interacts with hypoxia inducible factors (HIFs) in clear cell renal carcinoma (ccRCC), inhibiting their transcriptional activity independent of its enzymatic properties15. Despite extensive in vitro studies, robust genetic evidence for FBP1 as a tumour suppressor has been lacking. In contrast to frequent von Hippel-Lindau (VHL) genetic alterations resulting in HIF stabilization in ccRCC, pVHL loss is rare in HCC2; moreover, FBP1 expression and tissue hypoxia are largely confined to different hepatic zones16. Therefore, FBP1 loss may function at least partly though HIF-independent mechanisms in hepatocarcinogenesis.
Here, we describe a conditional Fbp1 genetic mouse model, and uncover a previously unrecognized mechanism in which FBP1 loss and subsequent hepatic metabolic deregulation promote liver cancer through an HSC senescence secretome. We also provide proof-of-principle that targeting senescence in HCC’s TME has potential as a promising liver cancer therapy.
Results
FBP1 expression is lost during liver tumour progression
Through a metabolic gene set analysis of The Cancer Genome Atlas (TCGA) RNA-sequencing data2, we identified the “carbohydrate storage group” as one of the most underexpressed gene sets in HCC (Extended Data Fig. 1a). Within this group, all three rate-limiting gluconeogenic genes were downregulated (Fig. 1a), with FBP1 mRNA levels significantly decreased in stage I tumours relative to normal tissues, and further reduced along disease progression (Fig. 1b). Accordingly, immunohistochemical (IHC) staining of human tissue array revealed high FBP1 protein abundance in normal human livers and lower levels in liver tumours (Fig. 1c, d and Extended Data Fig. 1b, c).
Figure 1 |. Universal FBP1 loss in human and murine liver tumours.
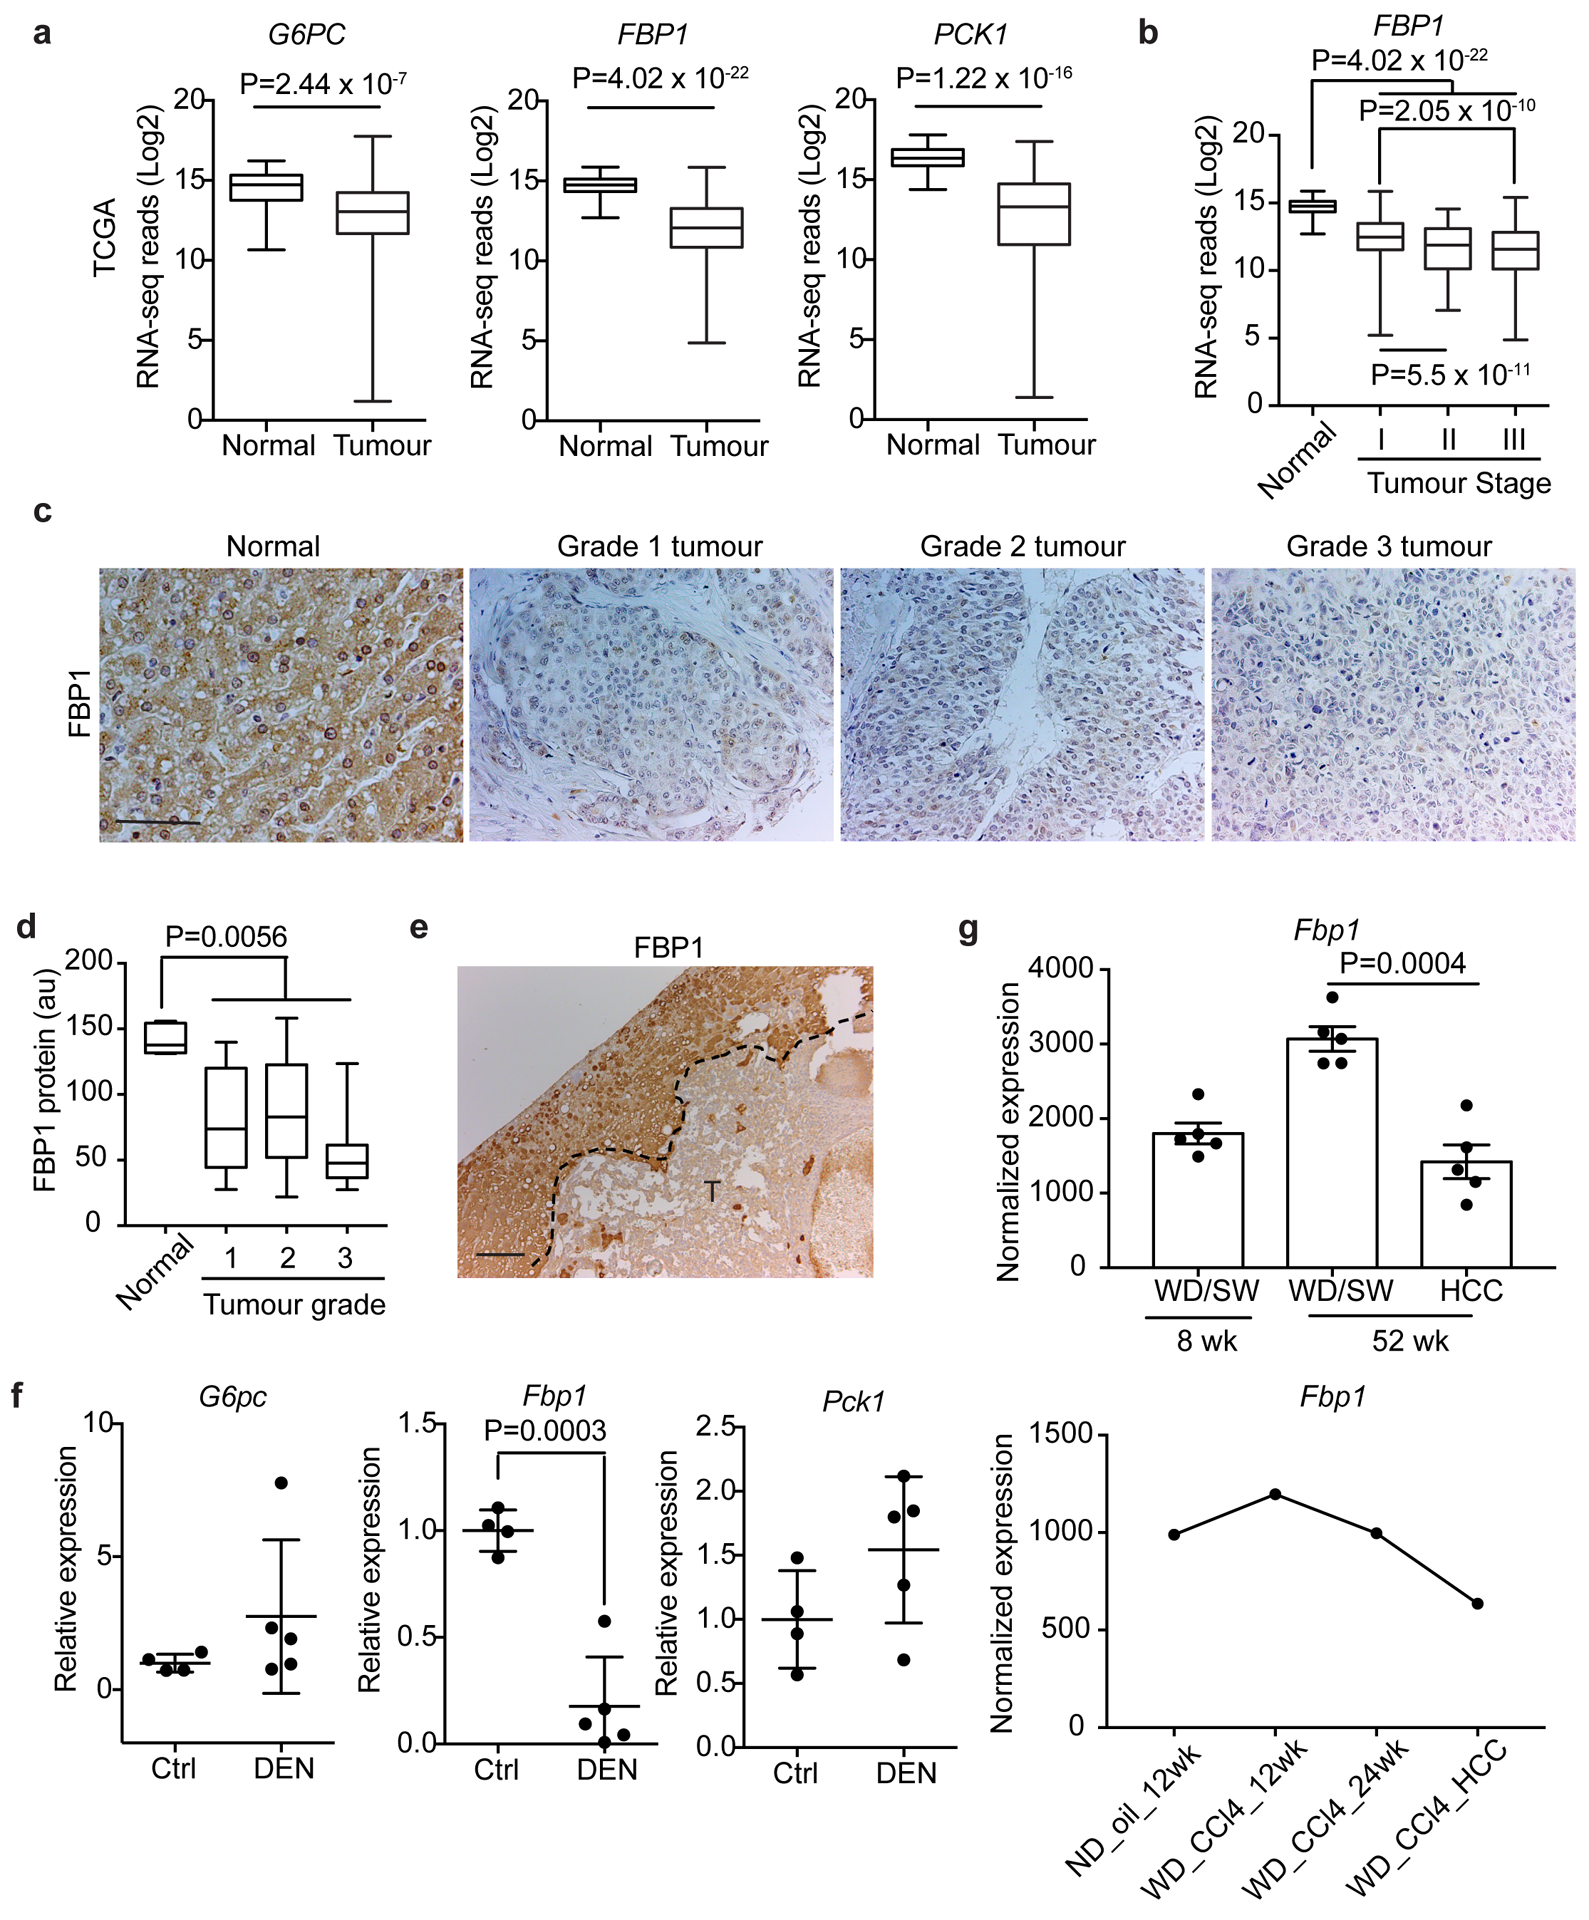
a, Box plots of gluconeogenic gene RNA-seq reads in normal liver and tumour tissues from TCGA dataset. n=50 for normal livers, n=374 for tumour samples. b, Box plots of FBP1 RNA-seq reads in normal liver and stage I-Ill tumour tissues in TCGA dataset. n=50 for normal, n=173 for stage I, n=88 for stage II, n=85 for stage III specimens. c, d, Representative IHC staining (c) and statistical analysis (d) of FBP1 protein in human liver tissue array. n=5 for normal, n=10 for grade 1, n=27 for grade 2, n=12 for grade 3 samples. Scale bar: 100 μm. e, Representative FBP1 IHC staining of 80-week p53-deficient mouse liver sections with tumours (T) (n = 3 independent experiments). Scale bar: 100 μm. f, qRT-PCR analysis of gluconeogenic gene expression in livers from 24-week control (Ctrl) (n=4) and DEN-treated (DEN) (n=5) mice. g, Fbp1 expression patterns in two datasets of murine NAFLD models. In the GSE67680 dataset (upper panel, n=5 for each group), western diet/sugar water (WD/SW)/8wk corresponds to an early non-alcoholic steatohepatitis (NASH) stage, and WD/SW/52wk corresponds to NASH/HCC stage; in the GSE99010 dataset (lower panel, n=2 for WD_CCl4_HCC, n=1 for other groups), (western diet) WD_CCL4_12wk corresponds to NASH stage, and WD_CCL4_24wk corresponds to NASH/HCC stage. “HCC” are dissected tumours from “WD_CCl4_24 wk” livers. In box plots of a, b and d, the top-most line is the maximum, the top of the box is the upper quartile, the centre line is the median, the bottom of the box is the lower quartile and the bottom-most line is the minimum. Graphs in f and g (upper panel) show mean ± SEM. Graph in g (lower panel) show mean. All P values were calculated using a two-tailed t-test. Numerical source data are provided in Statistic Source Data Fig. 1.
Fbp1 was also downregulated in liver tumours from two murine models: Trp53 flox/flox (p53) mice17, 18, in which tumours exhibited less FBP1 protein than adjacent tissues (Fig. 1e); and diethylnitrosamine (DEN)-treated mice, whose mRNA levels of Fbp1, but not G6pc or Pck1, were selectively lost in livers at 6 months (Fig. 1f), an early time point where mice exhibited only a few microscopic tumours and elevated serum alanine transaminase (ALT) activity (Extended Data Fig. 1d, e). Importantly, two datasets (GSE6768019 and GSE9901020) of murine NAFLD-HCC models consistently exhibited decreased Fbp1 expression in liver tumours relative to early non-alcoholic steatohepatitis (NASH) stage livers (Fig. 1g). Collectively, these data implicate FBP1 suppression as a common event during liver tumour progression.
Hepatic FBP1 loss disrupts liver metabolism
Exploiting a conditional Fbp1flox/flox (Fbp1) allele (Extended Data Fig. 2a), we intravenously delivered AAV8-TBG-Cre (Cre) to delete Fbp1 specifically in hepatocytes, with AAV8-TBG-GFP (GFP)-injected animals serving as controls (Extended Data Fig. 2b). Hepatic Fbp1 deletion in Cre livers was validated by decreases in both mRNA and protein levels, without consistent changes in two other gluconeogenic genes (Extended Data Fig. 2c, d). Hepatic Fbp1 deletion had no impact on the histology and gluconeogenic enzyme expression in kidney (Extended Data Fig. 2e–g). Importantly, overall gluconeogenesis was abolished in Cre animals as revealed by a pyruvate tolerance test (PTT) (Fig. 2a), whereas glucose sensitivity was unchanged during a glucose tolerance test (GTT) (Fig. 2b). Fasted Cre animals had higher serum free fatty acid (FFA) and lower ketone β-hydroxybutyrate acid (BHBA) levels (Extended Data Fig. 2h), indicating defective fatty acid oxidation (FAO). These animals also exhibited hepatomegaly (Extended Data Fig. 2i), and altered expression of genes representing de novo lipogenesis, FAO, and unfolded protein response (UPR) (Extended Data Fig. 2j, k). Despite comparable growth rates (Extended Data Fig. 2l), Cre animals exhibited mild hepatic steatosis featured by elevated triglyceride (TG) and neutral lipid accumulation by 24 weeks (Fig. 2c and Extended Data Fig. 2m, n). Transmission electron microscopy (TEM) demonstrated that endoplasmic reticulum (ER) in Cre hepatocytes displayed abnormally dilated morphology and increased apposition to mitochondria, characteristics of ER stress21 (Fig. 2d, e). We concluded that hepatic FBP1 loss disrupts lipid metabolism leading to ER stress, a phenotype also seen in NAFLD livers10, 11, 22, 23.
Figure 2 |. Hepatic FBP1 loss disrupts liver metabolism.
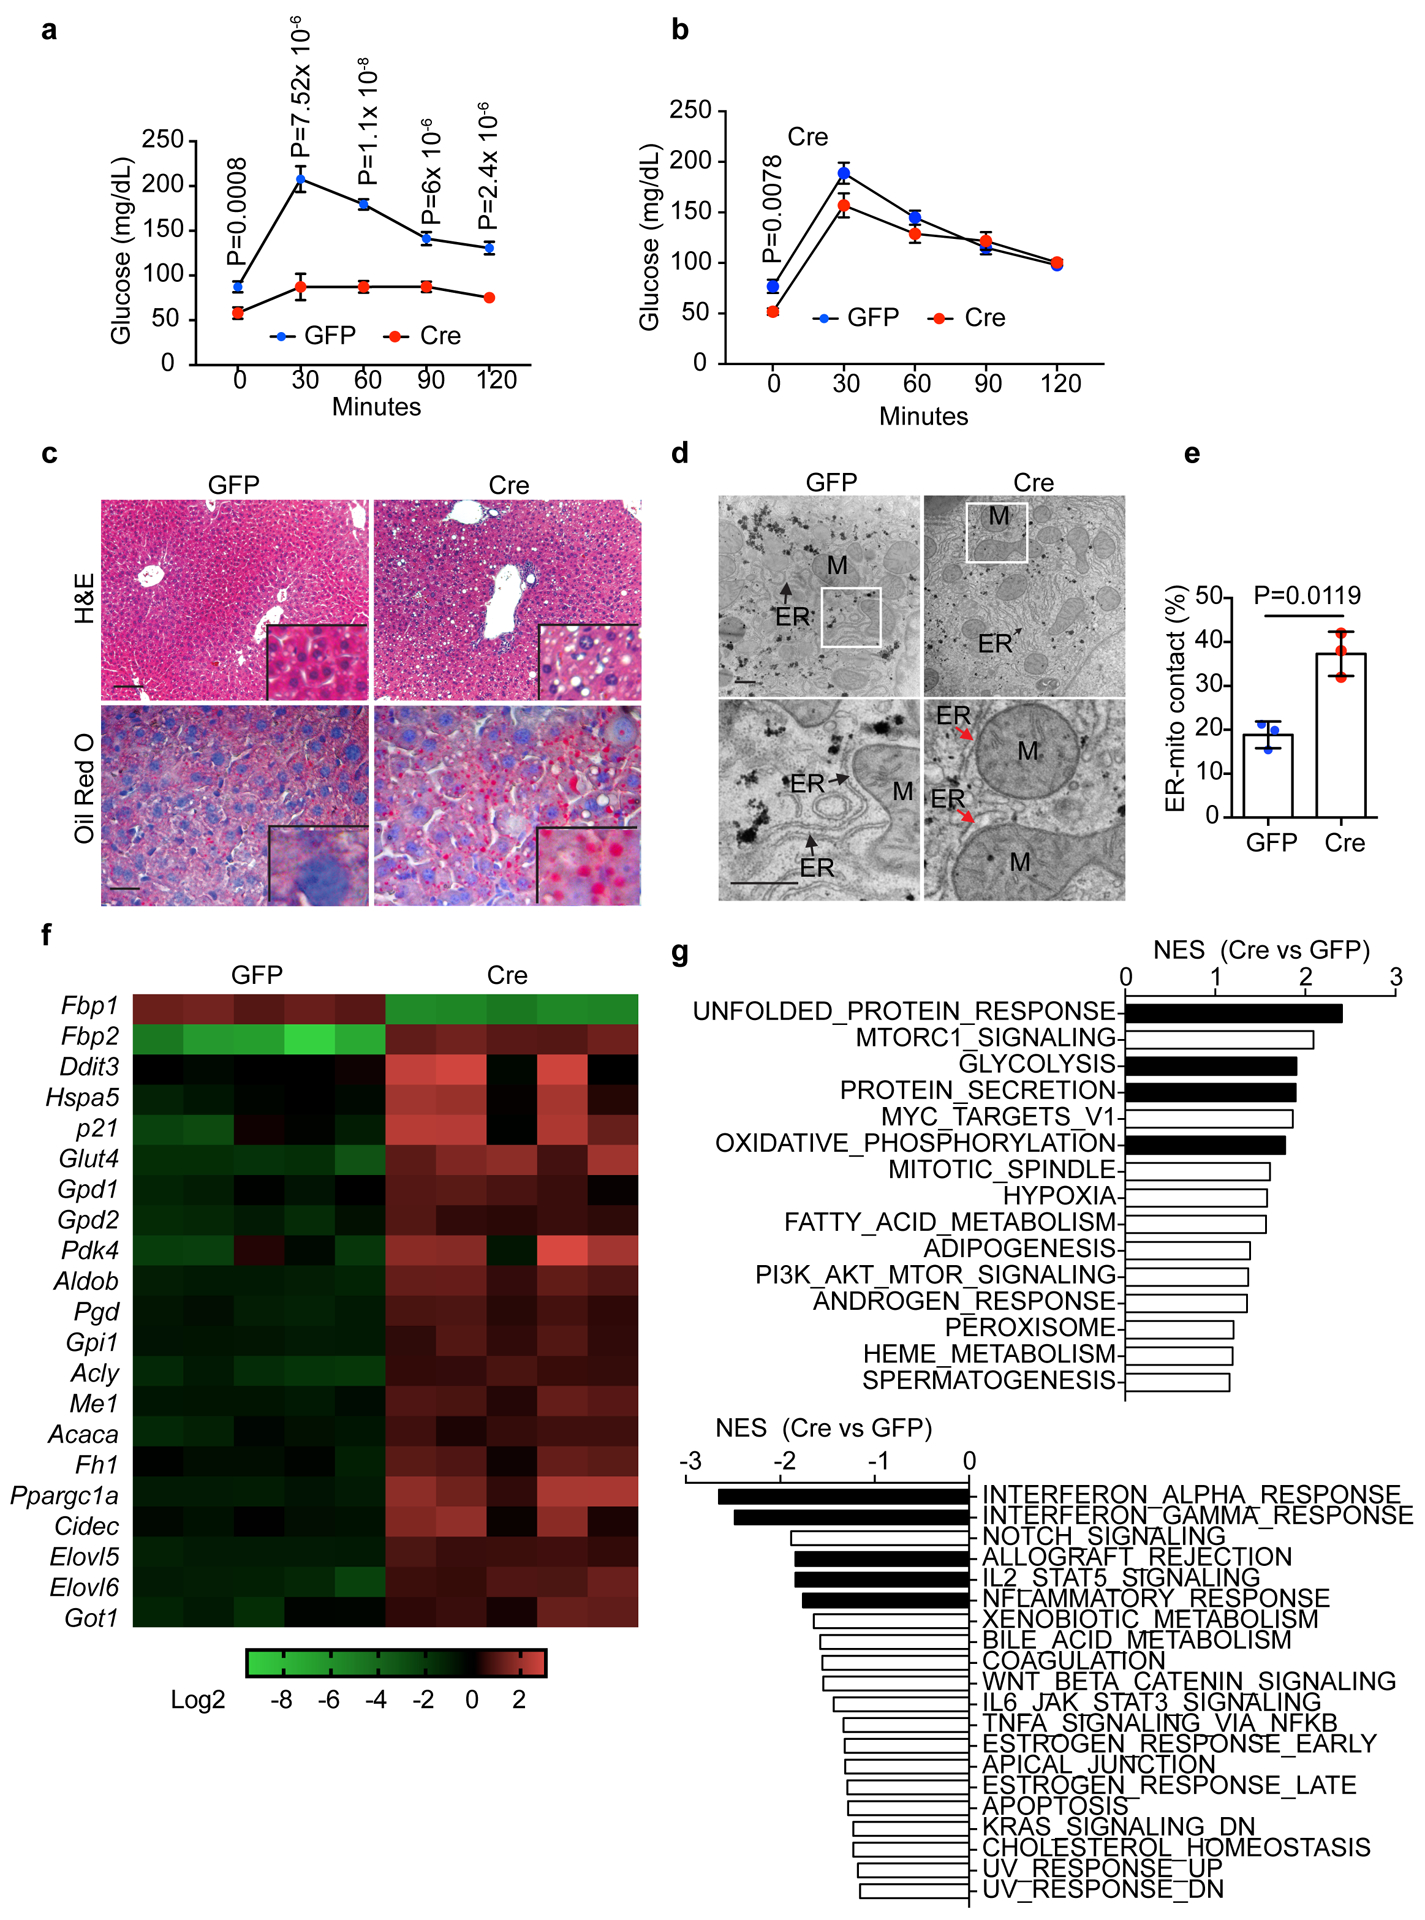
a, b, Pyruvate tolerance test (PTT) (a) and glucose tolerance test (GTT) (b) performed on 16-h fasted GFP (n=7) and Cre (n=8) mice (24-week). c, H&E and Oil Red O staining of liver sections from 24-week GFP and Cre mice (n = 3 independent experiments). Scale bar: 100 μm. d, TEM images of liver sections from 24-week GFP and Cre mice. Bottom panels are magnifications of boxed areas in top panels. M, mitochondria; ER, endoplasmic reticulum. Black arrows indicate ER. Red arrow indicates dilated ER adjacent to mitochondria. Scale bar: 500 nm. e, Quantitation of ER length adjacent to mitochondria (Mito) normalized by total ER length. n=3 mice for each group. f, heatmap of indicated gene expression change from RNA-seq of 24-week GFP (n=5) and Cre (n=5) livers. g, Summary of normalized enrichment score (NES) from GSEA (hallmark gene sets) of RNA-seq dataset. Graphs in a, b and e show mean ± SEM, and P values were calculated using a two-tailed t-test. Numerical source data are provided in Statistic Source Data Fig. 2.
Global transcriptomic profiling by RNA-sequencing uncovered 892 genes with >2-fold change (adjusted p<0.01) between 24-week GFP and Cre livers, including upregulated gene signatures of ER stress, glycolysis, oxidative phosphorylation and lipid metabolism (Fig. 2f). Gene set enrichment analysis (GSEA) further identified top ranked gene sets of UPR, glycolysis, protein secretion and oxidative phosphorylation in Cre livers, and several inflammation-related pathways in the GFP group (Fig. 2g). Altogether, hepatic FBP1 loss disrupts liver metabolic homeostasis and results in mild NAFLD-like features in mice.
FBP1 loss accelerates liver tumour progression in mice
We initially determined the effect of hepatic Fbp1 deletion on liver tumourigenesis using the well-established DEN model, in which tumours develop from “Zone 3” hepatocytes expressing CYP2E124, 25 (an enzyme for DEN metabolism) (Extended Data Fig. 3a). As early as 24 weeks, DEN-treated Cre animals (DEN/Cre) exhibited a higher tumour burden than control (DEN/GFP) mice, based on increased surface tumour numbers (Fig. 3a, b), higher liver-to-body weight (LW/BW) ratios (Fig. 3c), larger and more numerous microscopic lesions with steatosis (Fig. 3d, e), and higher serum ALT activity (Fig. 3f). Although no HCC was observed at this stage, DEN/Cre tumours displayed increased cell proliferation (Fig. 3g, h), and expression of a liver cancer gene signature was elevated in DEN/Cre livers (Fig. 3i). Remarkably, periportal fibrosis was apparent in DEN/Cre but not DEN/GFP livers, as revealed by collagen deposition (Fig. 3j, k). As expected, significantly higher tumour burden was observed in DEN/Cre mice at 36 weeks (Fig. 3l), when all DEN/Cre animals harbored at least one HCC, but no HCC was observed in DEN/GFP animals.
Figure 3 |. Hepatic FBP1 loss promotes DEN-induced liver tumour progression in mice.
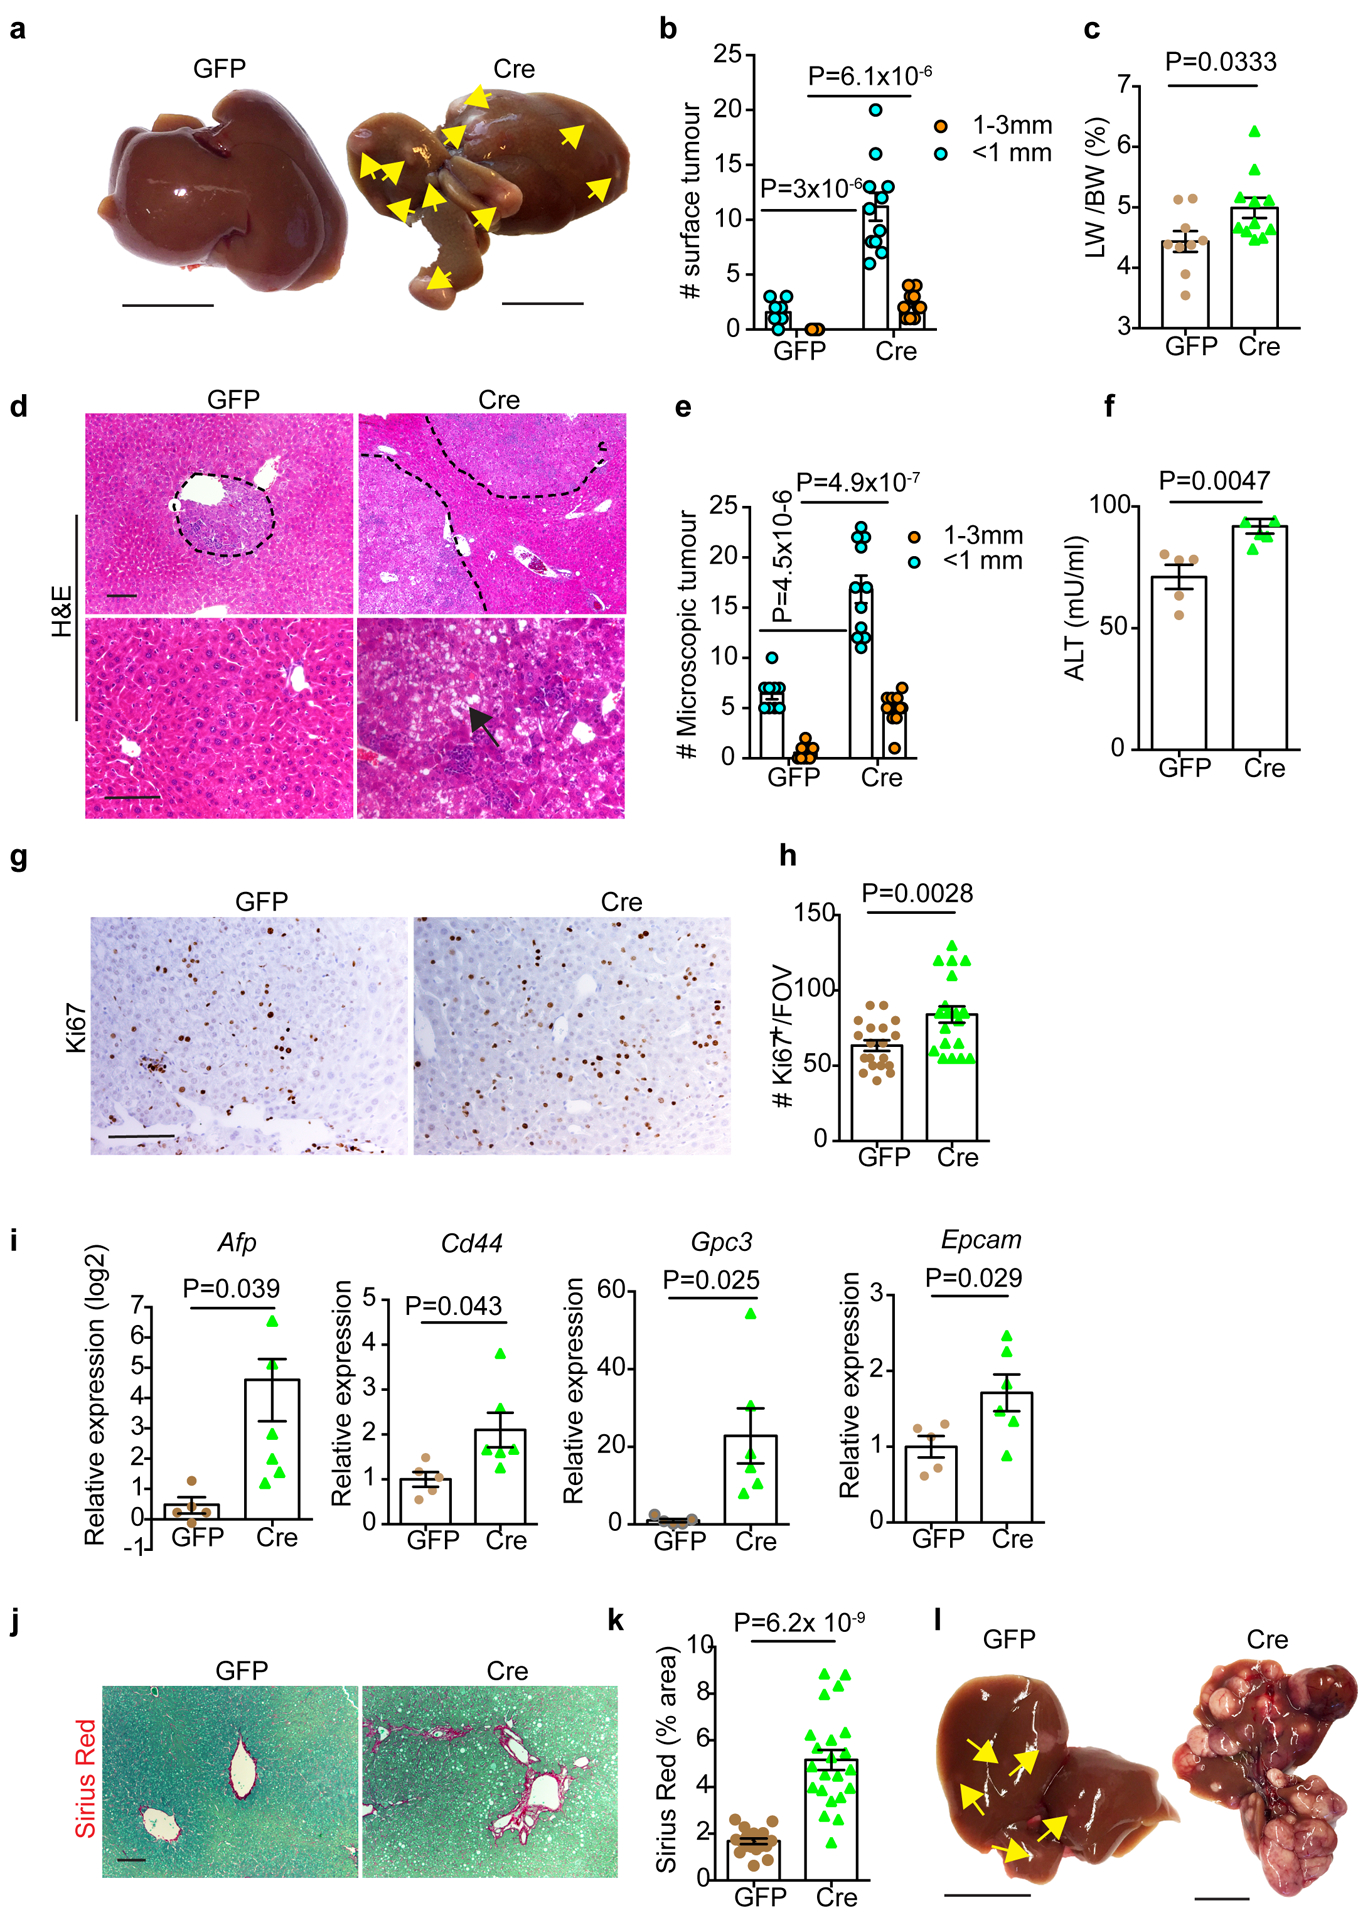
a, Gross appearance of livers and tumour multiplicity in 24-week DEN mice. Yellow arrows indicate liver tumours. Scale bar: 1 cm. b, c, Quantification of surface tumour number and size distributions (b) and Liver-to-body weight (LW/BW) radios (c) in 24-week DEN mouse cohorts. n=9 mice for GFP, n=11 mice for Cre. d, H&E staining of 24-week DEN mouse liver sections. Black arrow indicates a steatotic tumour. Scale bar: 100 μm. e, Quantification of microscopic tumour number and size distributions in 24-week DEN mouse liver sections. n=9 mice for GFP, n=11 mice for Cre. f, Serum ALT quantification in 24-week DEN mice. n=5 mice for GFP, n=6 mice for Cre. g, h, Representative Ki67 IHC staining (g) and quantification (h) of 24-week DEN liver tumours. n=20 FOV for GFP, n=22 FOV for Cre. FOV: 200x field of view. Scale bar: 100 μm. i, qRT-PCR analysis of a liver cancer gene signature in 24-week DEN livers. n=5 mice for GFP, n=6 mice for Cre. j, k, Sirius Red staining (j) and quantification (% area) (k) of 24-week DEN mouse liver sections. n=18 FOV for GFP, n=22 FOV for Cre. FOV: 100x field of view. Scale bar: 100 μm. l, Gross appearance of livers and tumour multiplicity (indicated by yellow arrows) from 36-week DEN mouse cohorts (n=3 independent experiments). Scale bar: 1 cm. Graphs in b, c, e, f, h, i and k show mean ± SEM, and P values were calculated using a two-tailed t-test. Numerical source data are provided in Statistic Source Data Fig. 3.
We then compared liver tumour burden between p53 and p53/Fbp1 mice treated by AAV-TBG-Cre. Consistent with hepatic p53 depletion promoting cholangiocytic tumours with long latency17, surface tumours were observed in all (7/7) p53/Fbp1 and 4/7 p53 mice at 80 weeks, where p53/Fbp1 livers exhibited more surface tumours (Extended Data Fig. 3b, c). Tumours from both cohorts were pathologically confirmed as intrahepatic cholangiocarcinoma, and fibrosis was only identified in p53/Fbp1 animals, as validated by alpha smooth muscle actin (α-SMA) IHC staining (Extended Data Fig. 3d).
We further studied the effects of Fbp1 deletion on NAFLD-associated liver tumourigenesis using a diet- and CCl4-induced murine NAFLD-HCC model that exhibits progressive steatohepatitis, fibrosis and liver cancer20. After 24 weeks, FBP1-deficient mice exhibited increased incidence and numbers of surface tumours (Extended Data Fig. 3e, f), elevated LW/BW ratios (Extended Data Fig. 3g), and increased liver weights (Extended Data Fig. 3h). Both cohorts of mice had comparable body weights (Extended Data Fig. 3i), suggesting that FBP1 loss doesn’t affect weight gain in this regimen. Consistent with elevated lipogenic and fibrotic gene expression (Extended Data Fig. 3j, k), more dramatic steatosis and fibrosis was also histologically detected in FBP1-deficient livers (Extended Data Fig. 3l).
Altogether, data from three distinct murine models indicate that hepatic FBP1 loss promotes primary liver tumour progression.
FBP1 loss elicits senescence and SASP in HSCs
FBP1 and other gluconeogenic enzymes are mainly expressed by “Zone 1” hepatocytes16, and FBP1 loss didn’t change CYP2E1’s expression pattern normally restricted to “Zone 3” (Extended Data Fig. 4a), raising a potential crosstalk mechanism for tumour promotion in the DEN model. Although different immune cell types can regulate context-dependent liver tumourigenesis4, 7–9, flow cytometry-based immune profiling uncovered few quantitative differences in hepatic T cell subsets between 24-week DEN/GFP and DEN/Cre animals (Extended Data Fig. 4b). No quantitative differences were noted in B cell numbers and B cell subsets (Extended Data Fig. 4c). Livers from both cohorts exhibited comparable numbers of total macrophages, and CD11b+ or CD206+ subsets (Extended Data Fig. 4d). In contrast, activated NK cell populations (CD3−NKp46+) were decreased in DEN/Cre livers (Extended Data Fig. 4e, f), further confirmed by NKp46 IHC staining (Extended Data Fig. 4g, h). Moreover, CD11b+ cells and CD11b+Ly6C+ populations comprising immature myeloid cells or myeloid derived suppressor cells (MDSC) were also reduced (Extended Data Fig. 4i, j). Interestingly, lipidomic profiling revealed higher levels of total ceramide and individual ceramide species in in DEN/Cre livers comparing to DEN/GFP counterparts (Extended Data Fig. 4k). The potential contribution of ceramide to NK cell and MDSC activity, and functional effects on tumour progression will be discussed below. Together, hepatic FBP1 loss may accelerate tumour progression through mechanisms involving limited perturbations of immune cell numbers at 24 weeks, an early time point in the DEN model24.
The remarkable appearance of liver fibrosis in DEN/Cre animals implies a potential contribution of HSCs to tumour promotion. During liver fibrosis, activated HSCs progressively undergo senescence, becoming less fibrogenic but more proinflammatory due to a senescence-associated secretory phenotype (SASP)26–28. Through senescence-associated beta-galactosidase (SA-β-Gal) staining, we detected significant numbers of SA-β-Gal+ cells in DEN/Cre livers, specifically in peritumour areas where cells express CD140B, a canonical HSC marker29, were located (Fig. 4a). Peritumour expression of p21 and FOXO4, two additional senescence markers26, 30, was also observed (Fig. 4b). Importantly, SA-β-Gal+ cells colocalized with those positive for α-SMA (an activated HSC maker), and IL6 (prominent SASP component) (Extended Data Fig. 5a), and significant percentage of α-SMA+ HSCs also expressed the DNA damage marker γ-H2AX (Fig. 4c, d), collectively supporting the presence of senescent HSCs. As DEN is not usually fibrogenic in mice22, 24, we surmised that FBP1 deficiency in and of itself promotes HSC activation and senescence. Indeed, liver fibrosis was also detected in non-DEN treated Cre livers, together with a population of α-SMA+ and Ki67+/α-SMA+ HSCs (Extended Data Fig. 5b). Furthermore, SA-β-Gal+ cells accumulated in Cre livers (Extended Data Fig. 5c), as did activated HSCs expressing γ-H2AX (Extended Data Fig. 5d), and SASP components like IL6, GRO-α (CXCL1) and CXCL927, 31 (Fig. 4e, f). Notably, α-SMA+ HSCs were the dominant cell population displaying a SASP in Cre livers (Extended Data Fig. 5e). We concluded that hepatic FBP1 loss triggers HSC activation, subsequent senescence and ultimately a SASP.
Figure 4 |. Hepatic FBP1 loss elicits senescence and SASP in HSCs.
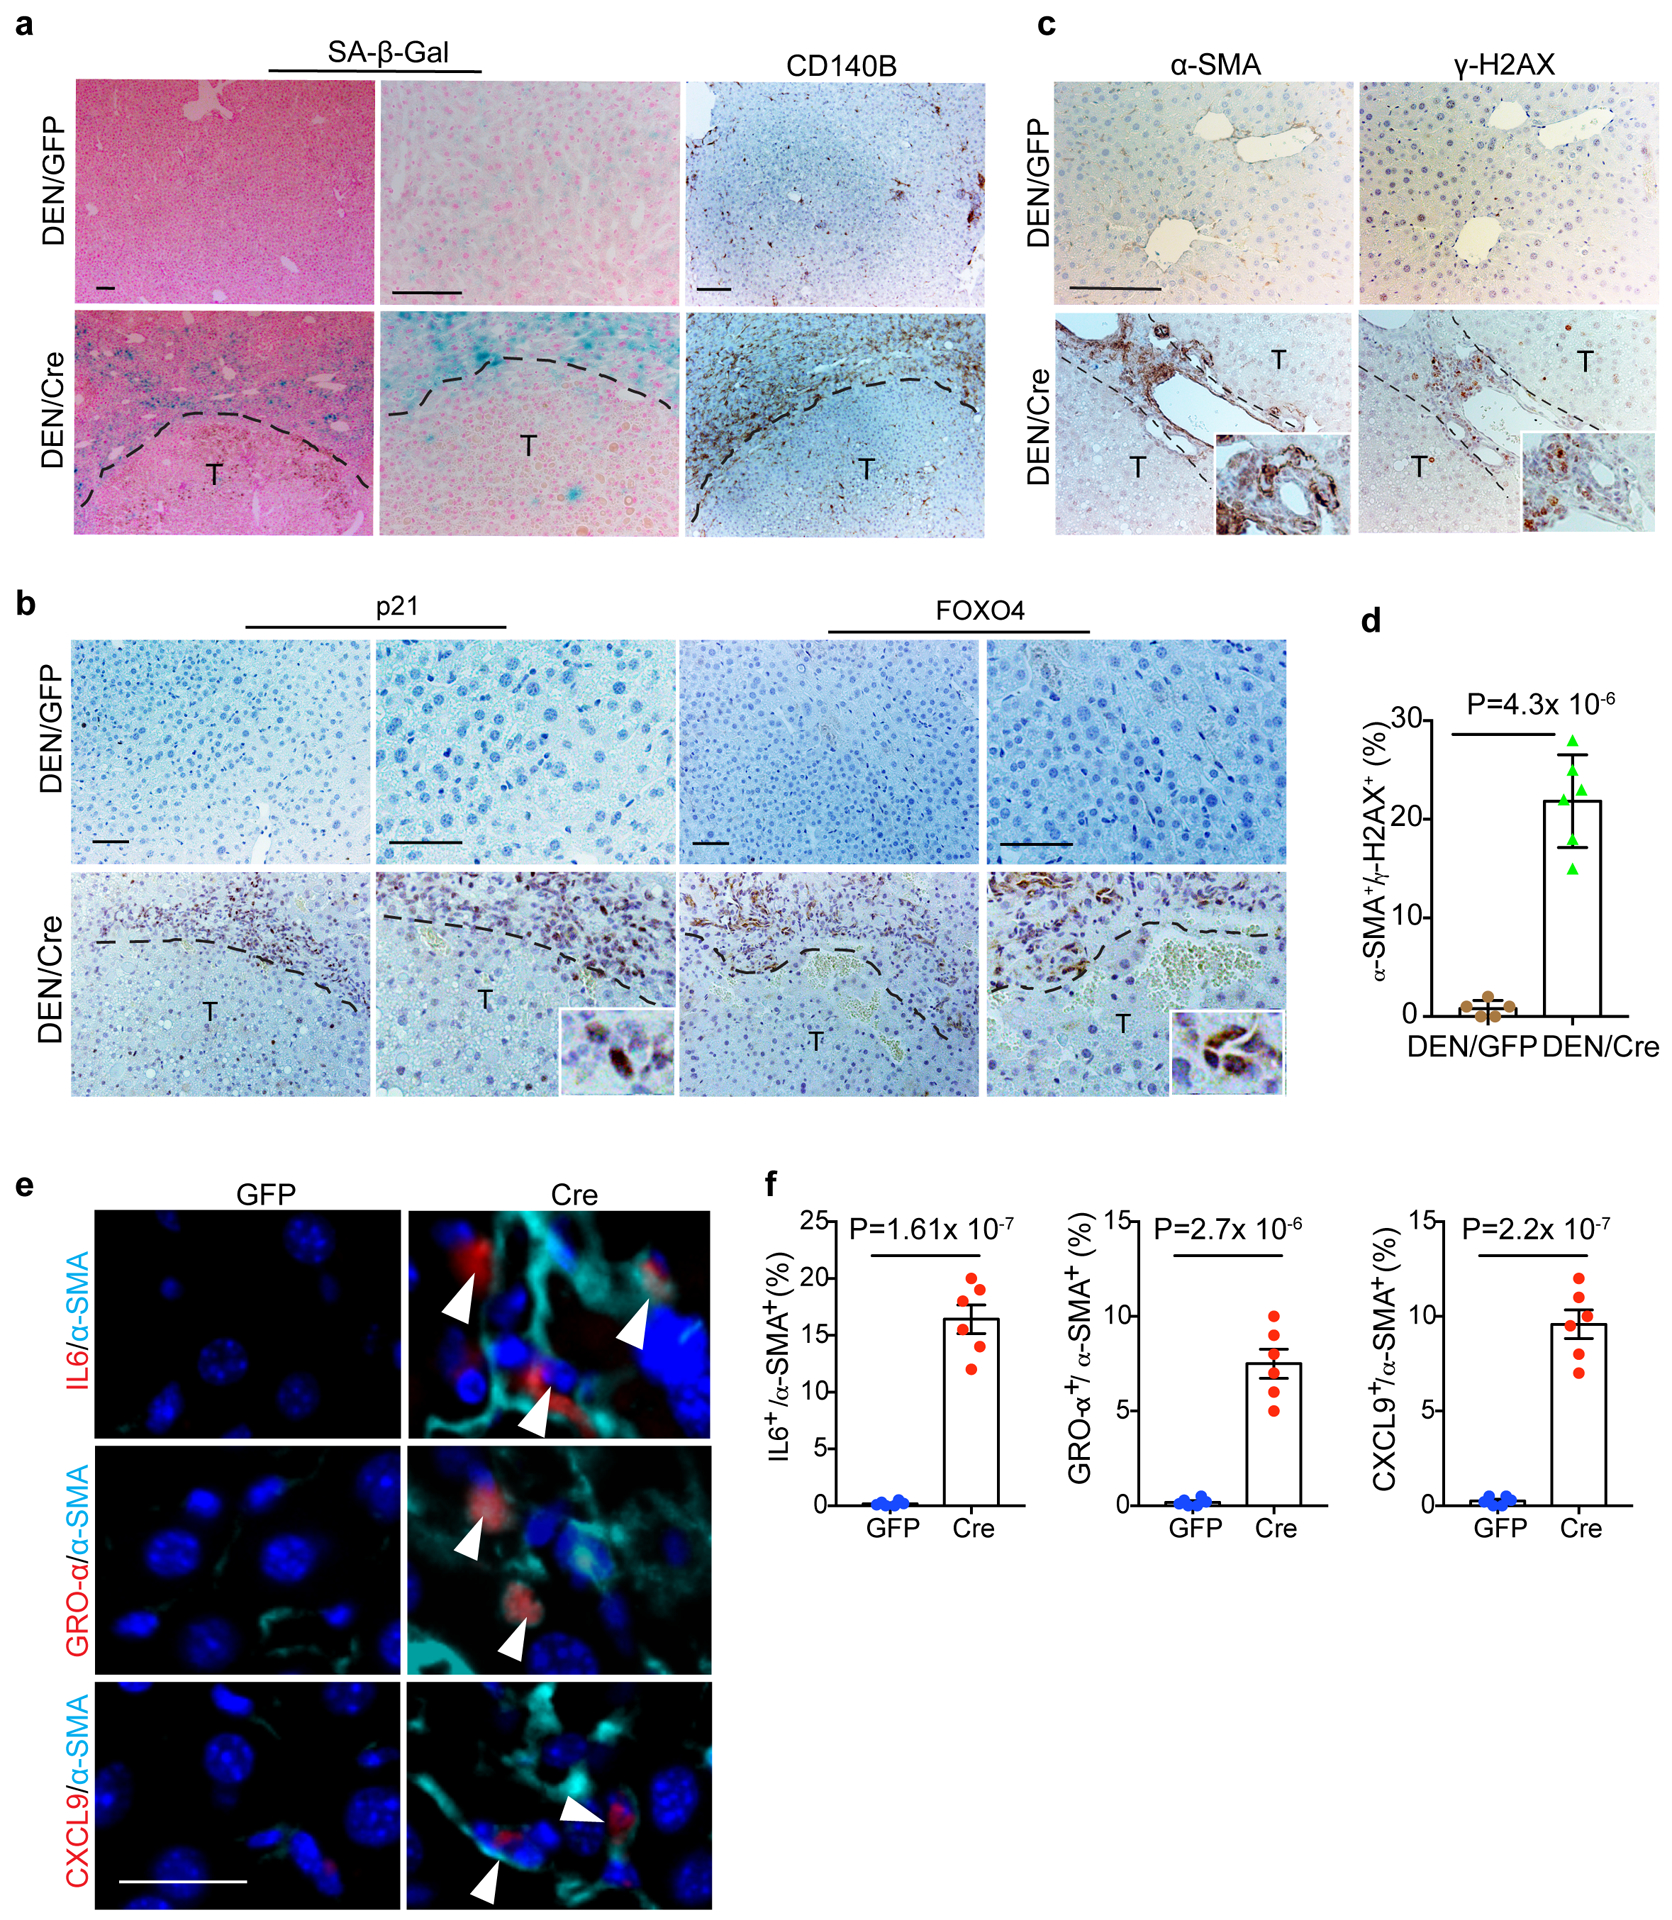
a, Representative SA-β-Gal staining, CD140B IHC staining of cryosections from 36-week mouse liver sections (n=4 independent experiments with similar results). T: tumour. Scale bar: 100 μm. b, Representative p21 and FOXO4 IHC staining of 36-week mouse liver sections (n=3 independent experiments). T: Tumour. Scale bar: 100 μm. c, d, Representative α-SMA and γ-H2AX IHC staining (c) and quantification (% of α-SMA+) (d) of 36-week mouse liver sections. n=6 mice for each group. T: tumour. Scale bar: 100 μm. e, f, Representative IF staining (e) of IL6+/α-SMA+, GRO-α+/α-SMA+ and CXCL9+/α-SMA+ cells and quantification (% of α-SMA+) (f) in 24-week non-DEN GFP (n=6) and Cre (n=6) mouse liver sections. White arrowheads indicate cells with double positive staining. Scale bar: 50 μm. Graphs in d an f show mean ± SEM, and P values were calculated using a two-tailed t-test. Numerical source data are provided in Statistic Source Data Fig. 4.
Senescent HSCs promote liver tumour growth
To determine if HSC senescence facilitates liver tumourigenesis in FBP1-deficient livers, we treated human HSCs with the DNA damage agent etoposide to induce senescence26. Compared to growing (GRO) cells, etoposide-treated senescent (SEN) HSCs exhibited robust SA-β-Gal positivity (Fig. 5a, b), cellular growth arrest (Fig. 5c, Extended Data Fig. 6a), and expression of a broad spectrum of SASP genes (Fig. 5d). Similarly, etoposide-treated primary mouse HSCs increasingly secreted multiple SASP proteins including pro-tumorigenic IL6 and CXCL1 (Fig. 5e)31. Functionally, conditioned medium (CM) from SEN HSCs enhanced human HCC cell growth, as revealed in proliferation and clonogenicity assays of PLC/PRF/5 (PLC) cells (Fig. 5f–h). Accordingly, CM from etoposide -treated mouse HSCs promoted growth of D37 cells, a primary HCC cell line from the DEN model (Extended Data Fig. 6b). Most importantly, co-injected SEN HSCs dramatically accelerated PLC xenograft tumour growth compared to GRO HSCs (Fig. 5i). Together, an HSC senescence secretome promotes murine and human HCC progression.
Figure 5 |. Senescent HSCs promote HCC growth in vitro and in vivo.
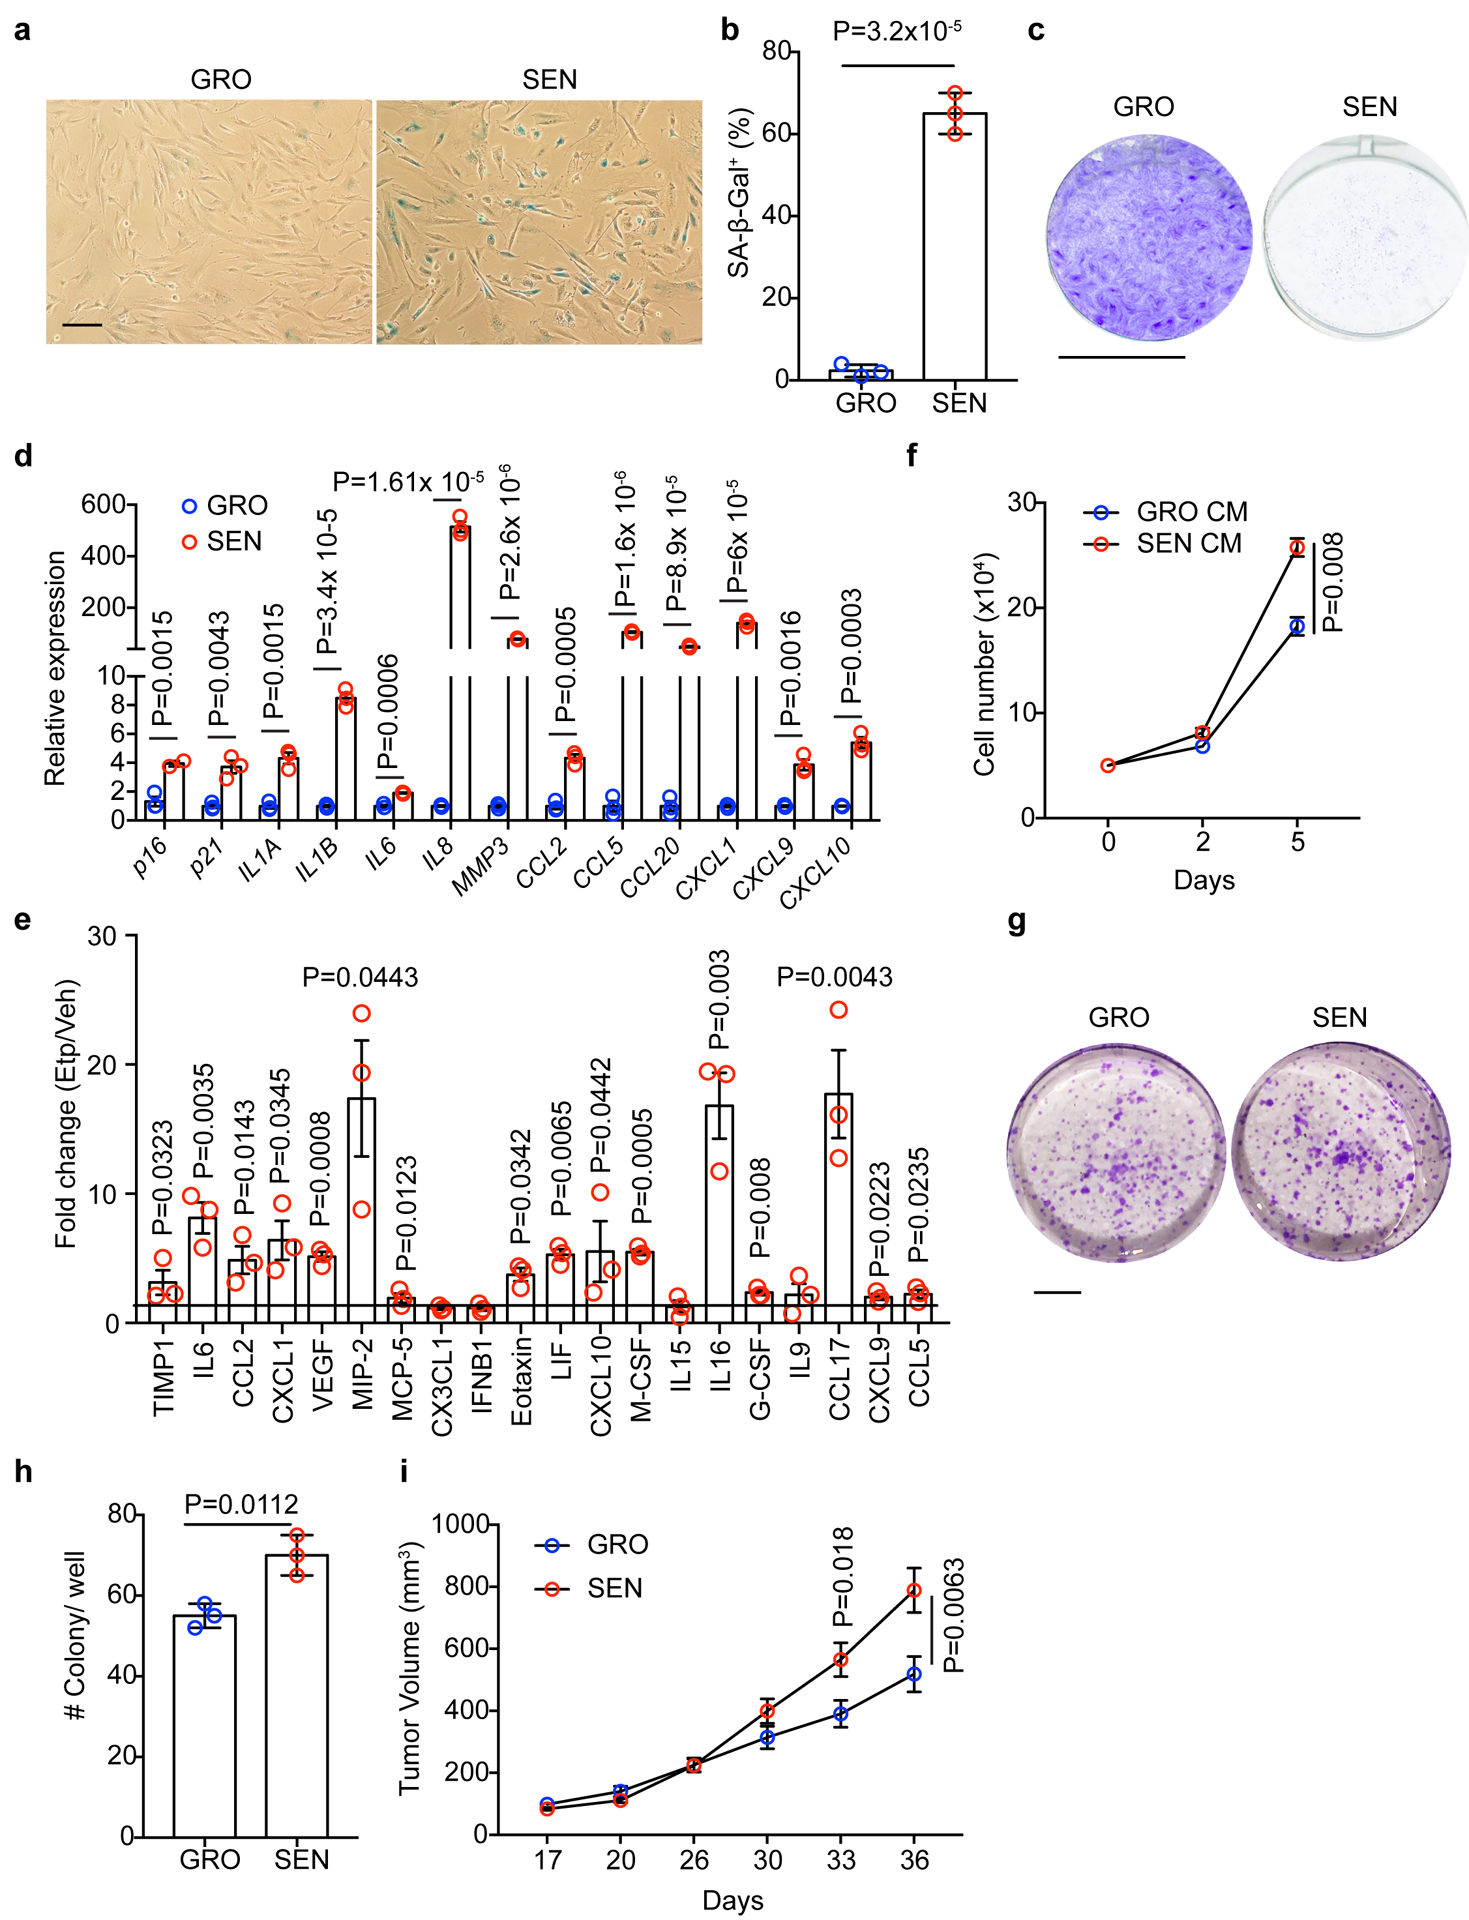
a, b, SA-β-Gal staining (a) and quantification (% of cells) (b) of GRO and SEN human HSCs (n = 3 independent experiments). Scale bar: 100 μm. c, Proliferation assay for GRO and SEN HSC cells (n = 3 independent experiments). Scale bar: 1 cm. d, Gene expression by qRT-PCR analysis of GRO and SEN human HSCs (n = 3 independent experiments). e, Cytokine array of conditioned medium (CM) from vehicle (Veh) control and etoposide (Etp)-treated mouse HSCs. The abundance of individual protein of Etp groups was normalized to that of Veh group and expressed as fold change. n=3 for each group. f, In vitro cell proliferation assay for human PLC HCC cells cultured in CM from GRO or SEN human HSCs (n = 3 independent experiments). g, h, Clonogenicity assay (g) and quantification (h) of PLC HCC cells in CM from GRO or SEN human HSCs (n = 3 independent experiments). Scale bar: 1 cm. i, Xenograft tumor growth assay with PLC cells and co-injected GRO or SEN human HSCs. n=15 tumours in each group. Graphs in b, d, e, f, h and i show mean ± SEM, and P values were calculated using a two-tailed t-test. Numerical source data are provided in Statistic Source Data Fig. 5.
Treatment with “senolytics” blunts tumour progression driven by FBP1 loss
Senescent cells can be selectively targeted by “senolytics”, including dasatinib and quercetin (D+Q)32–35, ABT-263 (Navitoclax)36, 37. Given the contribution of an HSC SASP to HCC growth, we determined whether “senolytic” elimination of senescent HSCs dampens FBP1-dependent tumour promotion. To this end, D+Q and ABT-263 were initially characterized for their effects on human HSCs in vitro. D+Q induced apoptosis in a dose-dependent manner only in SEN HSCs, while causing a modest decrease in GRO HSC viability at high doses through a non-apoptotic mechanism (Extended Data Fig. 6c). ABT-263 also dose-dependently induced apoptosis in SEN rather than GRO HSCs (Extended Data Fig. 6d). Consistent with the notion that expression of MCL1 (another anti-apoptotic protein) can mediate resistance to ABT-26338, AZD5991, a potent and selective MCL1 inhibitor, synergized with ABT-263 to induce apoptosis in both GRO and SEN HSCs (Extended Data Fig. 6e). In D37 cells, neither D+Q nor ABT-263 increased apoptosis, and D+Q slightly decreased the viability at higher doses (Extended Data Fig. 6f, g). Therefore, D+Q and ABT-263 exhibit selective toxicity towards senescent HSCs, and MCL1 expression may affect ABT-263’s efficacy.
DEN/GFP or DEN/Cre mice were subsequently treated with D+Q as previously described33, 34 (Extended Data Fig. 7a). Intermittent D+Q treatment suppressed liver tumour progression in DEN/Cre mice, based on reduced surface tumour numbers compared to control vehicle treatment (Veh) (Fig. 6a, b). Accordingly, LW/BW ratios were decreased (Extended Data Fig. 7b), with no impact on body weight (Extended Data Fig. 7c). D+Q-treated livers exhibited fewer and smaller microscopic lesions (Fig. 6c), and also had fewer HSCs expressing SASP components (Fig. 6d, e). Importantly, D+Q neither improved hepatic steatosis (Extended Data Fig. 7d), nor ameliorated liver fibrosis (Fig. 6f and Extended Data Fig. 7e, f). TUNEL staining further revealed increased apoptosis preferentially in peritumour areas after D+Q treatment (Fig. 6g and Extended Data Fig. 7g), collectively excluding effects on hepatocytes, activated HSCs and tumour cells.
Figure 6|. Senolytic treatment limits HSC SASP and tumour progression driven by FBP1 loss.
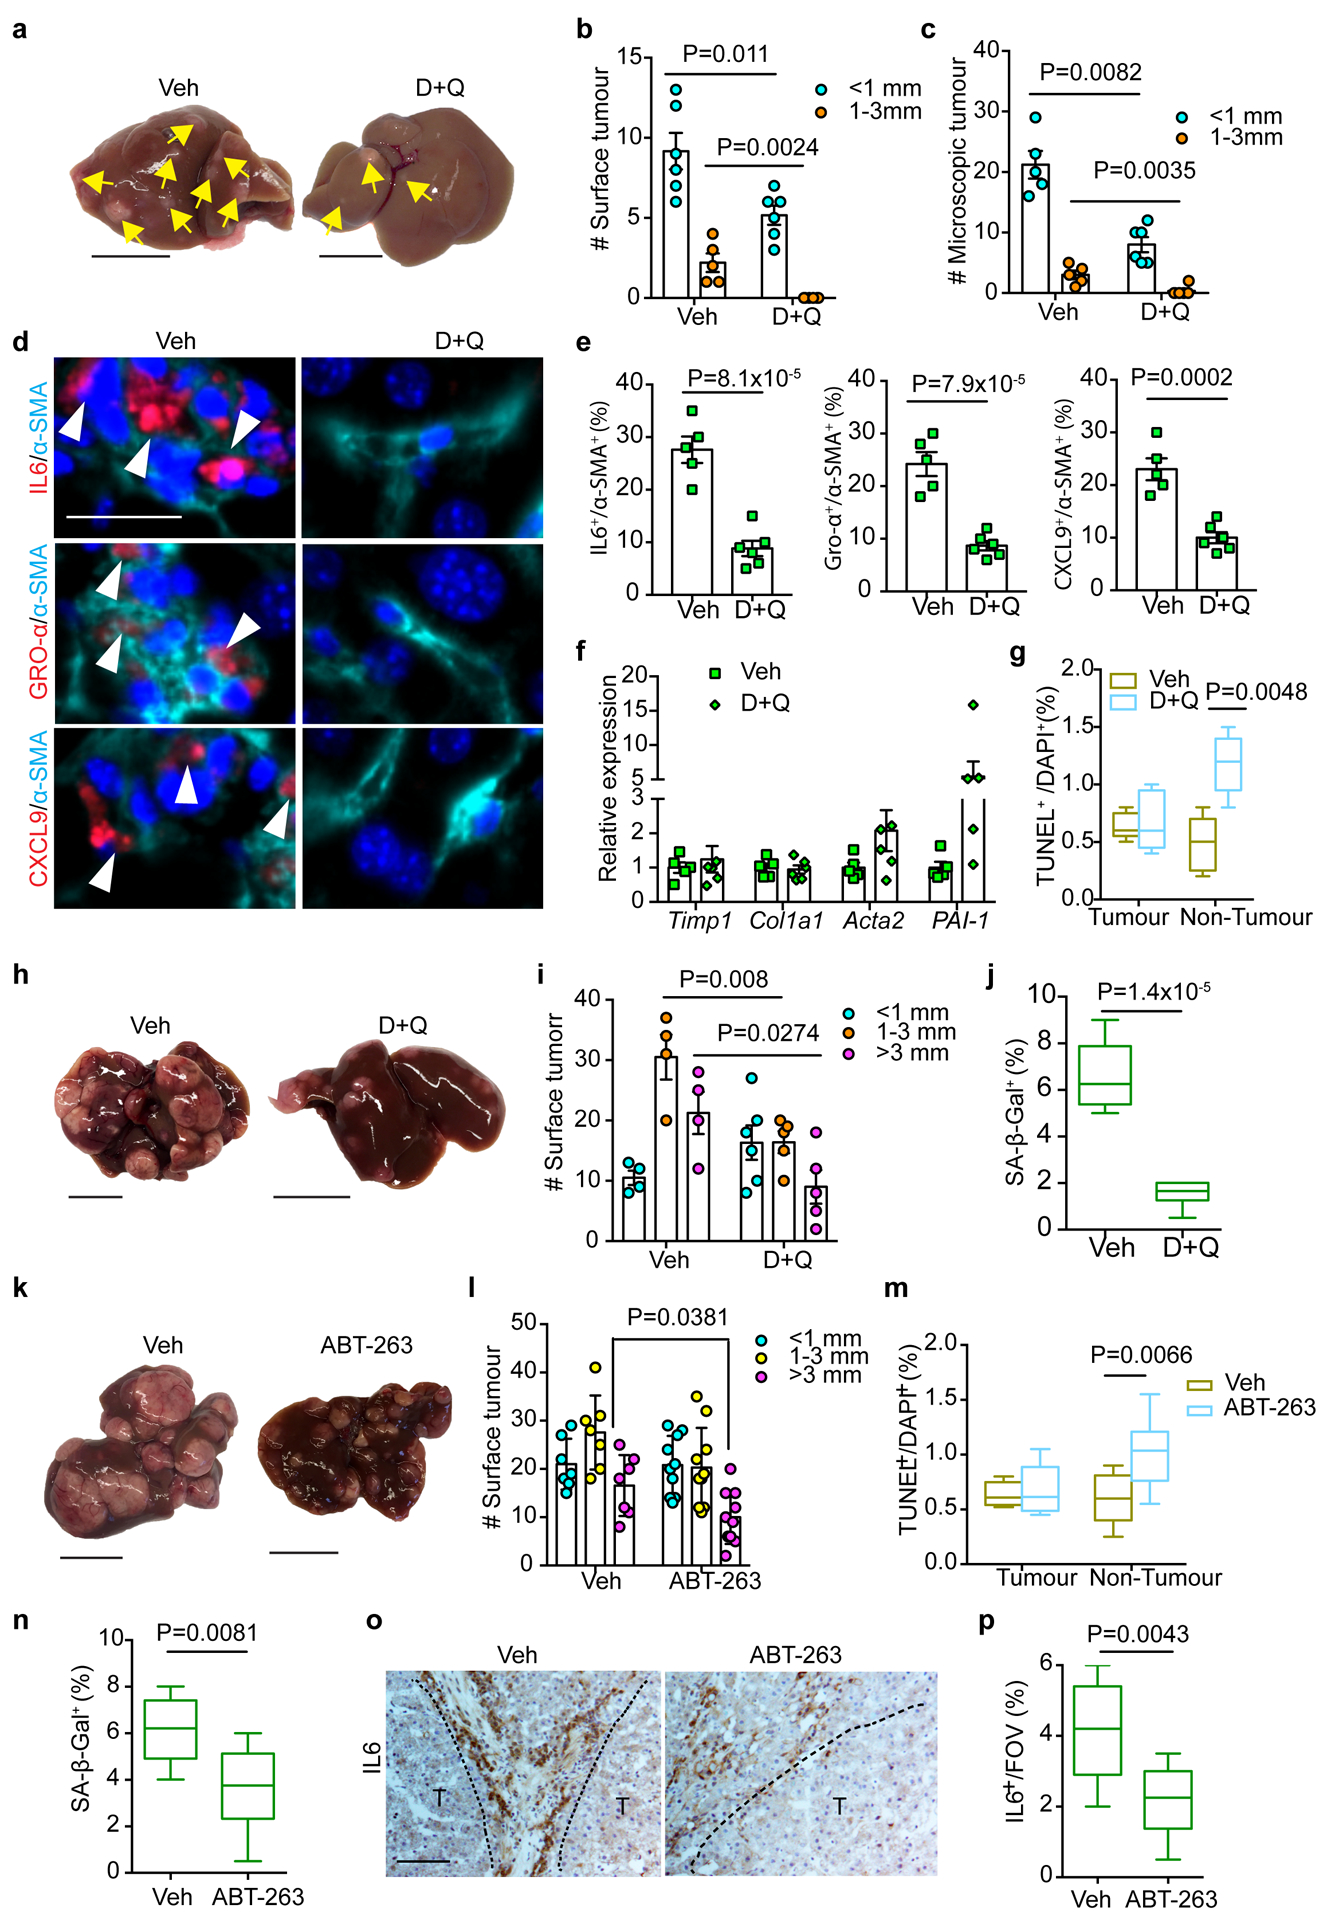
a, Gross liver appearance and tumour multiplicity (indicated by yellow arrows) in 24-week Veh and D+Q DEN/Cre cohorts. Scale bar: 1 cm. b, c, Surface (b) and microscopic (c) tumour number and size distributions in 24-week Veh (n=5) and D+Q (n=6) DEN/Cre cohorts. d, e, IF staining (d) and quantification (e) of IL6+/α-SMA+, GRO-α+/α-SMA+ and CXCL9+/α-SMA+ cells in 24-week Veh (n=5) and D+Q (n=6) DEN/Cre mouse liver sections. Scale bar: 50 μm. f, qRT-PCR analysis of fibrotic gene expression from 24-week Veh (n=5) and D+Q (n=5) DEN/Cre mouse livers. g, Quantification of TUNEL staining from 24-week Veh (n=5) and D+Q (n=6) DEN/Cre liver sections. h, Gross liver appearances and tumour multiplicity in 36-week Veh and D+Q DEN/Cre mice. Scale bar: 1 cm. i, Surface tumour number and size distributions in 36-week Veh (n=4) and D+Q (n=5) DEN/Cre cohorts. j, Quantification of SA-β-Gal staining of 36-week Veh (n=4) and D+Q (n=5) DEN/Cre mouse liver sections. k, Gross liver appearances and tumour multiplicity in 36-week Veh and ABT-263 DEN/Cre cohorts. Scale bar: 1 cm. l, Surface tumour number and size distributions in 36-week Veh (n=7) and ABT-263 (n=10) DEN/Cre mice. m, Quantification of TUNEL staining from 36-week Veh (n=7) and ABT-263 (n=10) DEN/Cre mouse liver sections. n, SA-β-Gal staining quantification of 36-week Veh (n=7) and ABT-263 (n=10) DEN/Cre mouse liver sections. o, p, Representative IL6 IHC staining (o) and quantification (p) of 36-week Veh (n=7) and ABT-263 (n=10) mouse liver sections. T, tumour. Scale bar: 100 μm. In box plots of g, j, m, n and p, the top-most line is the maximum, the top of the box is the upper quartile, the centre line is the median, the bottom of the box is the lower quartile and the bottom-most line is the minimum. Graphs in b, c, e, f, i and l show mean ± SEM. All P values were calculated using a two-tailed t-test. Numerical source data are provided in Statistic Source Data Fig. 6.
We then administered D+Q to DEN/Cre mice at a later stage (Extended Data Fig. 6h). Whereas livers from Veh animals contained numerous surface tumours by 36 weeks, the D+Q cohort exhibited significantly fewer lesions (Fig. 6h, i). SA-β-Gal+ cell numbers were reduced (Fig. 6j and Extended Data Fig. 7i), but the percentage of BrdU+ proliferating HSCs remained comparable (Extended Data Fig. 7j), indicating that D+Q through this regimen targets senescent but not generally activated HSCs. To further validate this, we applied D+Q to DEN/GFP animals at early or late stages and compared tumour burdens (Extended Data Fig. 7a, h). As shown in Extended Data Fig. 7k, D+Q treatment didn’t affect surface tumour numbers in DEN/GFP mice at either stage.
Similar to D+Q treatment, decreased liver tumour burden was observed in DEN/Cre animals after ABT-263 administration (Extended Data Fig. 7l), as evidenced by reduced surface tumour numbers and sizes (Fig. 6k, l). Consistently, ABT-263 treatment increased peritumour cellular apoptosis (Fig. 6m and Extended Data Fig. 7m), reduced SA-β-Gal+ cell numbers (Fig. 6n and Extended Data Fig. 7n), and decreased IL6 expression (Fig. 6o, p). Importantly, ABT-263 treatment had no effect on tumour burden in DEN/GFP mice (Extended Data Fig. 7l, o). Altogether, targeted elimination of senescent HSCs blunts tumour progression driven by hepatic FBP1 loss.
Hepatic HMGB1 contributes to HSC activation and SASP upon FBP1 loss
In an attempt to identify mediator(s) between FBP1-deficient hepatocytes and HSCs, we collected CM from 24-week GFP and Cre primary hepatocytes and performed unbiased secretome profiling through label free quantitative proteomics. Unsupervised hierarchical clustering of 1944 identified proteins reveals a distinct secretome profile of Cre hepatocytes (Extended Data Fig. 8a). In particular, 459 proteins showed >=1.5-fold change (adjusted p<0.05), and 23 of 45 secretory proteins showed increased secretion by Cre hepatocytes (Fig. 7a and Extended Data Fig. 8b). Notably, high mobility group protein B1 (HMGB1), a damage-associated molecular pattern (DAMP) known to regulate chronic liver injury and HSC activation10, 11, 39–42, was included in this list (Fig. 7a). Cre hepatocytes also secreted elevated levels of CCN1 (CYR61), a matricellular protein promoting HSC senescence43, and CCL2, a chemoattractant for HSC migration44 (Fig. 7a). Although multiple factors likely contribute to the crosstalk, we focused on HMGB1 based on several observations: first, HMGB1 release was increased in FBP1-deficient hepatocytes (Extended Data Fig. 8c); second, HMGB1 nucleus-to-cytoplasm translocation was elevated in Cre livers, as revealed by IF staining (Fig. 7b), and confirmed by subcellular fractionation and immunoblotting of liver extracts (Extended Data Fig. 8d); third, the ER stress agonist tunicamycin (TUN) upregulated UPR genes and promoted HMGB1 release by murine hepatocytes (Extended Data Fig. 8e, f); lastly, treating human HSCs with recombinant HMGB1 elevated SASP and fibrotic gene expression (Extended Data Fig. 8g, h). We therefore treated DEN/GFP or DEN/Cre animals with inflachromene (ICM) (Extended Data Fig. 9a), a small molecule shown to block HMGB1 release45. ICM treatment greatly reduced not only surface tumours (Fig. 7c and Extended Data Fig. 9b), but also microscopic lesions in DEN/Cre mice (Fig. 7d and Extended Data Fig. 9c). ICM did not affect hepatic steatosis, based on comparable TG levels (Extended Data Fig. 9d). As expected, cytosolic HMGB1 levels decreased while nuclear HMGB1 levels increased in ICM-treated livers (Extended Data Fig. 9e). ICM also substantially reduced numbers of HSCs expressing SASP components (Fig. 7e, f). Additionally, SA-β-Gal+ cells were reduced by ICM (Fig. 7g and Extended Data Fig. 9f), but apoptosis was not increased based on TUNEL staining (Extended Data Fig. 9g). Furthermore, in vitro ICM treatment neither decreased the viability of HSCs and D37 cells (Extended Data Fig. 9h–j), nor robustly affected most SASP genes (Extended Data Fig. 9k). Because HMGB1 promoted fibrotic gene expression (Extended Data Fig. 8h), ICM may block HMGB1 release and inhibit HSC activation upstream of senescence. Indeed, ICM treatment significantly attenuated liver fibrosis in DEN/Cre livers, as supported by decreased fibrotic gene expression and collagen deposition (Fig. 7h and Extended Data Fig. 9l). Importantly, ICM treatment of DEN/GFP animals without HSC activation didn’t change tumour burden, based on comparable surface tumour numbers (Extended Data Fig. 9a, m). Taken together, we identify HMGB1 as a key mediator of FBP1-deficient hepatocyte crosstalk with HSCs underlying tumour progression.
Figure 7 |. HMGB1 mediates crosstalk between FBP1-deficient hepatocytes and HSCs.
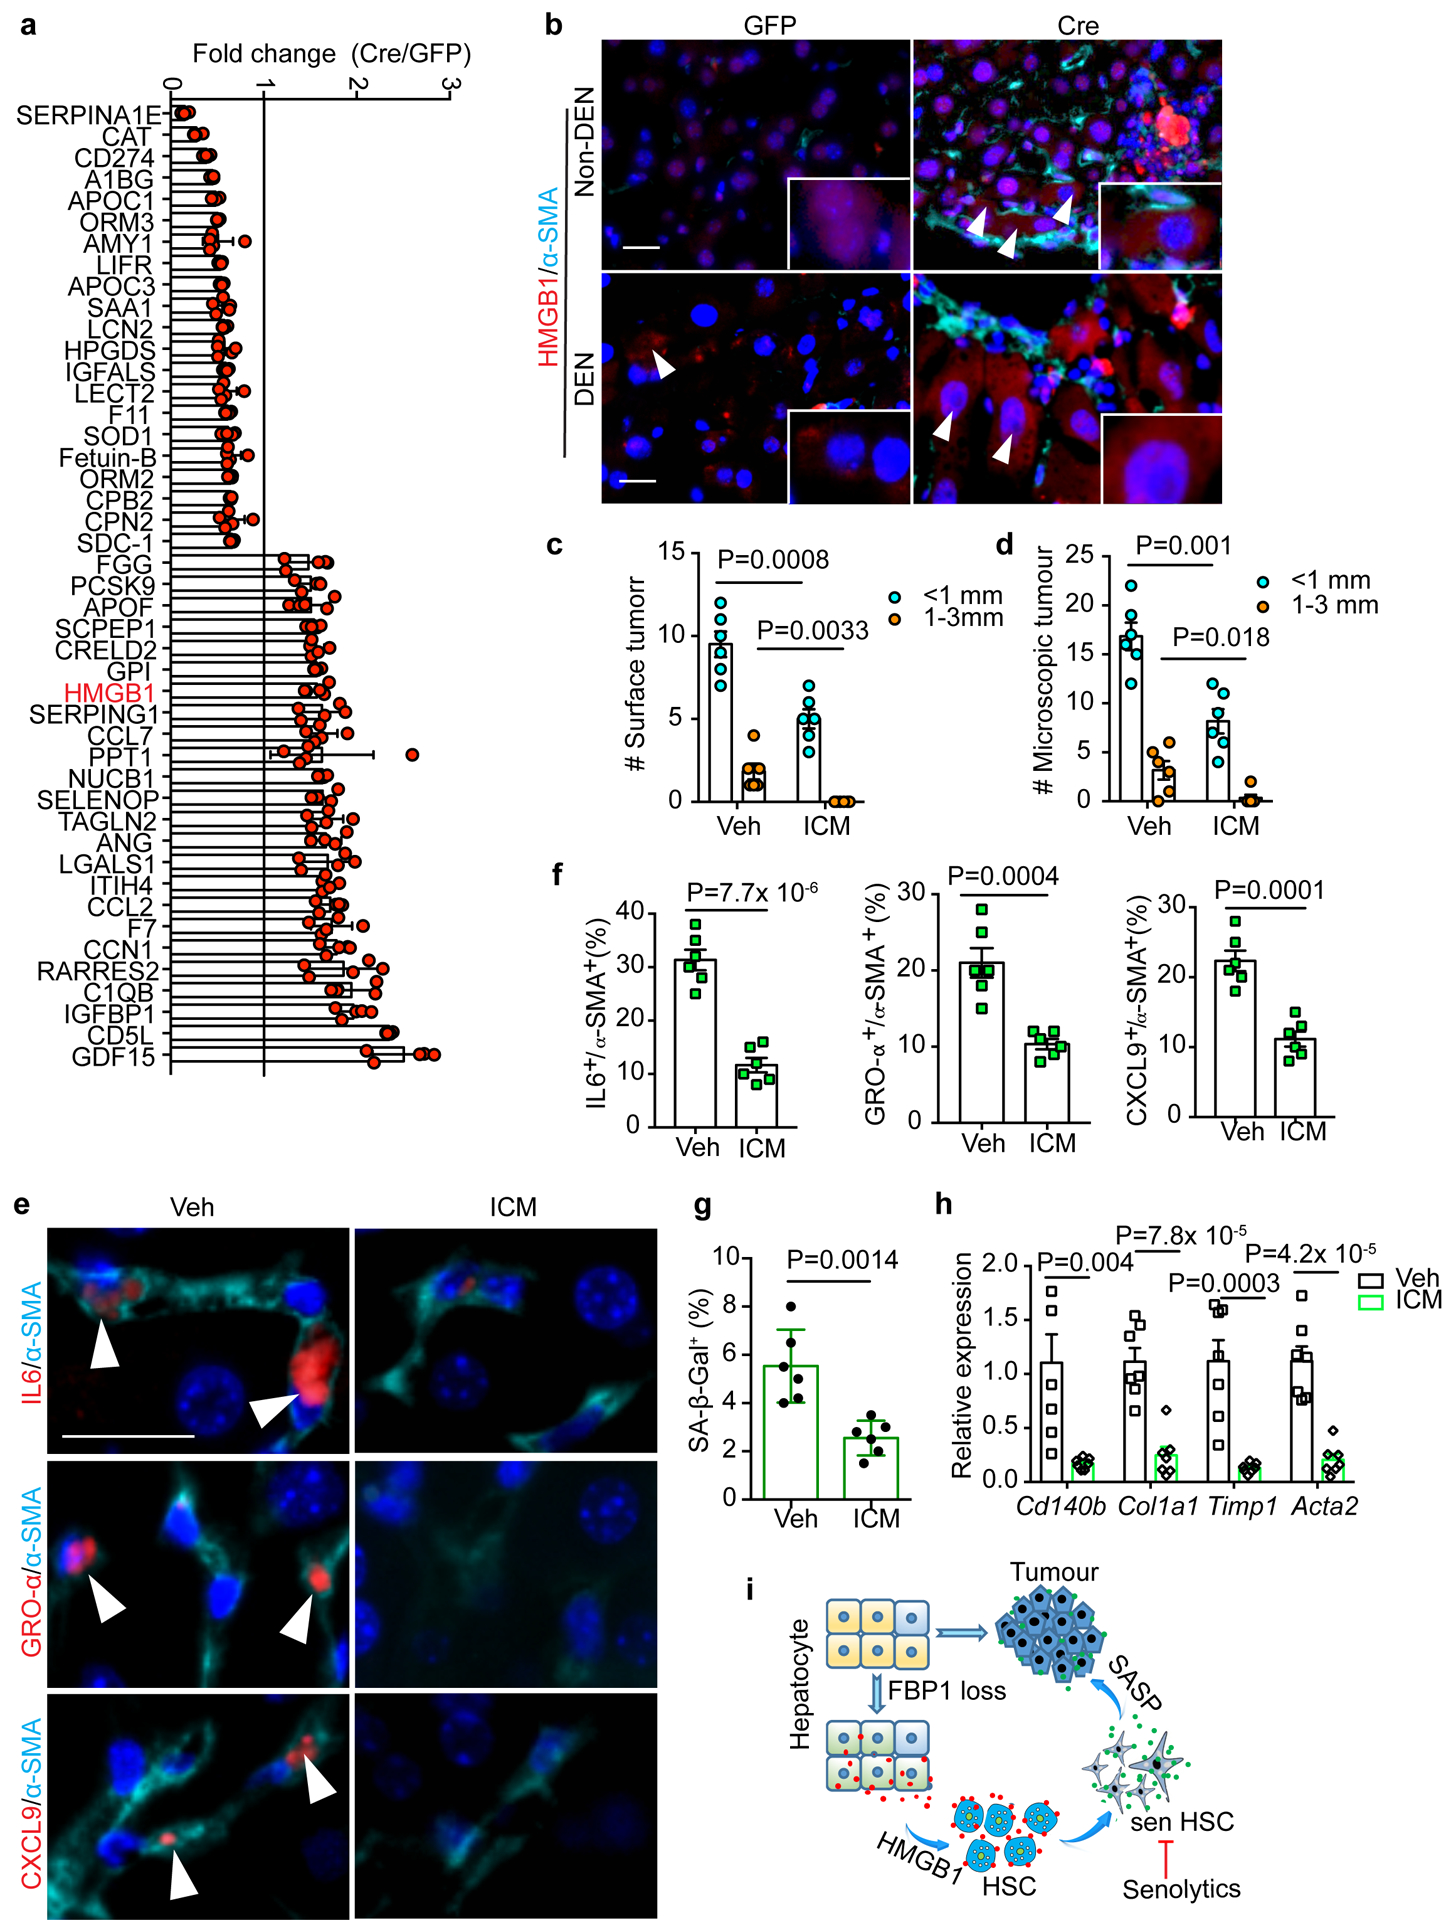
a, Fold change of 45 secretory protein abundances in Cre relative to GFP hepatic CM (adjusted p<0.05). 5 biological replicates from 3 mice of each cohort. b, Representative IF staining of HMGB1 and α-SMA in 24-week mouse liver sections (n=3 independent experiments). Scale bar: 50 μm. White arrowheads indicate cells with cytosolic HMGB1 staining. c, d, Quantification of surface tumour (c) and microscopic tumour (d) number and size distributions in Veh (n=6) and ICM (n=7) DEN/Cre mice. e, f, IF staining (e) of IL6+/α-SMA+, GRO-α+/α-SMA+ and CXCL9+/α-SMA+ cells and quantification (% of α-SMA+) (f) in mouse liver sections from Veh (n=6) and ICM (n=7) DEN/Cre cohorts. Scale bar: 50 μm. White arrowheads in (e) indicate cells with double positive staining. g, Quantification of SA-β-Gal staining (% of cells) in 24-week Veh (n=6) and ICM (n=6) DEN/Cre mouse liver sections. h, qRT-PCR analysis of fibrotic gene expression from 24-week Veh (n=6) and ICM DEN/Cre (n=5) mouse livers. i, Working model for liver tumour promotion by hepatic FBP1 loss. Hepatic FBP1 loss disrupts liver metabolism leading to ER stress and a distinctive hepatic secretome; secreted HMGB1 as one mediator activates HSCs; HSCs undergo senescence (sen HSC) and promote tumour progression through a SASP. Graphs in c, d, f, g and h show mean ± SEM, and P values were calculated using a two-tailed t-test. Numerical source data are provided in Statistic Source Data Fig. 7.
Discussion
We provide here genetic evidence for the gluconeogenic enzyme FBP1 as a bona fide metabolic tumour suppressor in liver and demonstrate that hepatic FBP1 loss facilitates tumourigenesis through crosstalk between hepatocytes and HSCs (Fig. 7i). This is initiated by metabolic deregulation in hepatocytes, partly mediated by HMGB1 to activate HSCs prior to senescence, and ultimately driven by senescent HSCs through a SASP. Notably, the metabolic deregulation is accompanied by differential expression of metabolic genes known to be regulated by MYC (Fig. 2f, g). FBP2, another FBP family member, directly binds to MYC and inhibits its transcriptional activity in soft tissue sarcoma46, suggesting that MYC could impact certain metabolic genes in this context. Since Fbp1 is initially upregulated and subsequently silenced during NAFLD-HCC progression (Fig. 1g), it will be interesting to study how FBP1 loss affects early NAFLD or late tumour progression, by combining this Fbp1 allele with diet-induced and/or genetic NAFLD models19, 20, 22, such as MUP-uPA mice23.
Cellular senescence exerts both anti-tumorigenic and pro-tumorigenic effects31, 47. Indeed, oncogene-induced senescence in hepatocytes limits early tumour initiation but promotes late tumour progression48, 49, and senescent HSCs limit liver fibrosis while facilitating obesity-associated HCC26, 27. We propose that an HSC senescence secretome critically drives tumour progression by FBP1 loss. Considering the complexity of SASP31, 47, 50, certain pro-growth HSC SASP components may directly contribute to this process. Interestingly, associated with HSC senescence, NK cells and MDSCs are reduced in FBP1-deficient livers. Because these cells are immunosurveillance effectors for clearing senescent hepatocytes and HSCs48, 49, 51, their reduction pinpoints a compromised immunosurveillance underlying senescent HSC accumulation. The reduction of NK cells and MDSCs in FBP1-deficient livers could result partly from increased levels of ceramide species, since ceramides and free fatty acids (FFAs) can regulate immune cell functions and contribute to liver cancer. For example, ceramide attenuates autophagy and induces ER stress to promote MDSC death52. Moreover, NK cell infiltration and functionality are directly inhibited by polyunsaturated FFA in HCC patients53. One future direction is to dissect functional connections between hepatic ceramide accumulation, immune cell composition and HSC senescence in the context of FBP1 deficiency.
Recent studies show that genetically targeting cellular senescence in INK-ATTAC and p16–3MR models significantly improved aging-associated phenotypes30, 54, 55. Senolytics (including D+Q and ABT-263) have also received increased attention in the area of aging research56–58. Senotherapy may also be an applicable strategy for cancer treatment59, 60, and combining chemotherapy with ABT-263 limits breast cancer metastasis in mice61. We present here that intermittent treatment with D+Q or ABT-263 eliminates senescent HSCs and blunts liver tumour progression. While our results strongly suggest that senescent HSCs promote tumour progression, genetic depletion of senescent HSCs would provide a more definitive answer, since pharmacological approaches may have pleiotropic effects. Nevertheless, our study using two independent senolytics provides proof-of-principle for targeting senescence in the liver TME, and raises the possibility for therapeutic intervention in patients. Interestingly, senescence can be specifically induced in p53-mutant HCC cells and then exploited for senolysis62. Together, rational targeting of senescence in either tumour or stromal cells represents a potential therapeutic strategy for liver cancer. Although identifying highly specific and effective senolytics is still an ongoing challenge56–58, the application of senolytics, either alone or in combination therapy, once optimized, holds significant therapeutic potential for liver cancer in the clinic.
Methods
Mice.
The study is compliant with all relevant ethical regulations regarding animal research. All mouse experiments were reviewed and approved by the Institutional Animal Care and Use Committee (IACUC) at the University of Pennsylvania. C57BL/6, Trp53flox/flox (p53), FLPo-10 and NOD-scid IL2Rgammanull (NSG) mice (6–8 weeks) were purchased from the Jackson Laboratory. Fbp1fl/fl mice were generated by homologous recombination with assistance from the Transgenic and Chimeric Mouse Facility at the University of Pennsylvania. Briefly, a targeting vector containing neomycin-resistance and DT-A cassettes was constructed by inserting two LoxP sites into mouse Fbp1 locus flanking the core promoter and Exon 1 region. The vector was electroporated into v6.5 ES cells (Novus), single clones were selected, recombination was screened by PCR and then confirmed by southern blotting. Positive clones were subjected to blastocyst injection, and implanted into pseudopregnant C57BL/6 mice. Germline transmissioned offsprings were crossed to FLPo-10 mice to generate heterozygous progenies that were further crossed to generate homozygous (Fbp1fl/fl) alleles. Fbp1 genotyping primers were described in Supplemental Table 2. Fbp1fl/fl alleles were backcrossed for at least five generations. P53/Fbp1 mice were generated by crossing p53 allele with Fbp1fl/fl mice. Unless indicated elsewhere, only male mice were used for tumour experiments. AAV8-TBG-GFP and AAV8-TBG-Cre (1× 10¹¹ GC/mouse, Penn Vector Core) were delivered through tail vein injection into 6-week Fbp1fl/fl mice. For DEN-induced liver tumourigenesis, 14-day-old male mice were injected i.p. with 6 mg/kg DEN (Sigma) as previously24, 63. To induce NAFLD in Fbp1fl/fl mice, AAV-TBG-GFP and AAV-TBG-Cre were delivered to 6-week male mice, 3 weeks later the mice were fed with a western diet (21.1% fat, 41% Sucrose, and 1.25% Cholesterol by weight, Teklad diets, TD. 120528) and a high sugar solution (23.1 g/L d-fructose, Sigma-Aldrich, F0127; 18.9 g/L d-glucose, Sigma-Aldrich, G8270), together with weekly i.p. injection of CCl4 (0.2 μl/g; Sigma-Aldrich, 289116–100ML) for 24 weeks. Dasatinib (D) and quercetin (Q) (Sigma) were diluted in 100 μl 10% PEG400 and delivered by oral gavage once per month for three months at dosages of 5 mg/kg (D) and 50 mg/kg (Q) body weight33. ABT-263 (Cayman) was diluted in vehicle solution (ethanol: polyethylene glycol 400: Phosal 50 PG), and delivered by oral gavage at 50 mg/kg/day, 5 d per cycle and three cycles with a 16-day interval37. ICM (EMD Millipore) (10 mg/kg/day) or vehicle (60% phosphal 50 PG, 30% PEG 400 and 10% ethanol) was administered i.p. for 8 weeks, as in previous study45. For BrdU labeling, mice were injected i.p. with 100 mg/kg BrdU solution (Sigma) 2 h before sacrifice. Tissue slides were examined by a certified pathologist (Dr. Amy Durham) at the Comparative Pathology Core, School of Veterinary Medicine, University of Pennsylvania.
Cell culture.
PLC/PRF/5 (PLC) (ATCC-CRL8204) and D37 (provided by Dr. Kathryn E. Wellen) cells were cultured in DMEM containing 10% fetal bovine serum. Human HSCs (Passage 3) were purchased from ZenBio, Inc. Cells were routinely tested to exclude mycoplasma contamination. Primary mouse HSCs were isolated from 10-week C57BL/6 mice following a previous protocol64. HSCs were cultured under 3% O2 in DMEM containing 10% fetal bovine serum, L-glutamine, sodium pyruvate, nonessential amino acids and sodium bicarbonate. SEN HSCs were established by treating human HSCs with 100 μM etoposide (Sigma) for 48 h and recovering for 8 days26; vehicle (DMSO)-treated HSCs were used as growing (GRO) HSCs. GRO and SEN human HSCs were cultured in 15-cm plates (2×10⁶/plate) with 25 ml serum free DMEM for 24 h, the medium was normalized based on cell number by diluting with DMEM, and then mixed with DMEM containing 2% FBS (3:1, vol/vol) to make final HSC conditioned medium (CM) containing 0.5% FBS.
Cytokine array.
Mouse primary HSCs were cultured in 6-well plates (in triplicate, under 3% O2 conditions) for 7 days, treated with vehicle (DMSO) or 10 μM etoposide for 24 h, recovered in regular medium for 8 days, and then cultured in fresh serum-free DMEM for 24 h. CM samples were normalized based on cell number by diluting with DMEM. 75 μl of CM aliquots were analyzed using multiplex immunoassays designed for mouse (Mouse Cytokine Array/Chemokine Array 44-Plex assay) from Eve Technologies.
Cell proliferation and clonogenicity assays.
GRO or SEN HSCs were seeded in 6-well plates (5×10⁴/well, in triplicate) and cultured under 3% O2 for 6 days, with medium changed every other day, and cell number determined with a hemocytometer. For long term proliferation assay (Fig. 5c), GRO or SEN HSCs were cultured in 24-well plates (1× 10⁵/well, in triplicate) under 3% O2 for 21 days, and then fixed for crystal violet staining. D37 or PLC cells were seeded in 6-well plates (5×10⁴/well, in triplicate) and cultured under 3% O2 in CM for 5 days, with medium changed every other day, and cell number determined with a hemocytometer. For clonogenicity assay, PLC cells were cultured with human HSC CM in 6-well plates (1×10³/well, in triplicate) for 7 days, and fixed for crystal violet staining.
In vitro drug treatment.
For D+Q, ABT-263 or AZD5991 (Selleck) treatment, D37 (5× 10⁴/well, in triplicate), GRO (1× 10⁵/well, in triplicate) or SEN (1.5× 10⁵/well, in quadruplicate) human HSCs were plated in 6-well plates for 24 h, treated with indicated drug combinations/concentrations for 3 (D37) or 5 days (HSCs), trypsinized and counted with a hemocytometer; The viable cell numbers were normalized to those of vehicle groups, and apoptosis was determined by PI/Annexin-V staining and flow cytometry with Calibur (BD Biosciences). For ICM treatment, D37 (5× 10⁴/well, in quadruplicate), GRO (1× 10⁵/well, in triplicate) or SEN (1.5× 10⁵/well, in quadruplicate) human HSCs were plated in 6-well plates for 24 h, treated with indicated concentrations for 72 h, counted and normalizing to vehicle control (ICM: 0 μM). For HMGB1 treatment, human HSCs were seeded in 12-well plates (2×10⁴/well, in triplicate) for 24 h, serum-starved for 6 h, and then cultured in DMEM containing BSA or 1 nM HMGB1 (1690-HMB, R&D) for 15 h.
Xenograft tumour experiment.
1× 10⁶ PLC cells were mixed with 3×10⁶ GRO or SEN human HSCs in 100 μl DMEM containing Matrigel, and subcutaneously injected into flanks of NSG mice. Tumour volume was monitored by caliper measurements.
Histology, immunohistochemistry (IHC) and immunofluorescence (IF).
Mouse tissues were fixed in 4% PFA, or embedded in OCT right after collection, and submitted to the Molecular Pathology & Imaging Core (MPIC) at the University of Pennsylvania for processing, sectioning, and hematoxylin & eosin (H&E) staining. Human HCC tissue array slides were purchased from US Biomax. For IHC, slides were deparaffinized, rehydrated, quenched in 0.6% hydrogen peroxide/methanol for 15 min. Citrate (10 mM, pH 6.0) buffer was used for antigen retrieval. Slides were incubated with primary antibodies overnight at 4 °C, and then with biotinylated secondary antibodies followed by ABC solution and developed with 3,3′-diaminobenzidine (Vector Laboratories). Slides were counterstained with hematoxylin, dehydrated, and mounted with Permount (Thermo Fisher). For IF staining, cryosections were incubated with 0.25% Triton-X-100 (10 min at room temperature), and blocking buffer (4% BSA, 2% serum in PBS, 1 h at room temperature), and then primary antibodies overnight at 4 °C. Fluorescein-conjugated secondary antibodies were incubated for 1 h at room temperature, and mounted with ProLong™ Gold Antifade Mountant with DAPI (Thermo Fisher). All antibodies are described in Supplemental Table 1. A Mouse on Mouse (M.O.M.) Detection Kit (#BMK-2202, Vector Laboratories) was applied to reduced background staining. For TUNEL staining, an In Situ Cell Death Detection Kit (TMR Red, Sigma) was used following the manufacturer’s instructions. Slides were examined and images were captured on a Leica DM5000B microscope. For IHC, IF and TUNEL staining quantification, 3–5 representative images with 200x field of view (FOV) were used for quantification by Image J and averaged for each animal.
Transmission electron microscopy (TEM).
Fresh liver tissues were fixed in a solution containing 2.5% glutaraldehyde in 0.1 M sodium cacodylate buffer (pH 7.4). The samples were then submitted to the Electron Microscopy Resource Laboratory at the University of Pennsylvania to process and capture images. At least 30 images (25,000x) from each sample were used to quantify the percent of ER-mitochondria contact with Image J following a previous study14.
SA-β-Gal staining.
SA-β-gal staining was performed as previously described at pH 5.5 for mouse tissues, and pH 6.0 for human HSCs65. Cryorosections or adherent cells were fixed with 0.5% glutaraldehyde in PBS for 15 min, washed with 1x PBS supplemented with 1mM MgCl2, and stained for 5–8 h in 1x PBS containing 1 mM MgCl2, 1 mg/ml X-Gal, and 5 mM each of potassium ferricyanide and potassium ferrocyanide. The slides were then rinsed in 1x PBS, counterstained with 0.1% Nuclear Fast Red (Sigma) for 5 min and mounted for examination. To quantify, 3–5 representative images with 200x fields of view (FOV) were quantified with Image J for each sample.
Oil Red O staining.
A working solution was generated by diluting a 3.5 mg/ml stock (in 100% isopropanol) 6:4 with distilled water. This solution was incubated at room temperature for 30 min and filtered by Whitman paper before use. Frozen sections were incubated in 60% isopropanol for 5 min, then in Oil Red O staining solution for 30 min at room temperature. Slides were rinsed in distilled water and counterstained with hematoxylin before mounting in aqueous mounting solution. For quantification, 5 representative images with 200x fields of view (FOV) were quantified with Image J to determine the area fraction and averaged for each animal.
Sirius Red staining.
Paraffin-embedded tissue slides were deparaffinized, rehydrated and incubated with pre-warmed Bouin’s solution at 55 °C for 1 h. The slides were then washed and incubated in 0.1% fast green (Sigma) solution for 10 min, then in 1% acetic acid for 2 min. Slides were then stained in 0.1% Sirius Red (Sigma) solution for 30 min, dehydrated and then mounted for examination. For quantification, 3–5 representative images with 100x fields of view (FOV) from each animal were quantified with Image J to determine the area fraction.
Metabolic tests and other assays.
Pyruvate tolerance test (PTT) and glucose tolerance test (GTT) were performed after an overnight (16-h) fast on mice housed on aspen chip bedding. Mice were injected i.p. with 2 g/kg body weight Na-pyruvate (PTT), or 1g/kg body weight D-glucose (GTT) dissolved in sterile saline. Blood glucose levels were measured with a One-Touch glucometer (LifeScan). For fasting and re-feeding experiments, fasted mice were fed with standard chow for 4 h, retro-orbital blood was collected for serum FFA and BHBA quantification at the Mouse Phenotyping, Physiology and Metabolism Core at the University of Pennsylvania. Triglyceride (K622) and serum ALT (K752) assay kits were purchased from Biovision. HMGB1 ELISA Kit (LS-F11642–1) was purchased from LifeSpan BioSciences.
Primary mouse hepatocyte isolation and culture.
Primary mouse hepatocytes were isolated using a two-step collagenase perfusion protocol25. Briefly, the mouse was perfused via portal vein with 40 ml warm (37 °C) Hank’s buffered saline solution (HBSS), followed by 40 ml HBSS containing 1 mM EGTA, and then by 40 ml HBSS containing 5 mM CaCl2 and 40 μg/ml Libertase™ (Sigma). Hepatocytes were spun down at 50 g for 3 min at 4 °C. Live hepatocytes were attached to collagen I-coated 6-well plates (0.6 × 10⁶ cells/well) for 6 h in hepatocyte attachment medium (Williams E medium, 1% P/S, 2 mM L-glutamine, 1% NEAA and 10% FBS), then cultured in Williams E medium containing 1% P/S, 0.1 μg/ml fungizone, 50 μg/ml gentamycin, 2 mM L-glutamine and 0.1 mM NEAA.
Secretome profiling through label free quantitative proteomics.
Fresh mouse hepatocytes were attached to collagen I-coated 15-cm plates (1.5 × 10⁷/plate) for 4 h, and cultured in 25 ml serum/phenol red-free DMEM for another 6 h to collect the CM. 4 ml CM were concentrated to 100–110 μl using Amicon Ultra-4 Centrifugal Filters. 50 μg protein samples were used for quality control test and label-free quantitative proteomics at Proteomics & Metabolomics Facility at the Wistar Institute. Briefly, 20 μg of each sample was run into a gel for 0.5 cm and stained with Coomassie stain. The entire protein-containing gel region was excised, reduced with TCEP, alkylated with iodoacetamide, digested in-gel with trypsin and cleaned up using MiniSpin C18 columns. Digested samples were labeled with a specific TMT 10-plex reagent. A pilot 1:1 mix was made from all labeled samples, cleaned up with C18 microspin column and analyzed by LC-MS/MS on a Thermo Q Exactive HF mass spectrometer. Each TMT reporter ion intensity was determined, and sample volume adjustment was made to achieve a 1:1 final mix. The final 1:1 mixed sample was subjected to high pH fractionation into 11 fractions (5%, 10%, 12%, 14%, 16%, 18%, 20%, 22%, 25%, 40% and 80% ACN). MS/MS data were searched against the UniProt mouse database (10/01/2018) using MaxQuant 1.6.2.3. Protein and peptide false discovery rate was set at 1%.
Targeted lipid profiling.
Frozen liver tissues were added to a 1.5 ml low retention tubes containing 210 μl cold water with 40 ng [2H213C2]-Cer-(d18:1/C18:0) (Avanti Polar Lipids, Alablaster, AL) as internal standard. For each tube, 380 μl methanol was added, followed by 760 μl CHCl3, and then vortexed for three times for 50 seconds each. The samples were then centrifuged at 8, 000 × g for 10 minutes at 4°C. The lower organic phase was transferred to a clean 1.5 ml low retention tube, and evaporated under nitrogen. The pellet was resuspended in 200 μl isopropanol: acetonitrile: water mixture (3:5:2 v/v/v), spun down, filtered through a 0.22 μm spin filter (nylon, CoStar) at 10, 000 × g for 10 min at 4°C, and then transferred to a LC vial for UPLC-MS analysis (3 μl injections). LC separations were conducted using a Waters nano-ACQUITY UPLC system (Waters Corp., Milford, MA, USA), with a Waters XBridge BEH130 C18 column (100 μm Å~ 150 mm, 1.7 μm pore size) at a flow-rate of 1.6 μl/min, 55 °C. For LC-HRMS analysis, a recently calibrated QE Exactive hybrid mass spectrometer (Thermo Fisher) was used in the positive ion mode with a HESI source. Accurate mass database searching was performed through LipidSearch, HMBD, METLIN, KEGG and ChemSpider. Ceramide species were identified based on the following specific masses: C16:0 (M1, m/z 582.5103); C18:1 (M2, m/z 608.5250); C18:0 (M3, m/z 610.5403); C20:0 (M4, m/z 638.5717); C22:0 (M5, m/z 666.6019); and C24:1 (M6, m/z 692.6186). Targeted peak integration was confirmed with Xcalibur software.
Flow cytometry.
Liver mononuclear cells were isolated as previously7. Briefly, fresh liver tissues were excised and minced into small pieces in cold wash medium (RMPI 1640 medium with 5% FBS), filtered through 100-μm nylon mesh strainer, and spun down at 500 g for 5 min at 4 °C. The pellet was resuspended in ACK lysing buffer (Lonza), neutralized with wash medium, spun down and resuspended in 10 ml 37.5% Percoll (GE Healthcare). After centrifugation at 800 g for 30 min at 4 °C with the off-brake setting, the pellet was washed and resuspended in FACS buffer (5% BSA, 2 mM EDTA in Ca2+/Mg2+-free PBS) containing Fc block (2.4G2, 553141, 1:200, BD BioSciences). Cells were stained in FACS buffer with relevant antibodies for 15 min at 4 °C. Discrimination of live and dead cells was performed using LIVE/DEAD™ Fixable Aqua Dead Cell Stain Kit (L34957, 1:300, Thermo Fisher). Stained cells were analyzed using FACS LSR II (BD BioSciences). Data were processed on FlowJo software (TreeStar). Forward and side scatter were used to exclude cell debris and doublets. Based on the flow gating scheme (Supplemental Fig. 1), the following markers were used to identify different immune cell subsets: CD4+ T cells (CD3+CD4+CD8−), CD8+ T cells (CD3+CD4−CD8+), γδT cells (CD3+γδTCR+), activated NK cells (CD3−NKp46+), B cells (CD19+), B1 cells (CD19+CD43+IgMhi), B2 cells (CD19+CD43−CD5−), regulatory B cells (CD19hiCD1dhiCD5+), total macrophages (F4/80+) and MDSCs (CD11b+Ly6C+). All antibodies are described in Supplemental Table 1.
RNA-sequencing and data analysis.
Total RNA was extracted from snap frozen tissue samples using RNeasy Mini Kit (Qiagen). RNA quality test, library construction and sequencing were performed by Novogene Corporation. Data was analyzed at the Molecular Profiling Facility at the University of Pennsylvania. Briefly, Fastq files were checked for quality using FastQC and qualimap. Alignment was performed using the STAR aligner under default settings with the mm10 reference genome. Raw counts of gene transcripts were obtained from the resulting bam files using feature Counts. The raw count matrix was subsequently imported into R-studio (R version 3.3.3) and used as input for DESeq2 following the vignette of the package for normalization and differential gene expression analysis. Salmon/Sailfish was used in parallel to normalize and quantitate gene expression in transcripts per million (TPM) through quasi-alignment. GSEA (http://software.broadinstitute.org/gsea/index.jsp) was run for the contrast in pre-ranked mode using the DESeq2 statistic as the ranking metric. Mouse gene symbols were mapped to human gene orthologs using Ensembl’s BioMart (http://www.ensembl.org/biomart/martview/). Where there were redundant mappings, the statistic with the highest absolute value was chosen66.
Subcellular fractionation and immunoblotting.
Subcellular fractionation and immunoblotting were performed as previously67. Tissues were lysed with a buffer containing 10 mM Tris-HCl (pH 7.5), 150 mM NaCl, 5 mM EDTA, 0.1% SDS and 1x protease/phosphatase inhibitor cocktail (Cell Signaling). Protein concentrations were determined by BCA protein assay kit (Thermo Fisher). Equal amounts of protein lysates were separated by SDS-PAGE, transferred to nitrocellulose membranes, blotted with primary antibodies overnight at 4°C, and HRP–conjugated secondary antibodies (Cell Signaling) for 1 h at room temperature, followed by exposure to enhanced chemiluminescence reagents or SuperSignal™ West Femto Maximum Sensitivity Substrate (Thermo Fisher). All antibodies are described in Supplemental Table 1.
RNA isolation, RT and qRT-PCR.
Total RNA was isolated using RNeasy Mini Kit (Qiagen). cDNA was synthesized using a High-Capacity RNA-to-cDNA Master Mix (Applied Biosystems). qRT-PCR was performed using TaqMan Universal PCR Master Mix (Thermo Fisher) or Power SYBR Green Master Mix (Applied Biosystems) on a ViiA7 Real-Time PCR system (Applied Biosystems). Expression levels were normalized by18S rRNA. All TaqMan and SYBR green primers are described in Supplemental Table 2.
Human and mouse datasets.
The TCGA liver cancer RNA-sequencing dataset (https://cancergenome.nih.gov/cancersselected/LiverHepatocellularCarcinoma), and two mouse NAFLD-HCC datasets (GSE6768019 and GSE9901020) were downloaded and analyzed at the Molecular Profiling Facility at the University of Pennsylvania. Briefly, differential gene expression analysis of tumour and normal samples was performed using DeSeq (Bioconductor Version 2.12). Normalized counts, p values, false discovery rate, adjusted p values (p-adj), and fold expression change for each gene were exported. The cut-off value of p-adj was set to 0.1 to exclude genes not consistently detected by RNA-seq. For metabolic gene set analysis in Extended Data Fig. 1a, a total of 374 HCC tumours and 50 adjacent normal tissues from TCGA were included, and 2752 genes68 encoding all known human metabolic enzymes and transporters were classified according to the Kyoto Encyclopedia of Genes and Genomes. Generated metabolic gene sets were ranked based on their median fold expression changes in HCC tumours vs normal tissue, and plotted as median ± median absolute deviation.
Statistics and reproducibility.
Fig. 2d, e and Fig. 7a were performed once with at least three biologically independent samples. All other experiments were independently repeated more than two times with similar results. No data were excluded from our studies. Statistical analyses were performed with GraphPad Prism 7 software or Excel (Microsoft) using a two-tailed Student’s t test. Except for box plots, all other statistic data show mean ± SEM of at least three biologically independent experiments or samples. P value less than 0.05 was considered significant.
Reporting Summary.
Further information on research design is available in the Nature Research Reporting Summary linked to this article.
Code availability.
The software and algorithms for data analyses used in this study are all well-established from previous work and are referenced throughout the manuscript. No custom code was used in this study.
Data availability.
The human liver cancer data were derived from TCGA Research Network: https://cancergenome.nih.gov/cancersselected/LiverHepatocellularCarcinoma). Two public mouse NAFLD-HCC datasets (GSE6768019 and GSE9901020) were available at https://www.ncbi.nlm.nih.gov/geo/. RNA-seq data generated in this study have been deposited in the Gene Expression Omnibus (GEO) with the accession number GSE135616. Mass spectrometry data have been deposited in ProteomeXchange with the primary accession code PXD017831 (http://proteomecentral.proteomexchange.org/cgi/GetDataset?ID=PXD017831). The authors declare that the data supporting the findings of this study are available within the paper and its supplementary information files. All other data supporting the findings of this study are available from the corresponding author upon reasonable request.
Extended Data
Extended Data Fig. 1. Decreased FBP1 expression in human and murine liver tumours.
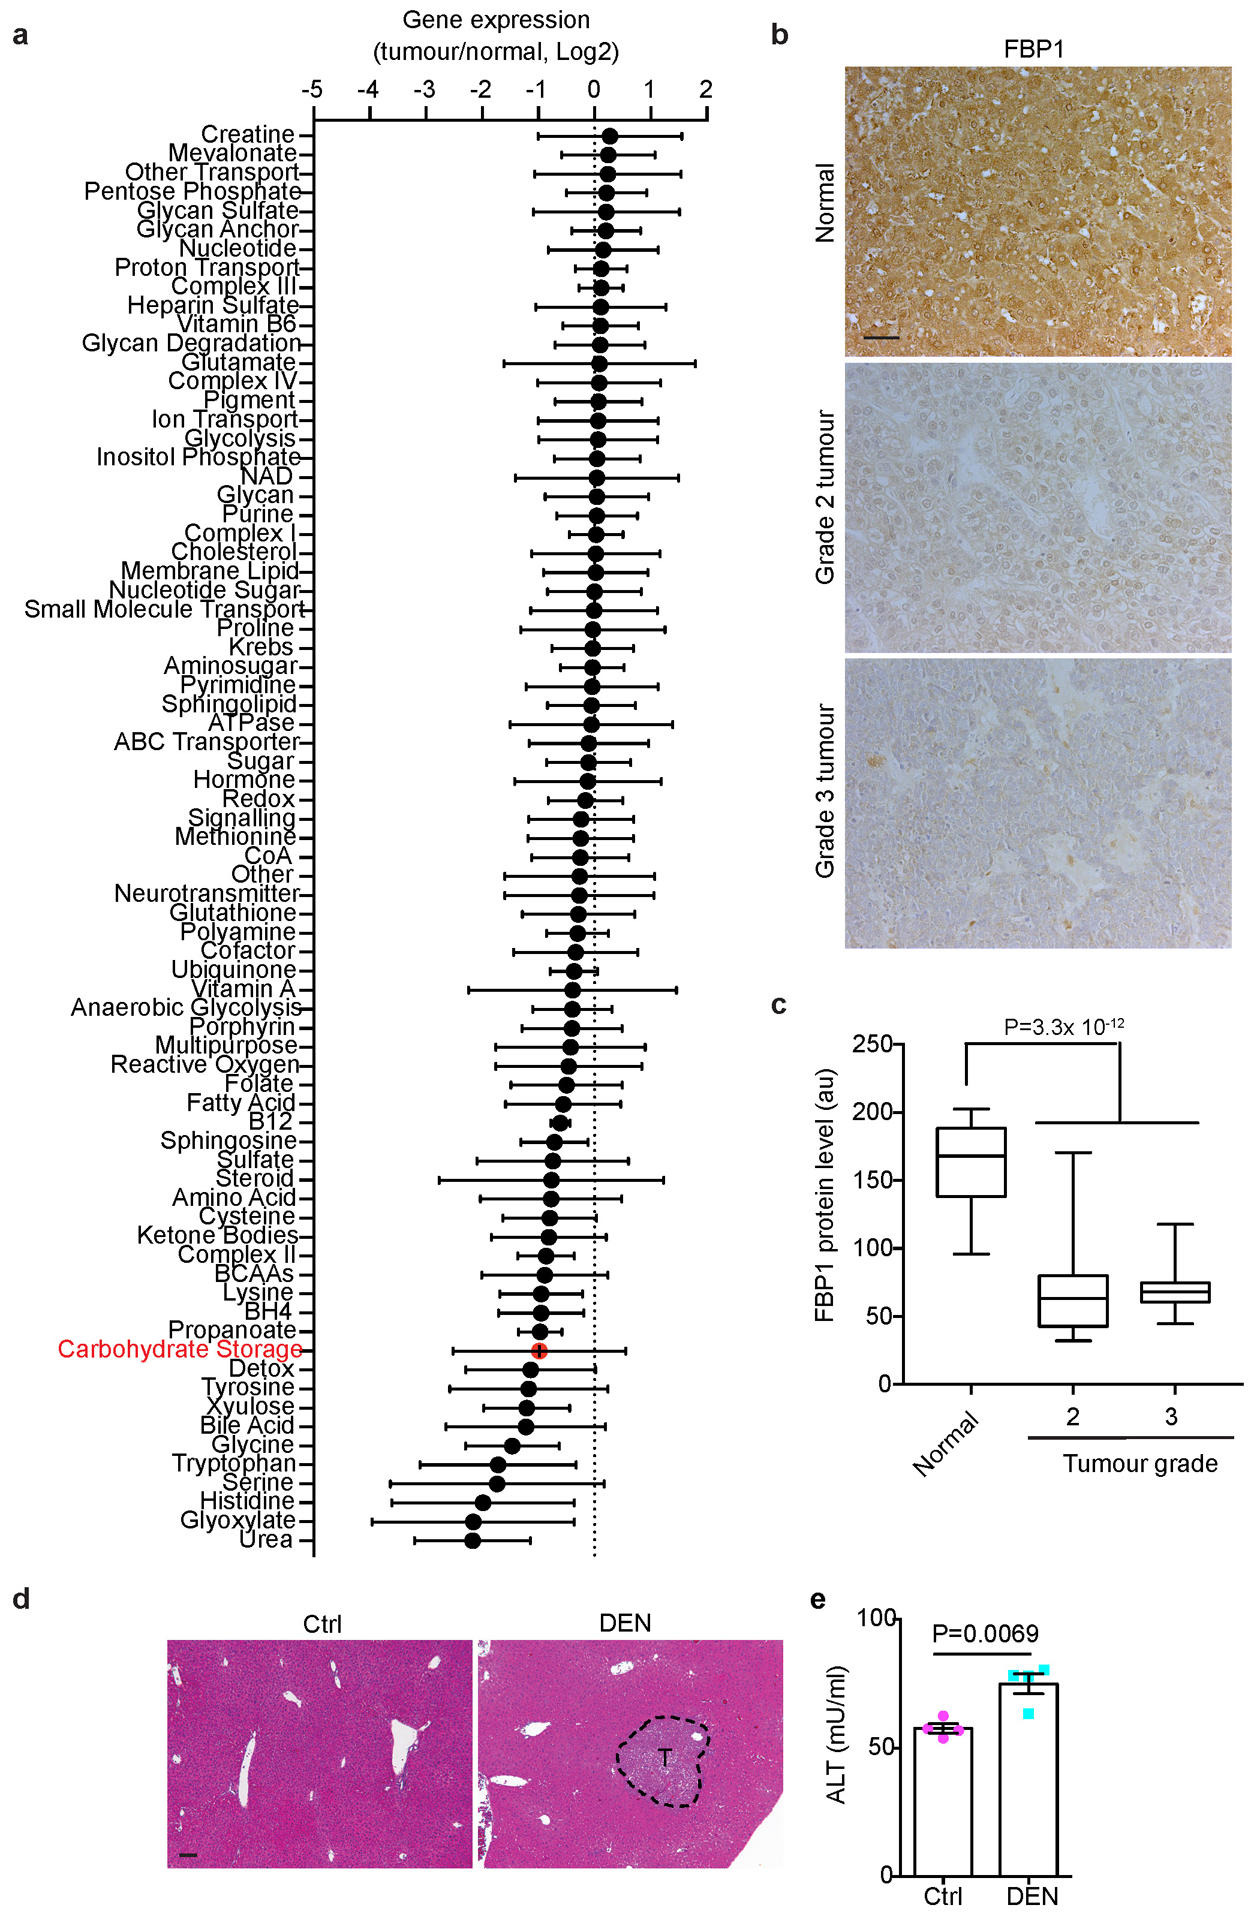
(a) Metabolic gene set analysis of TCGA HCC RNA-sequencing data. A total of 374 HCC tumours and 50 adjacent normal tissues were included, and 2752 genes encoding all known human metabolic enzymes and transporters were classified according to the Kyoto Encyclopedia of Genes and Genomes (KEGG). Generated metabolic gene sets were ranked based on their median fold expression changes in HCC tumours vs normal tissue, and plotted as median ± median absolute deviation. (b) Representative FBP1 IHC staining on human liver tissue array with adjacent normal, grade 2 and 3 HCC tissues. Scale bar: 100 μm. (c) Statistical analysis of FBP1 IHC staining in (b). n=20 for normal, n=30 for grade 2, n=30 for grade 3 samples. In each box plot, the top-most line is the maximum, the top of the box is the third quartile, the centre line is the median, the bottom of the box is the first quartile and the bottom-most line is the minimum. (d) Representative H&E staining in liver sections from 24-week control (Ctrl) and DEN-treated (DEN) C57BL/6 mice (n = 3 independent experiments with similar results). T, tumour. Scale bar: 100 μm. (e) Serum alanine transaminase (ALT) activity from 24-week Ctrl and DEN mice. n=4 for Ctrl, n=5 for DEN. Graph in e show mean ± SEM, and P value was calculated using a two-tailed t-test. Numerical source data are provided in Source Data Extended Data Fig. 1.
Extended Data Fig. 2. Hepatic FBP1 loss disrupts liver metabolism in mice.
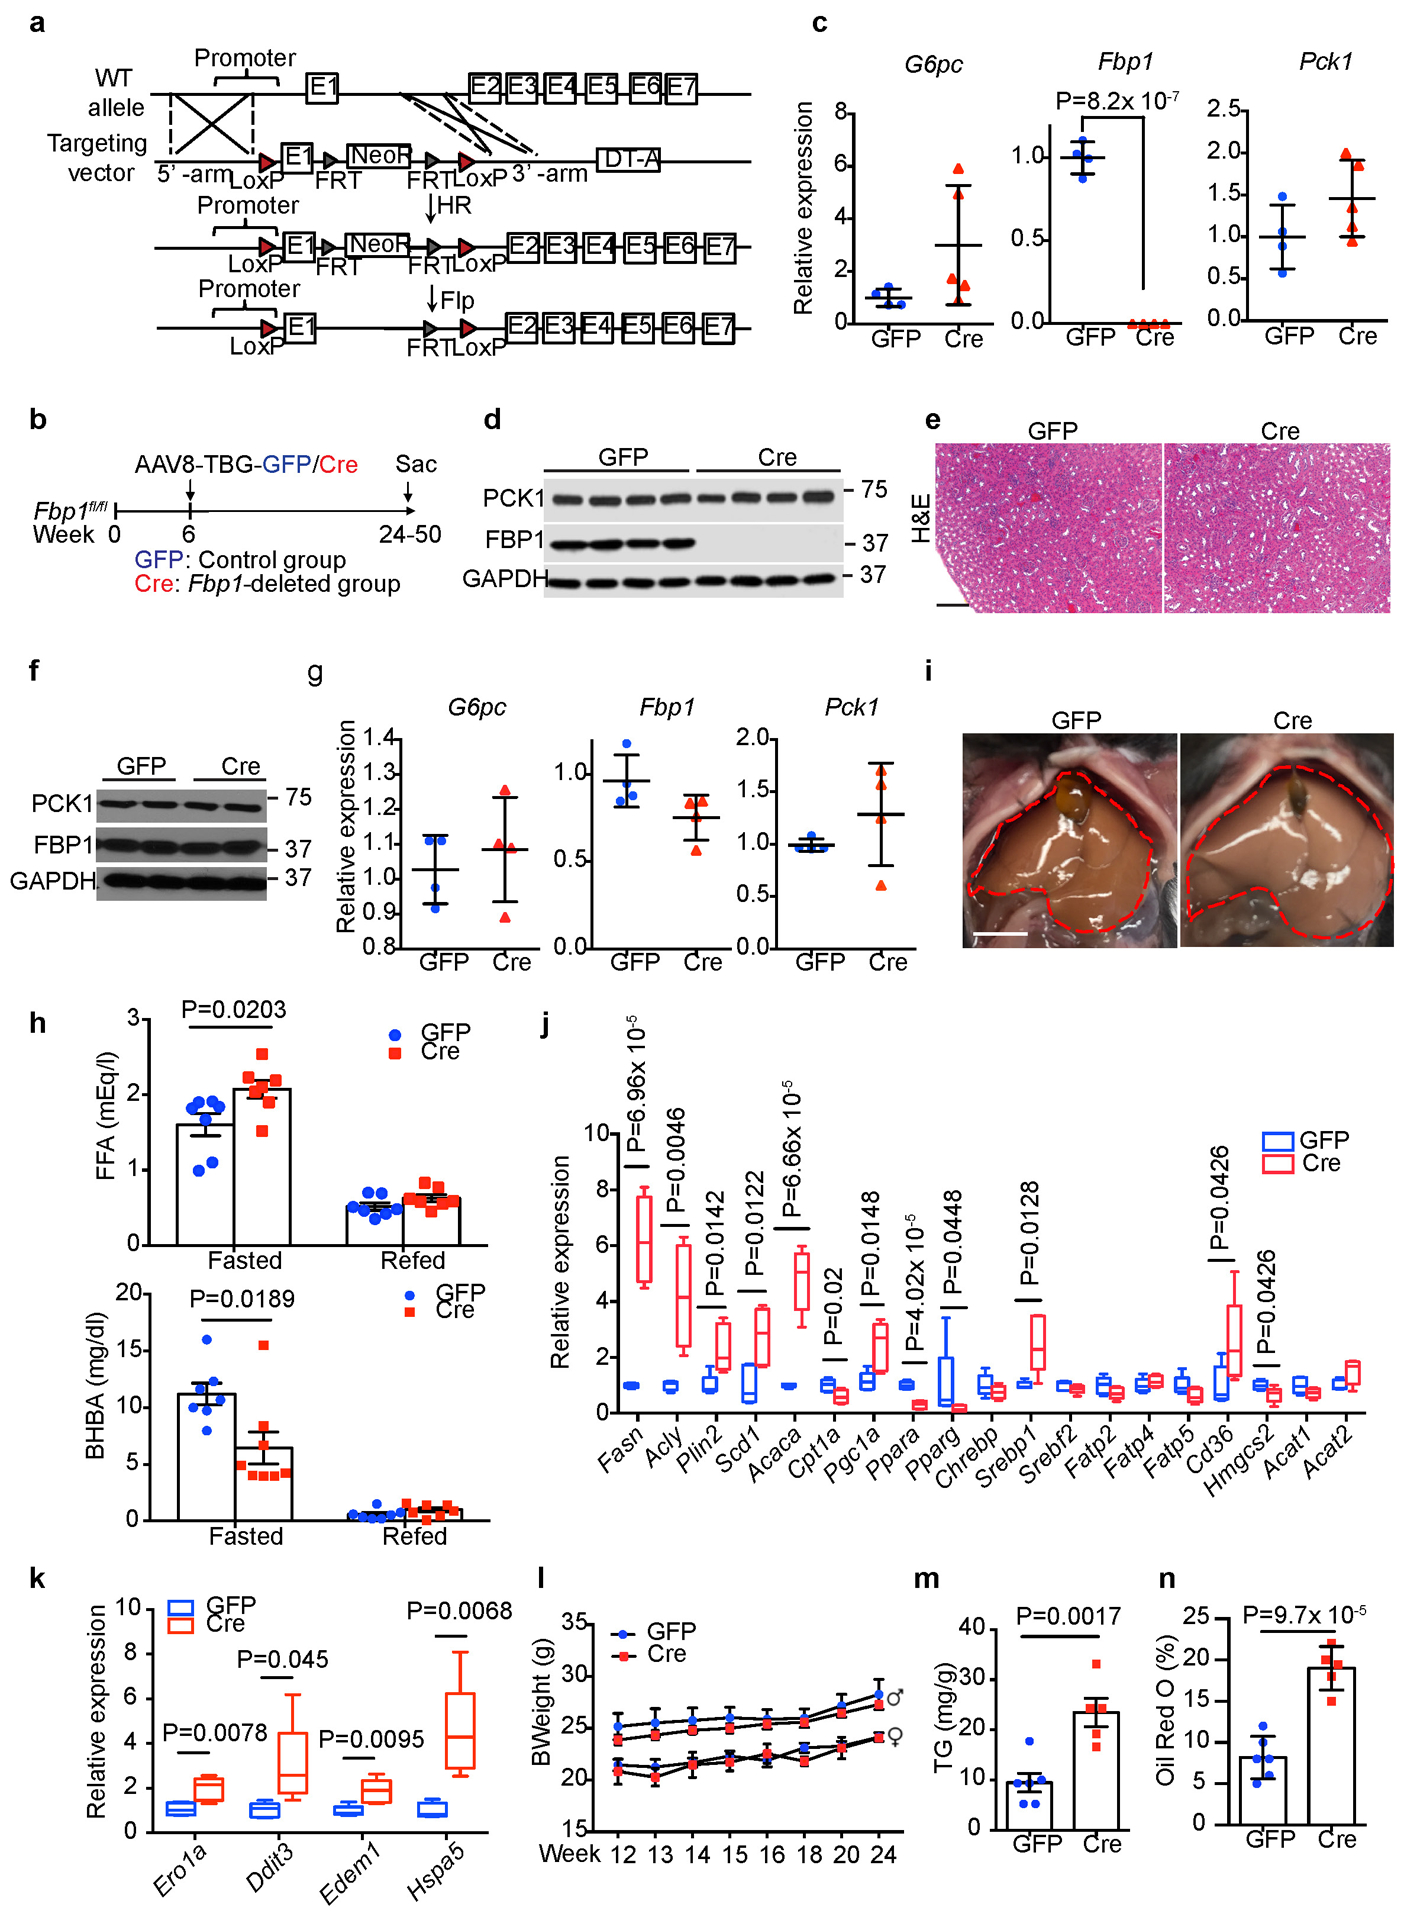
(a) Scheme for generating Fbp1fl/fl mice by homologous recombination. (b) Scheme for hepatocyte-specific Fbp1 deletion in Fbp1fl/fl mice. (c) qRT-PCR analysis of gluconeogenic gene expression in 24-week GFP (n=4) and Cre (n=4) livers. (d) Immunoblotting analysis of 24-week GFP and Cre livers (n = 3 independent experiments). GAPDH was used as loading control. (e) H&E staining of 24-week GFP and Cre kidney sections (n = 3 independent experiments). Scale bar: 100 μm. (f) Immunoblotting analysis of 24-week GFP (n=2) and Cre (n=2) kidneys. GAPDH was used as loading control. (g) qRT-PCR analysis of gluconeogenic gene expression in 24-week GFP (n=4) and Cre (n=4) kidneys. (h) Serum free fatty acid (FFA) and β-hydroxybutyrate (BHBA) levels of fasted (16-h) and refed (4-h) GFP (n=7) and Cre (n=8) mice (24-week). (i) Liver gross appearance of 16-h fasted animals (24-week) (n = 3 independent experiments). (j, k) qRT-PCR analysis of lipid metabolism (j) and unfolded protein response (UPR) (k) gene signatures in 16-h fasted GFP (n=5) and Cre (n=5) livers (24-week). In each box plot, the top-most line is the maximum, the top of the box is the third quartile, the centre line is the median, the bottom of the box is the first quartile and the bottom-most line is the minimum. (l) Growth rates of GFP and Cre mice. GFP: n=5 for female or male mice, Cre: n=5 for female, n=8 for male mice. (m, n) Quantification of triglyceride (TG) (m) and Oil Red O staining (% area) (n) in 24-week GFP (n=6) and Cre (n=5) mouse livers. Graphs in c, g, h, l-n show mean ± SEM. All P values were calculated using a two-tailed t-test. Scanned images of unprocessed blots in c and e are shown in Source Data Extended Data Fig.2. Numerical source data are provided in Source Data Extended Data Fig. 2.
Extended Data Fig. 3. Hepatic FBP1 loss promotes tumour progression in p53fl/fl and NAFLD models.
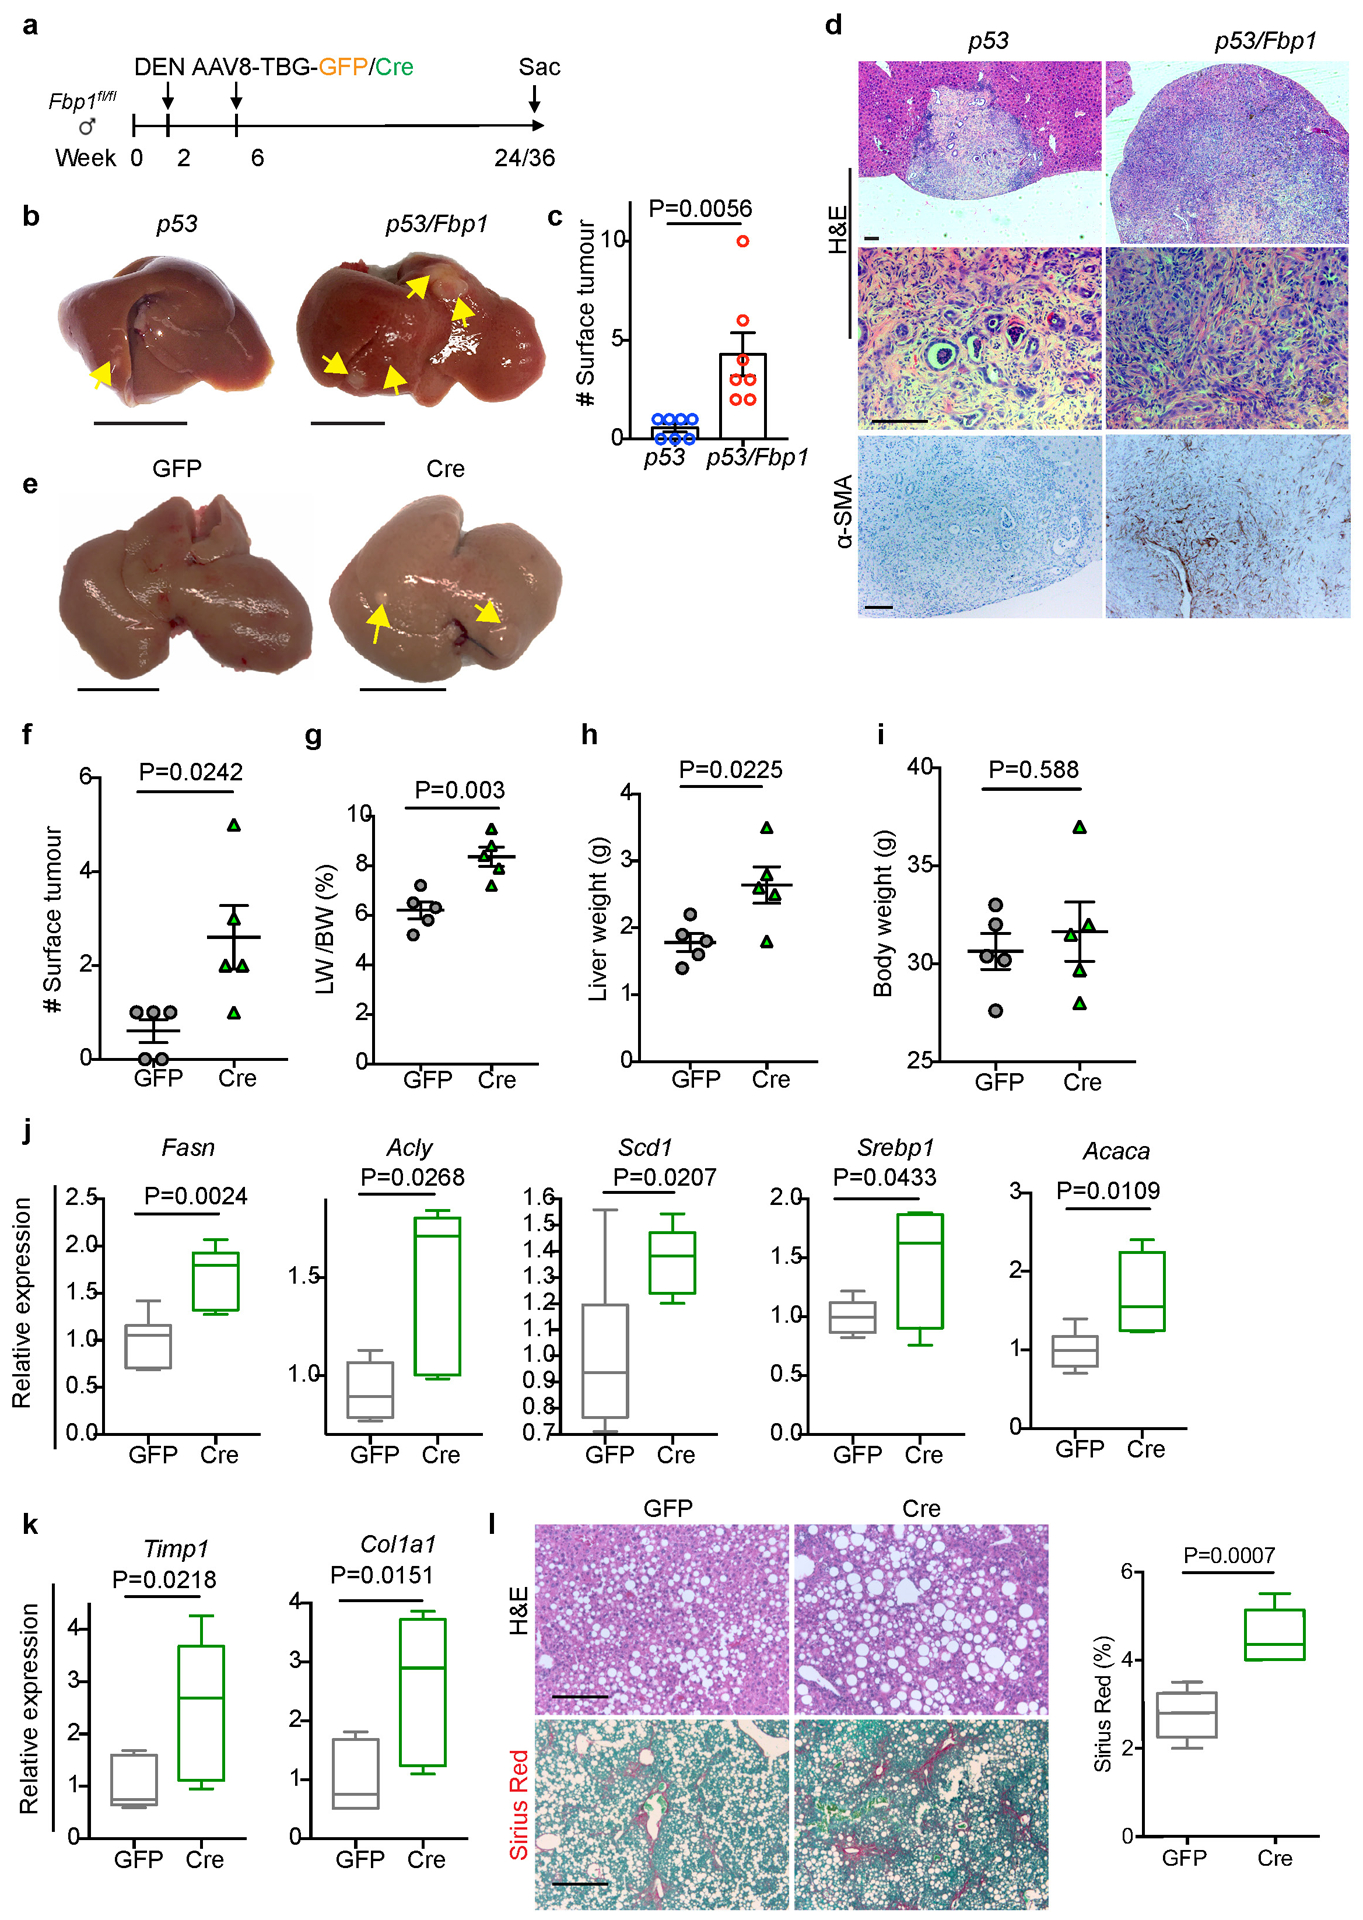
(a) Scheme for Fbp1 deletion in DEN-induced liver cancer model. b, Gross liver appearance and tumour multiplicity in 80-week p53 and p53/Fbp1 mice treated with AAV8-TBG-Cre. Yellow arrows indicate liver tumours. Scale bar: 1 cm. (c) Quantification of surface tumour numbers in p53 and p53/Fbp1 animals in (b). n=7 mice for p53 or p53/Fbp1 cohorts. 4 of 7 p53 mice and 7 of 7 p53/Fbp1 mice had surface tumours. (d) Representative H&E staining and α-SMA IHC staining of liver sections from 80-wk p53 and p53/Fbp1 mice (n=3 independent experiments). Scale bar: 100 μm. (e) Gross liver appearances of 32-wk GFP and Cre mice with diet- and CCl4-induced NAFLD (see Materials and Methods for details). Scale bar: 1 cm. (f-i) Quantification of surface tumour number (f), liver-to-body weight ratio (g), liver weight (h) and body weight (i) in 32-wk GFP (n=5) and Cre (n=5) mice with NAFLD. (j, k) qRT-PCR analysis of lipogenic (j) and fibrotic (k) gene expression from 32-wk GFP (n=5) and Cre (n=5) mouse livers with NAFLD. (l) Representative H&E staining, Sirius Red staining of 32-wk GFP and Cre NAFLD mouse liver sections (n=3 independent experiments). Scale bar: 100 μm. (m) Quantification of Sirius Red staining in (l). n=5 mice for each group. All graphs represent the mean ± SEM. In each box plot of j, k and m, the top-most line is the maximum, the top of the box is the third quartile, the centre line is the median, the bottom of the box is the first quartile and the bottom-most line is the minimum. Graphs in c, f-I show mean ± SEM. All P values were calculated using a two-tailed t-test. Numerical source data are provided in Source Data Extended Data Fig. 3.
Extended Data Fig. 4. Impact of hepatic FBP1 loss on tumour microenvironment in DEN mice.
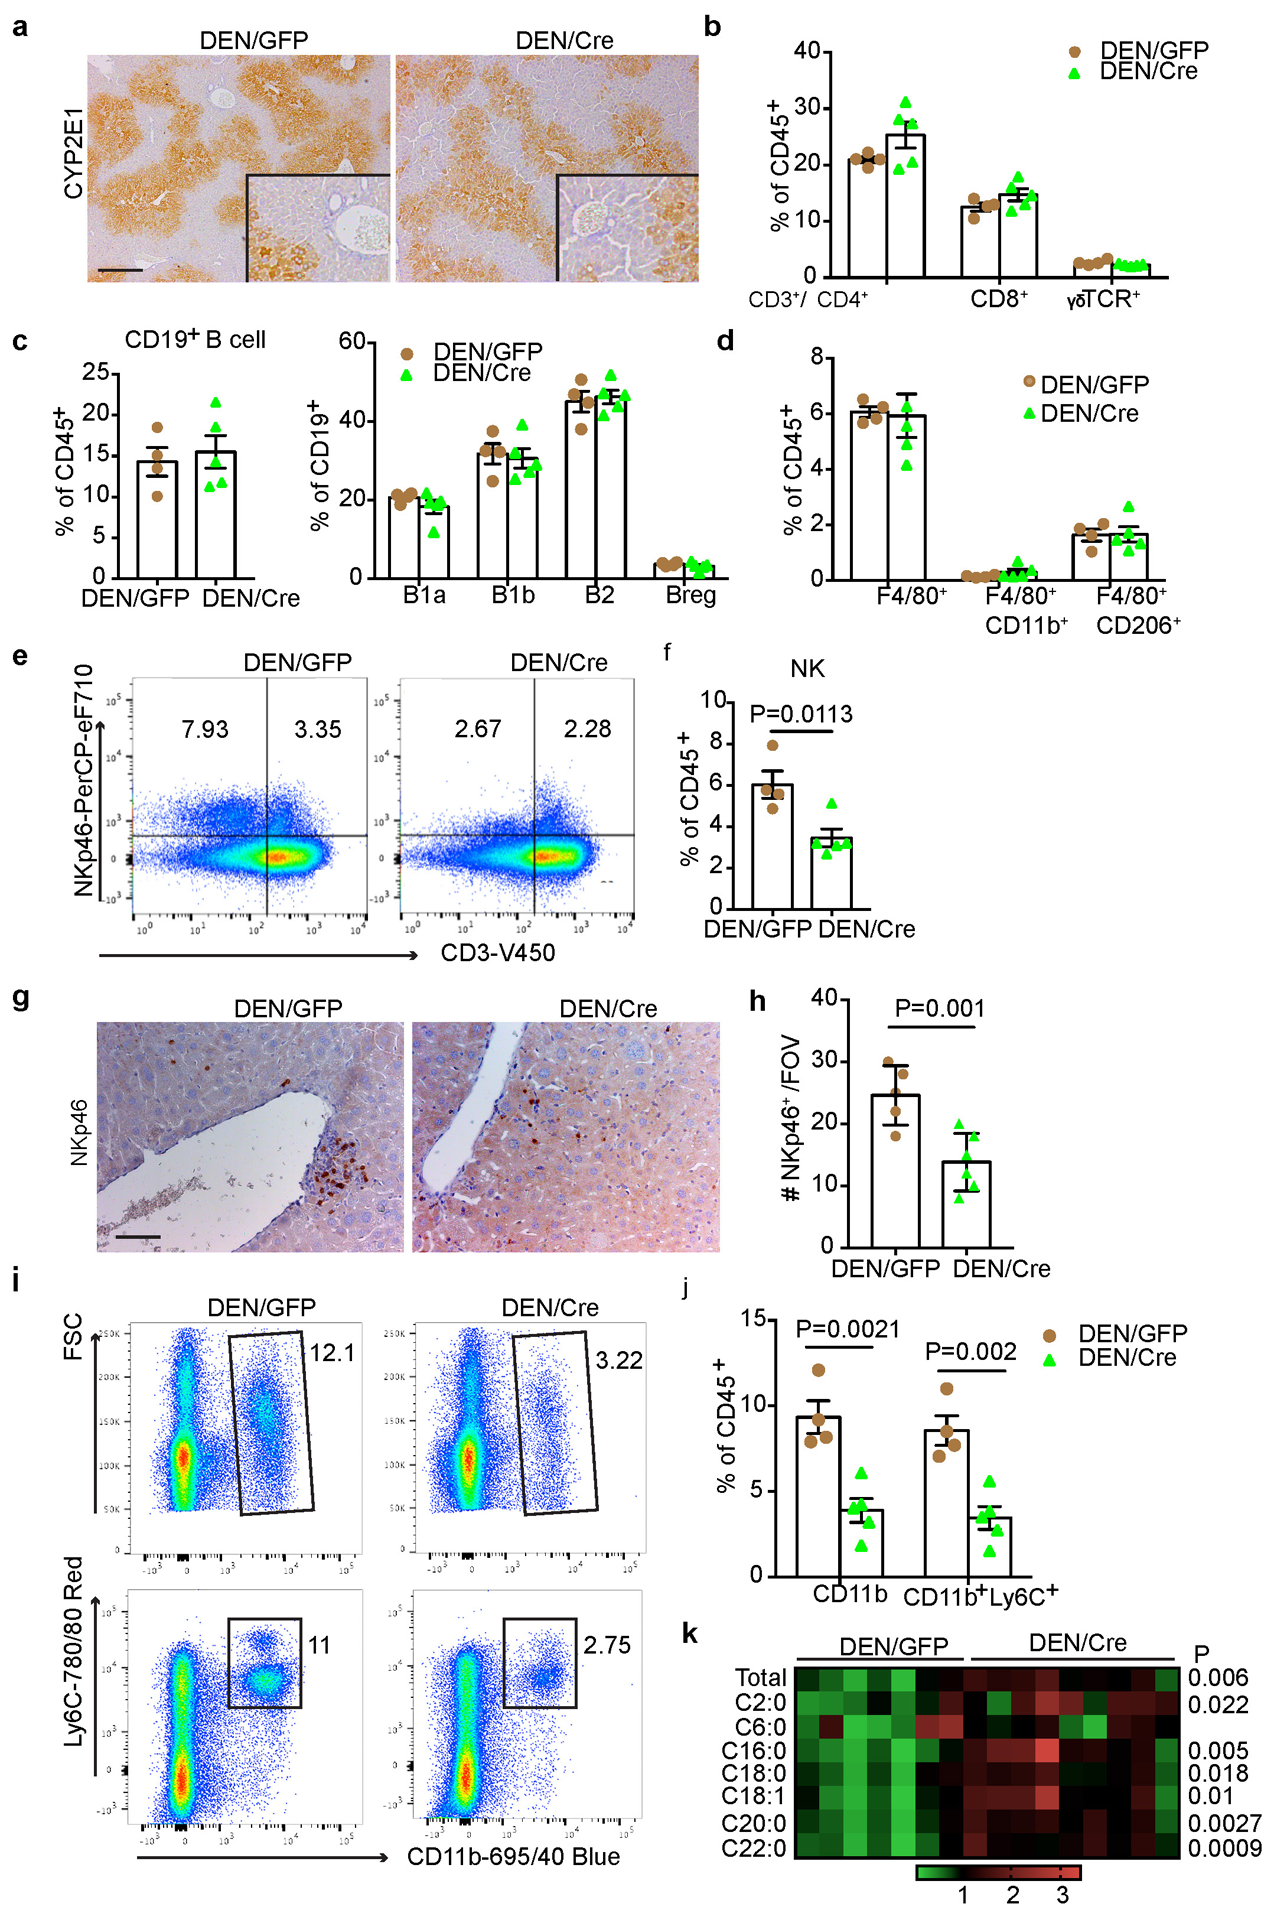
(a) Representative CYP2E1 IHC staining in liver sections from 24-week DEN/GFP and DEN/Cre mice (n=3 independent experiments). Scale bar: 100 μm. (b) Flow cytometry quantification of T cell subpopulations in 24-week DEN/GFP (n=4) and DEN/Cre (n=5) livers. (c) Flow cytometry quantification of B cells and B cell subpopulations in 24-week DEN/GFP (n=4) and DEN/Cre (n=5) livers. (d) Flow cytometry quantification of total macrophages and CD11b+ or CD206+ subsets in 24-week DEN/GFP (n=4) and DEN/Cre (n=5) livers. (e, f) Representative flow cytometry plots (e) and quantification (f) (% CD45+ cells) of NK cells (CD3−NKp46+) in 24-week DEN/GFP (n=4) and DEN/Cre (n=5) livers. (g, h) Representative NKp46 IHC staining (g) and quantification (h) in 24-wk DEN/GFP (n=4) and DEN/Cre (n=5) liver sections. Scale bar: 100 μm. (i, j) Representative flow cytometry plots (i) and quantification (j) (% CD45+ cells) of MDSC cells (CD11b+Ly6C+) in 24-week DEN/GFP (n=4) and DEN/Cre (n=5) livers. (k) A heatmap showing relative abundance of individual ceramide species in 24-wk DEN/GFP (N=7) and DEN/Cre (n=9) mouse livers by lipidomic profiling. Graphs in b-d, f, h and j show mean ± SEM, and P values were calculated using a two-tailed t-test. Numerical source data are provided in Source Data Extended Data Fig. 4.
Extended Data Fig. 5. Hepatic FBP1 loss leads to HSC activation and senescence.
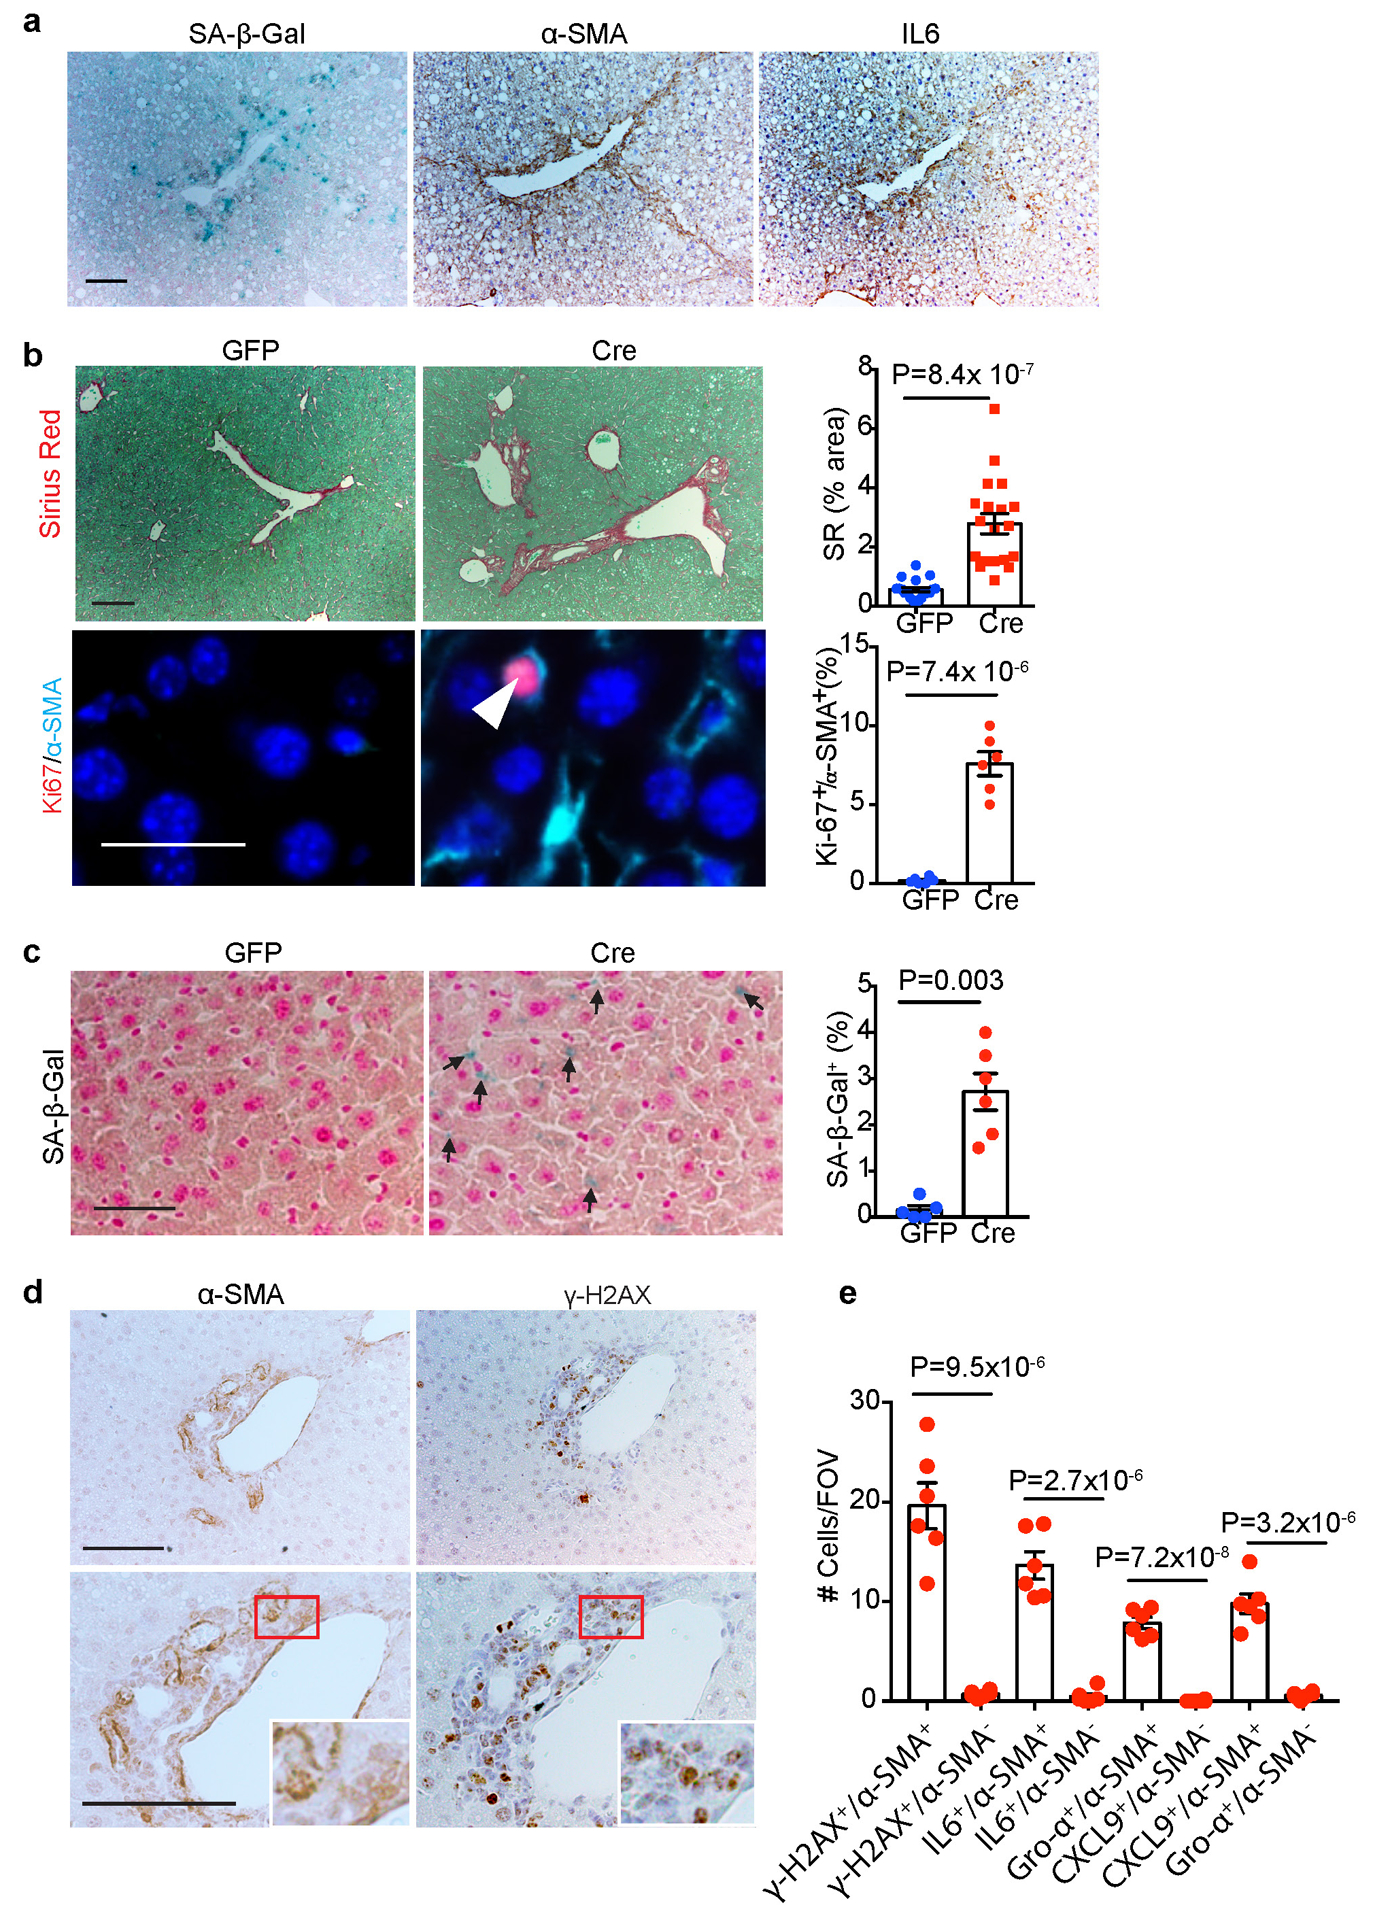
(a) Representative SA-β-Gal staining, α-SMA and IL6 IHC staining of serial cryosections from 36-week mouse livers (n=3 independent experiments). Scale bar: 100 μm. (b) Representative Sirius Red staining and quantification, Ki67/α-SMA IF staining and quantification of 24-week non-DEN liver sections. For Sirius Red staining quantification, n=20 fields of view (FOV, 200x) from 6 mice for GFP, n=18 fields of view (FOV, 200x) from 6 mice for Cre. For Ki67/α-SMA IF staining quantification, n=6 mice for each group. Scale bar: 100 μm. (c) SA-β-Gal staining and quantification (% of cells) in 24-week liver sections from non-DEN mice. Black arrows indicate SA-β-Gal staining. n=6 mice for each group. Scale bar: 100 μm. (d) α-SMA and γ-H2AX IHC staining of 24-week non-DEN Cre liver sections. Scale bar: 100 μm. (e) Quantification of α-SMA/γ-H2AX IHC staining and SASP component IF staining of 24-week non-DEN Cre (n=6) liver sections. Graphs in b, c and e show mean ± SEM, and P values were calculated using a two-tailed t-test. Numerical source data are provided in Source Data Extended Data Fig. 5.
Extended Data Fig. 6. In vitro Characterization of senolytic effects of D+Q and ABT-263.
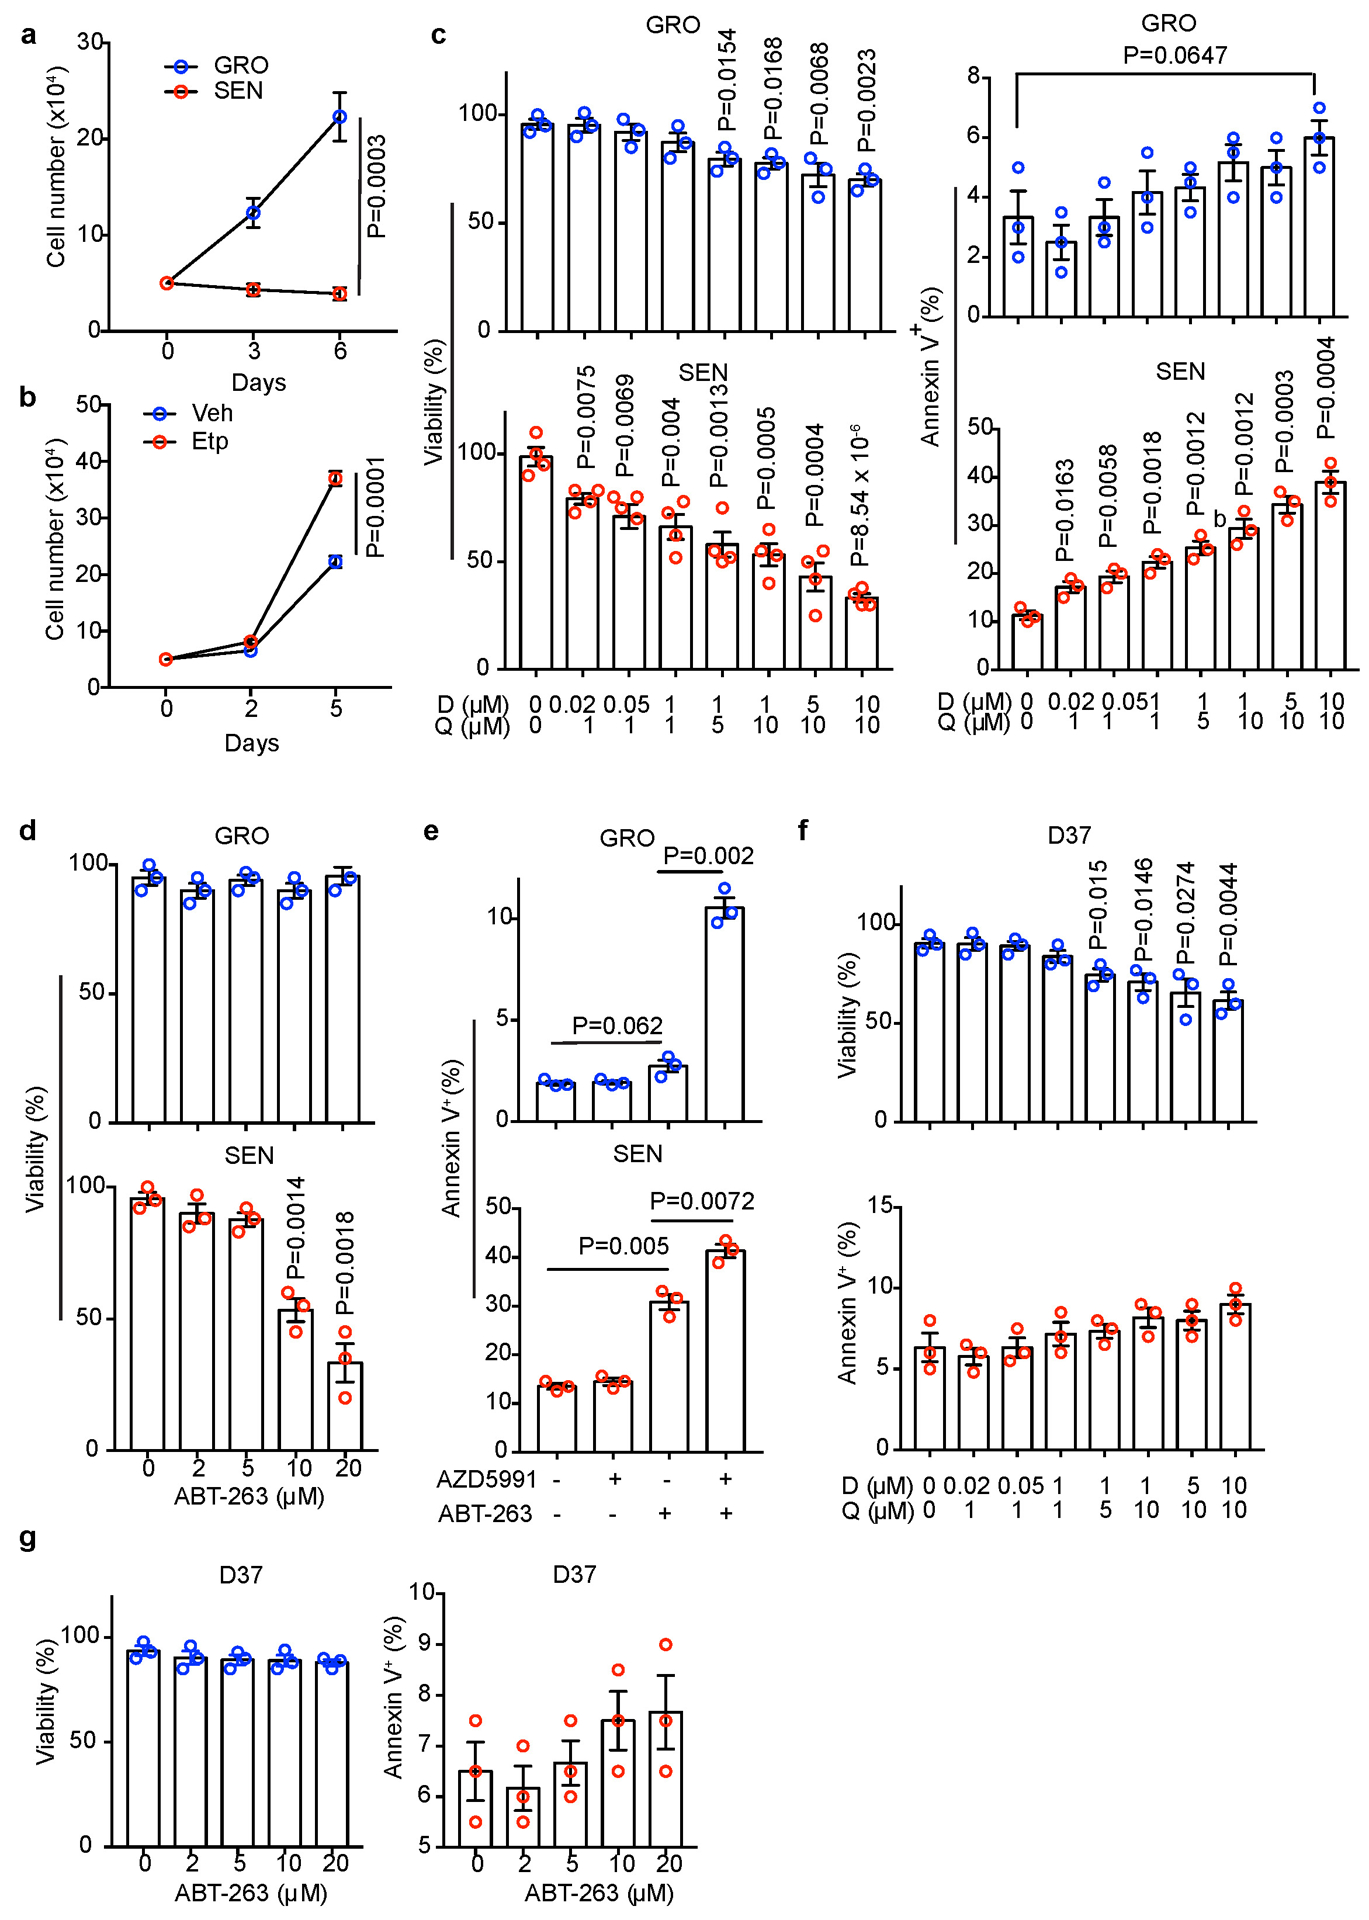
(a) Growth curves of GRO and SEN human HSCs under 3% O2 (to prevent senescence due to oxidative damage) in regular medium (n=3 independent experiments). (b) Growth curves of mouse D37 cells under 3% O2 in conditioned medium from Vehicle (Veh) or etoposide (Etp)-treated mouse HSCs (n=3 independent experiments). (c) Viability or apoptosis (% Annexin V+) quantification of GRO or SEN human HSCs after D+Q treatment at indicated concentrations/combinations (n=3 or independent experiments). (d) Viability or apoptosis (% Annexin V+) quantification of GRO or SEN human HSCs after treatment with ABT-263 at indicated concentrations (n=3 independent experiments). (e) Apoptosis (% Annexin V+) quantification of GRO or SEN human HSCs after treatment with indicated AZD5991 (50 nM) and ABT-263 (10 μM) combinations (n=3 independent experiments). (f) Viability or apoptosis (% Annexin V+) quantification of mouse D37 cells after D+Q treatment at indicated concentrations/combinations (n=3 independent experiments). (g) Mouse D37 cell viability or apoptosis (% Annexin V+) quantification after treatment with indicated ABT-263 concentrations (n=3 independent experiments). All graphs show mean ± SEM, and P values were calculated using a two-tailed t-test. Numerical source data are provided in Source Data Extended Data Fig. 6.
Extended Data Fig. 7. Characterizing the senolytic effects of D+Q and ABT-263 in vivo.
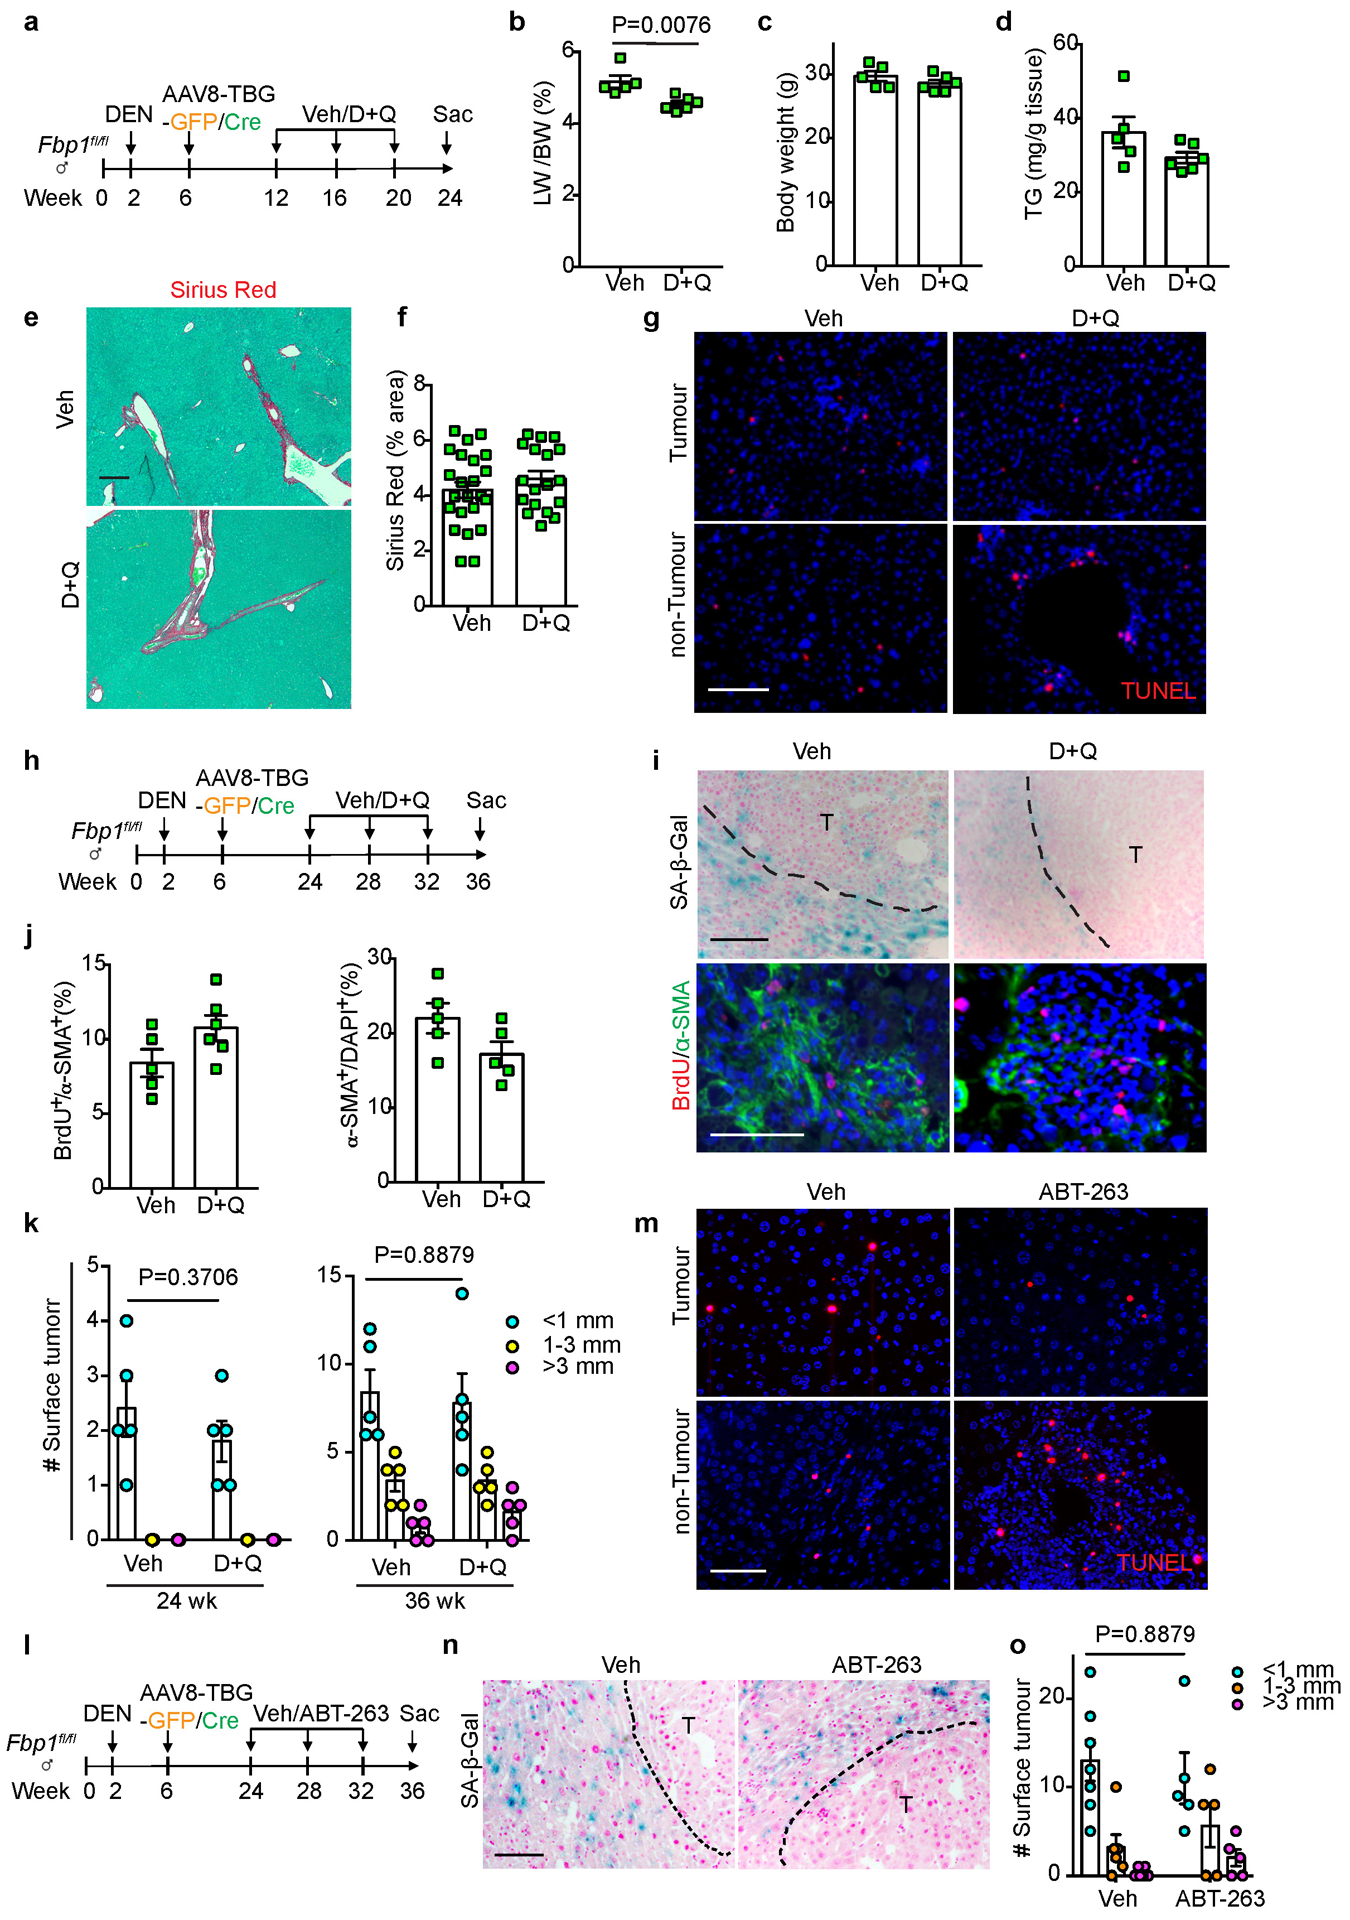
(a) Scheme of early stage Veh and D+Q treatment of DEN/GFP or DEN/Cre mice. (b, c) Liver-to-Body Weight (LW/BW) ratio (b) and body weight (c) quantifications of 24-week Veh (n=5) and D+Q (n=6) DEN/Cre mice. (d) Quantification of TG levels from 24-week Veh (n=5) and D+Q (n=6) DEN/Cre mouse livers. (e, f) Representative Sirius Red staining (e) and quantification (f) of 24-week Veh (n=25) and D+Q (n=20) DEN/Cre mouse liver sections. FOV: 200x fields of view. Scale bar: 100 μm. (g) TUNEL staining of 24-week Veh and D+Q DEN/Cre mouse liver sections (n=3 independent experiments). Scale bar: 100 μm. (h) Scheme of late stage Veh and D+Q treatment of DEN/GFP or DEN/Cre mice. (i) Representative SA-β-Gal staining (n=3 independent experiments), and BrdU/α-SMA IF staining of 36-week Veh and D+Q DEN/Cre mouse liver sections. Scale bar: 100 μm. (j) Quantification of BrdU and α-SMA IF staining of 36-week Veh (n=5) and D+Q (n=6) DEN/Cre mouse liver sections. (k) Surface tumour number and size distributions of 24 wk or 36 wk DEN/GFP mice treated with Veh or D+Q. n=5 mice for each cohort at each time point. (l) Scheme of Veh and ABT-263 treatment of DEN/GFP or DEN/Cre mice. (m) Representative TUNEL staining of 36-week Veh and ABT-263-treated DEN/Cre mouse liver sections (n=3 independent experiments). Scale bar: 100 μm. (n) SA-β-Gal staining of 36-week Veh and ABT-263-treated DEN/Cre mouse liver sections (n=3 independent experiments). Scale bar: 100 μm. (o) Surface tumour number and size distributions of DEN/GFP mice treated with Veh (n=5) or ABT-263 (n=5). Graphs in b-d, f, j, k and o show mean ± SEM, and P values were calculated using a two-tailed t-test. Numerical source data are provided in Scanned images of unprocessed blots in Source Data Extended Data Fig. 7.
Extended Data Fig. 8. Identification of HMGB1 as a potential mediator between FBP1-deficient hepatocytes and HSCs.
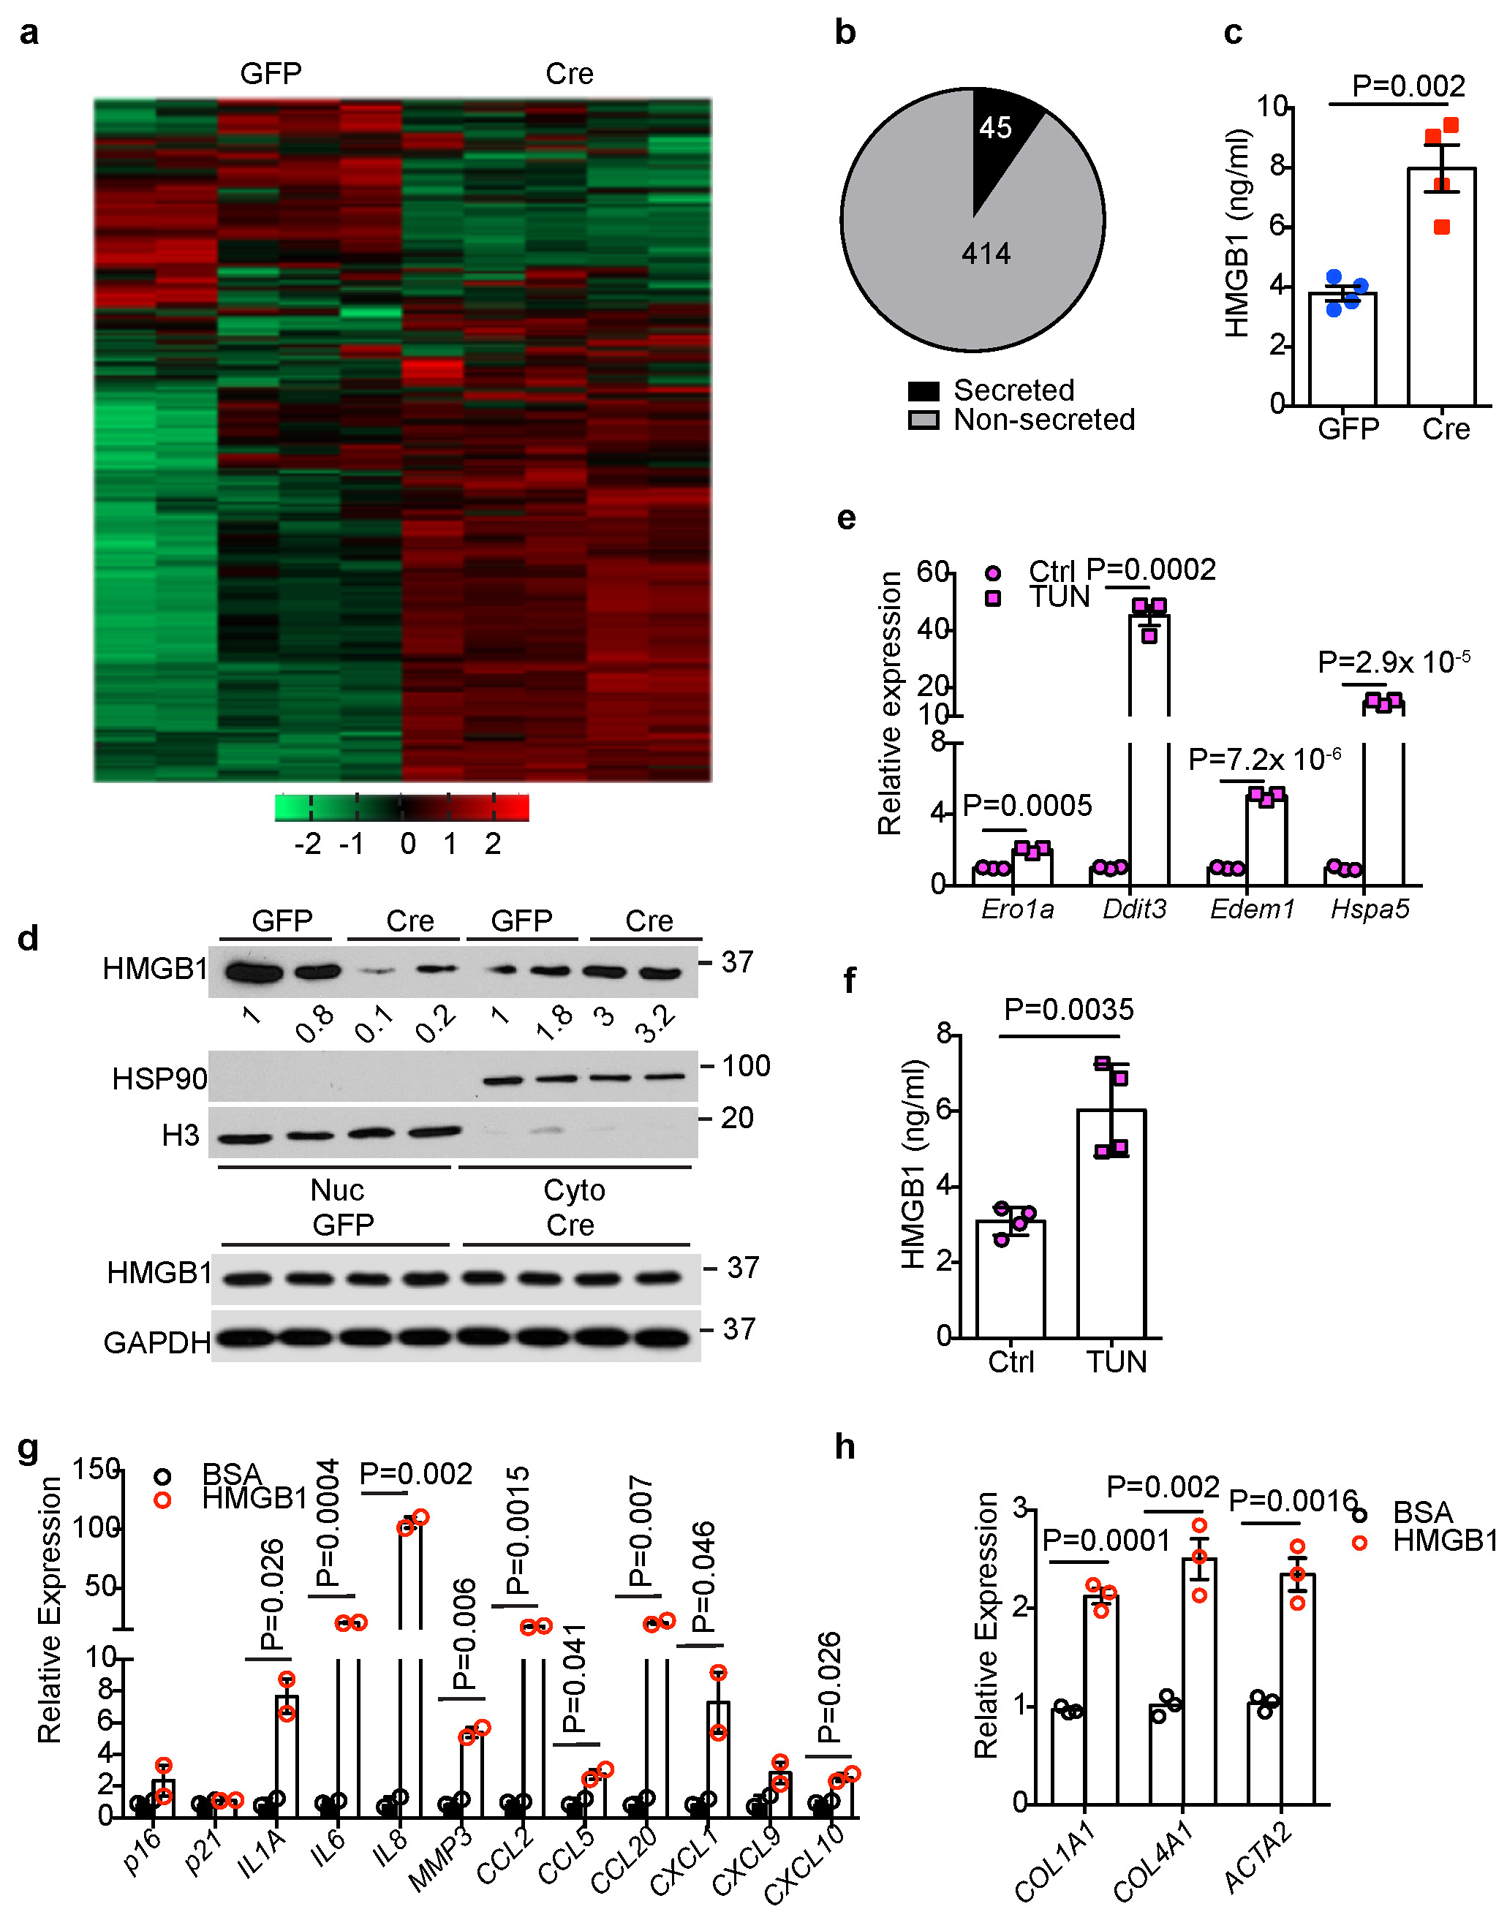
(a) Unsupervised hierarchical clustering of normalized protein abundance in CM of 24-week Non-DEN GFP (n=5) and Cre (n=5) hepatocytes. (b) An Egyptian Pie Chart of 459 proteins with >=1.5-fold change (adjusted p<0.05) of abundance in CM between Non-DEN GFP (n=5) and Cre (n=5) groups. (c) ELISA-based quantification of HMGB1 levels in CM of 24-week Non-DEN GFP (n=4) or Cre (n=4) hepatocytes. (d) Immunoblotting analysis of HMGB1 in the nuclear (Nuc) and cytosolic (Cyto) fractions or total lysates from 24-week non-DEN GFP (n=2) and Cre (n=2) mouse livers. H3 and HSP90 were used as loading control for nuclear and cytosolic fractions, respectively. GAPDH was used as loading control for whole tissue lysates. (e) qRT-PCR analysis of UPR gene expression in mouse primary hepatocytes after tunicamycin (TUN) treatment (n=3 independent experiments). (f) ELISA-based quantification of HMGB1 levels in primary hepatocyte culture medium of Ctrl and TUN groups (n=3 independent experiments). (g, h) qRT-PCR analysis of SASP (g) or fibrotic (h) gene expression in human HSCs after 1 nM HMGB1 treatment for 15 h (n=3 independent experiments). Graphs in c, e, f-h show represent the mean ± SEM, and P values were calculated using a two-tailed t-test. Scanned images of unprocessed blots in d are shown in Source Data Extended Data Fig.8. Numerical source data are provided in Source Data Extended Data Fig. 8.
Extended Data Fig. 9. Characterization of in vivo and in vitro ICM treatment.
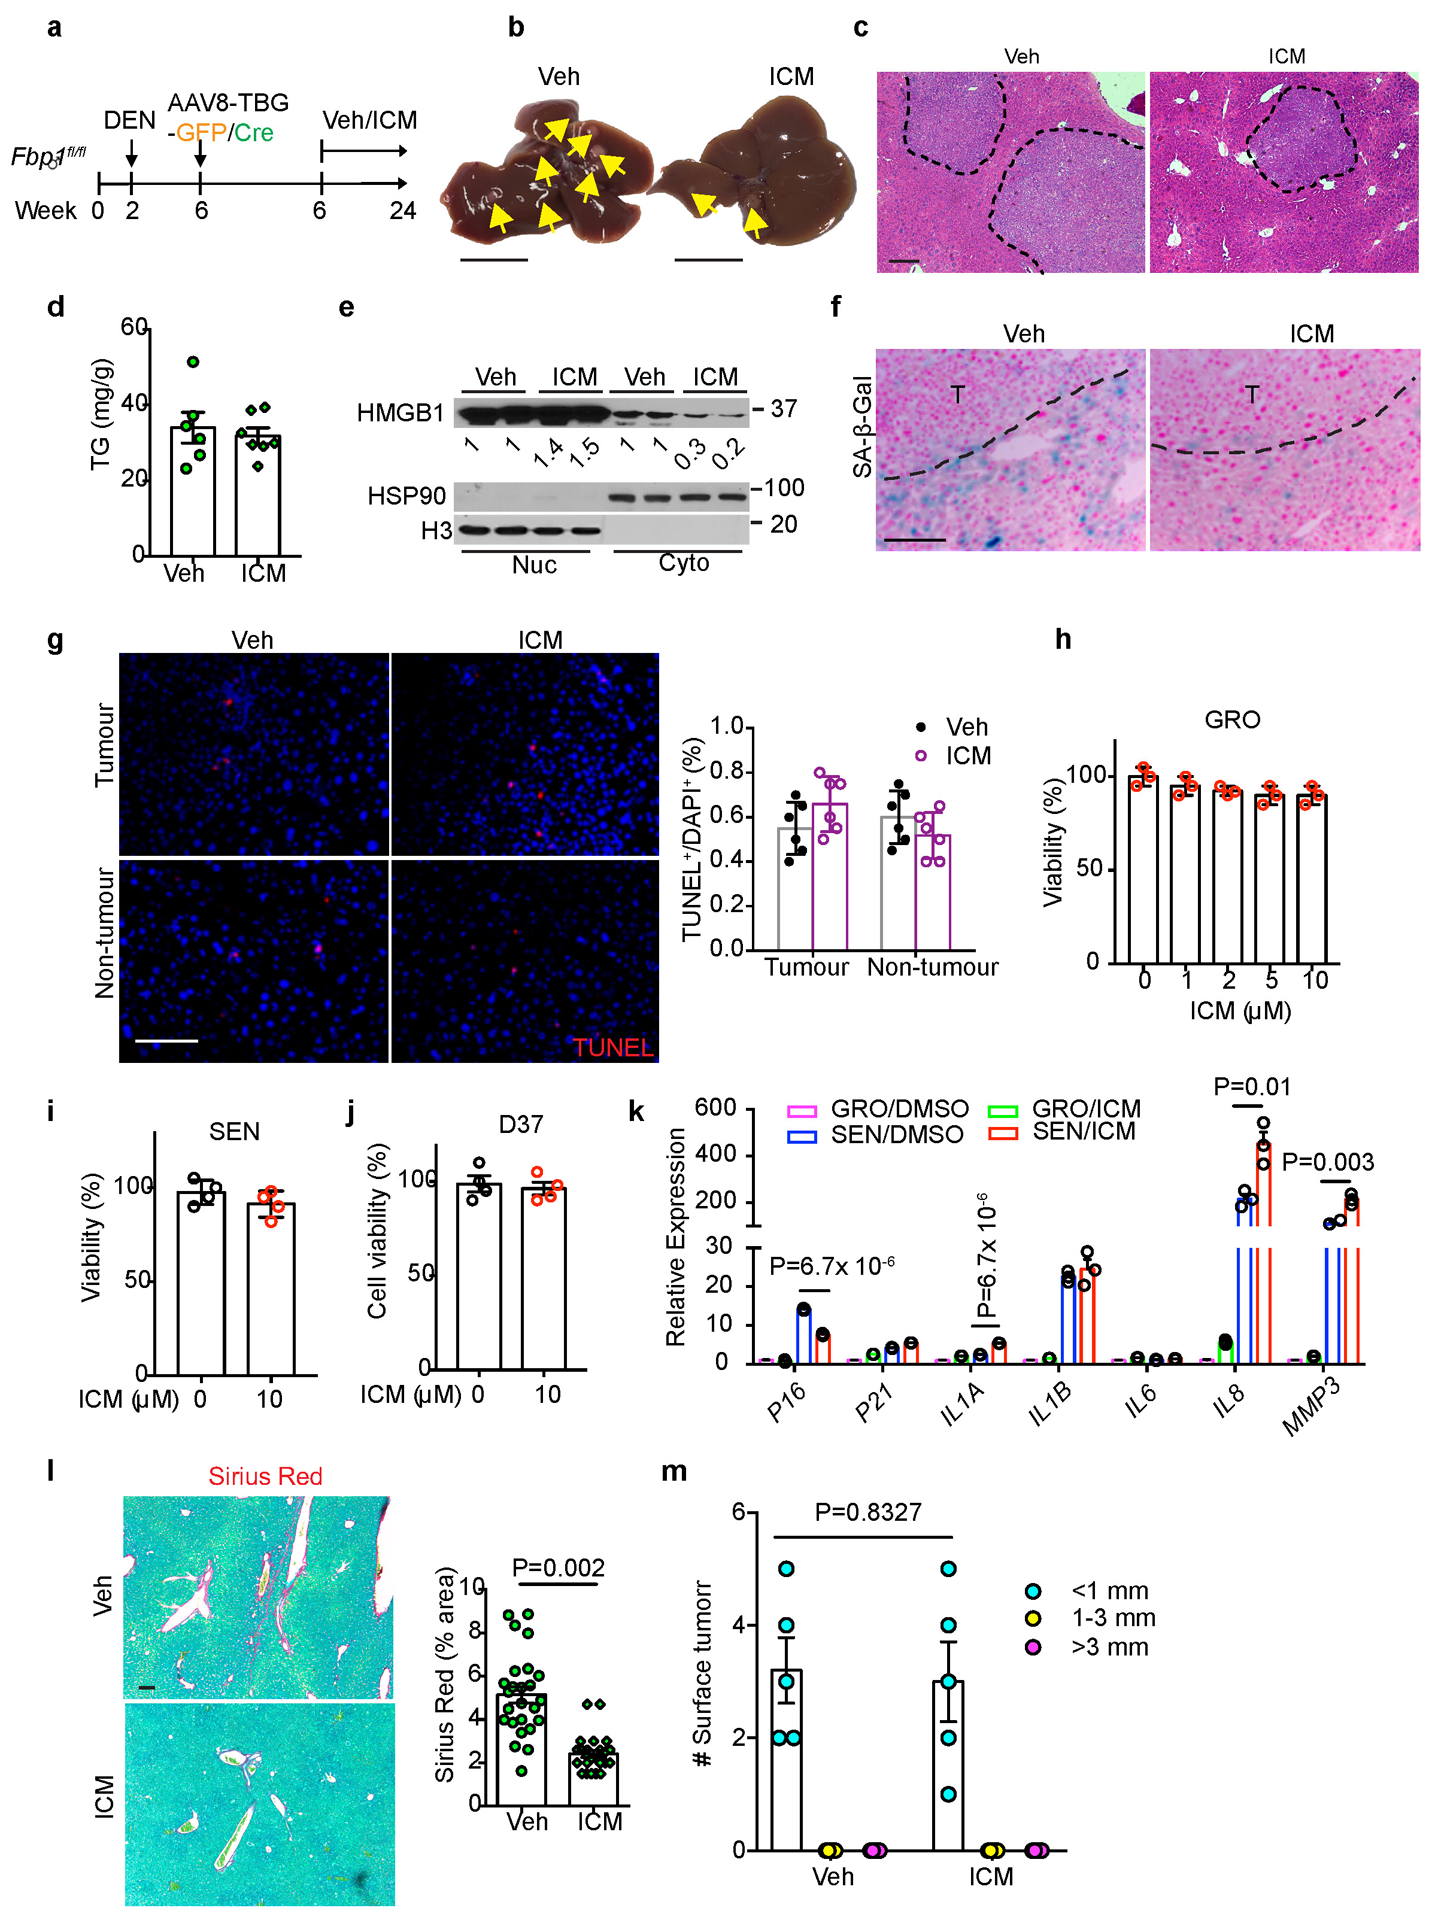
(a) Scheme for Veh and ICM treatment of DEN/GFP and DEN/Cre mice. (b) Gross liver appearances and tumour multiplicity (indicated by yellow arrows) in Veh and ICM DEN/Cre mice. Scale bar: 1 cm. (c) H&E staining of Veh (n=6) and ICM (n=7) DEN/Cre mouse liver sections. Scale bar: 100 μm. (d) Quantification of TG levels in Veh (n=6) and ICM (n=7) DEN/Cre mouse livers. (e) Immunoblotting analysis of HMGB1 in nuclear (Nuc) and Cytosolic (Cyto) fractions of Veh (n=2) and ICM (n=2) DEN/Cre livers. H3 and HSP90 were used as loading control for nuclear and cytosolic fractions, respectively. (f) SA-β-Gal staining of Veh (n=6) and ICM (n=7) DEN/Cre mouse liver sections. Scale bar: 100 μm. (g) TUNEL staining and quantification of Veh (n=6) and ICM (n=6) DEN/Cre mouse liver sections. Scale bar: 100 μm. (h) Cell viability assays of GRO human HSCs after ICM treatment (n=3 independent experiments). (I, j) Cell viability assays in SEN human HSCs (i) or mouse D37 cells (j) after ICM (10 μM) treatment (n=3 independent experiments). (k) qRT-PCR analysis of SASP gene expression in human HSCs after 10 μM ICM treatment for 24 h (n=3 independent experiments). (l) Representative Sirius Red staining and quantification (% area) of Veh (n=25 FOV) and ICM (n=21) DEN/Cre mouse liver sections. FOV: fields of view. Scale bar: 100 μm. (m) Quantification of surface tumour number and size distributions from DEN/GFP mice treated with Veh (n=5) or ICM (n=5). Graphs in d, g-m show mean ± SEM, and P values were calculated using a two-tailed t-test. Scanned images of unprocessed blots in e are shown in Source Data Extended Data Fig.9. Numerical source data are provided in Source Data Extended Data Fig. 9.
Supplementary Material
Acknowledgements
We thank Simon laboratory members for helpful discussion and insights on the manuscript. We also thank Dr. Shelley Berger for critical reading of the manuscript, and Dr. Kathryn E. Wellen for providing the D37 cells. Dr. Hsin-Yao Tang assisted in hepatocyte secretome profiling and data analysis. Dr. Clementina Mesaros and Dr. Liwei Weng assisted in lipid profiling and data analysis. We are grateful to Dr. John Tobias for help with processing the human TCGA and mouse RNA-seq data, and Dr. Amy Durham for histopathologic examination. We also thank William Quinn, III, Allyson J. Merrell, Hong Xie and Hannah Weinstein for technical assistance. This work was supported by the National Key Research and Development Program (2016YFA0502600) of China (to B.L.) and National Cancer Institute (NCI) grants P01CA104838, R35CA197602 and P30CA016520 (to M.C.S.).
Footnotes
Competing interests
The authors declare no competing financial interests.
References
- 1.Siegel RL, Miller KD & Jemal A Cancer Statistics, 2017. CA Cancer J Clin 67, 7–30 (2017). [DOI] [PubMed] [Google Scholar]
- 2.TCGA Comprehensive and Integrative Genomic Characterization of Hepatocellular Carcinoma. Cell 169, 1327–1341 e1323 (2017). [DOI] [PMC free article] [PubMed] [Google Scholar]
- 3.Greten TF, Wang XW & Korangy F Current concepts of immune based treatments for patients with HCC: from basic science to novel treatment approaches. Gut 64, 842–848 (2015). [DOI] [PMC free article] [PubMed] [Google Scholar]
- 4.Ringelhan M, Pfister D, O’Connor T, Pikarsky E & Heikenwalder M The immunology of hepatocellular carcinoma. Nat Immunol 19, 222–232 (2018). [DOI] [PubMed] [Google Scholar]
- 5.Friedman SL Hepatic stellate cells: protean, multifunctional, and enigmatic cells of the liver. Physiol Rev 88, 125–172 (2008). [DOI] [PMC free article] [PubMed] [Google Scholar]
- 6.Affo S, Yu LX & Schwabe RF The Role of Cancer-Associated Fibroblasts and Fibrosis in Liver Cancer. Annu Rev Pathol 12, 153–186 (2017). [DOI] [PMC free article] [PubMed] [Google Scholar]
- 7.Gomes AL et al. Metabolic Inflammation-Associated IL-17A Causes Non-alcoholic Steatohepatitis and Hepatocellular Carcinoma. Cancer Cell 30, 161–175 (2016). [DOI] [PubMed] [Google Scholar]
- 8.Ma C et al. NAFLD causes selective CD4(+) T lymphocyte loss and promotes hepatocarcinogenesis. Nature 531, 253–257 (2016). [DOI] [PMC free article] [PubMed] [Google Scholar]
- 9.Shalapour S et al. Inflammation-induced IgA+ cells dismantle anti-liver cancer immunity. Nature 551, 340–345 (2017). [DOI] [PMC free article] [PubMed] [Google Scholar]
- 10.Friedman SL, Neuschwander-Tetri BA, Rinella M & Sanyal AJ Mechanisms of NAFLD development and therapeutic strategies. Nat Med 24, 908–922 (2018). [DOI] [PMC free article] [PubMed] [Google Scholar]
- 11.Arab JP, Arrese M & Trauner M Recent Insights into the Pathogenesis of Nonalcoholic Fatty Liver Disease. Annu Rev Pathol 13, 321–350 (2018). [DOI] [PubMed] [Google Scholar]
- 12.Michelotti GA, Machado MV & Diehl AM NAFLD, NASH and liver cancer. Nat Rev Gastroenterol Hepatol 10, 656–665 (2013). [DOI] [PubMed] [Google Scholar]
- 13.Dong C et al. Loss of FBP1 by Snail-mediated repression provides metabolic advantages in basal-like breast cancer. Cancer Cell 23, 316–331 (2013). [DOI] [PMC free article] [PubMed] [Google Scholar]
- 14.Hirata H et al. Decreased Expression of Fructose-1,6-bisphosphatase Associates with Glucose Metabolism and Tumor Progression in Hepatocellular Carcinoma. Cancer Res 76, 3265–3276 (2016). [DOI] [PubMed] [Google Scholar]
- 15.Li B et al. Fructose-1,6-bisphosphatase opposes renal carcinoma progression. Nature 513, 251–255 (2014). [DOI] [PMC free article] [PubMed] [Google Scholar]
- 16.Gebhardt R Metabolic zonation of the liver: regulation and implications for liver function. Pharmacol Ther 53, 275–354 (1992). [DOI] [PubMed] [Google Scholar]
- 17.Katz SF et al. Disruption of Trp53 in livers of mice induces formation of carcinomas with bilineal differentiation. Gastroenterology 142, 1229–1239 e1223 (2012). [DOI] [PubMed] [Google Scholar]
- 18.Tschaharganeh DF et al. p53-dependent Nestin regulation links tumor suppression to cellular plasticity in liver cancer. Cell 158, 579–592 (2014). [DOI] [PMC free article] [PubMed] [Google Scholar]
- 19.Asgharpour A et al. A diet-induced animal model of non-alcoholic fatty liver disease and hepatocellular cancer. J Hepatol 65, 579–588 (2016). [DOI] [PMC free article] [PubMed] [Google Scholar]
- 20.Tsuchida T et al. A simple diet- and chemical-induced murine NASH model with rapid progression of steatohepatitis, fibrosis and liver cancer. J Hepatol 69, 385–395 (2018). [DOI] [PMC free article] [PubMed] [Google Scholar]
- 21.Arruda AP et al. Chronic enrichment of hepatic endoplasmic reticulum-mitochondria contact leads to mitochondrial dysfunction in obesity. Nat Med 20, 1427–1435 (2014). [DOI] [PMC free article] [PubMed] [Google Scholar]
- 22.Febbraio MA et al. Preclinical Models for Studying NASH-Driven HCC: How Useful Are They? Cell Metab 29, 18–26 (2019). [DOI] [PMC free article] [PubMed] [Google Scholar]
- 23.Nakagawa H et al. ER stress cooperates with hypernutrition to trigger TNF-dependent spontaneous HCC development. Cancer Cell 26, 331–343 (2014). [DOI] [PMC free article] [PubMed] [Google Scholar]
- 24.Bakiri L & Wagner EF Mouse models for liver cancer. Mol Oncol 7, 206–223 (2013). [DOI] [PMC free article] [PubMed] [Google Scholar]
- 25.He G et al. Identification of liver cancer progenitors whose malignant progression depends on autocrine IL-6 signaling. Cell 155, 384–396 (2013). [DOI] [PMC free article] [PubMed] [Google Scholar]
- 26.Krizhanovsky V et al. Senescence of activated stellate cells limits liver fibrosis. Cell 134, 657–667 (2008). [DOI] [PMC free article] [PubMed] [Google Scholar]
- 27.Yoshimoto S et al. Obesity-induced gut microbial metabolite promotes liver cancer through senescence secretome. Nature 499, 97–101 (2013). [DOI] [PubMed] [Google Scholar]
- 28.Schnabl B, Purbeck CA, Choi YH, Hagedorn CH & Brenner D Replicative senescence of activated human hepatic stellate cells is accompanied by a pronounced inflammatory but less fibrogenic phenotype. Hepatology 37, 653–664 (2003). [DOI] [PubMed] [Google Scholar]
- 29.Henderson NC et al. Targeting of alphav integrin identifies a core molecular pathway that regulates fibrosis in several organs. Nat Med 19, 1617–1624 (2013). [DOI] [PMC free article] [PubMed] [Google Scholar]
- 30.Baar MP et al. Targeted Apoptosis of Senescent Cells Restores Tissue Homeostasis in Response to Chemotoxicity and Aging. Cell 169, 132–147 e116 (2017). [DOI] [PMC free article] [PubMed] [Google Scholar]
- 31.Coppe JP, Desprez PY, Krtolica A & Campisi J The senescence-associated secretory phenotype: the dark side of tumor suppression. Annu Rev Pathol 5, 99–118 (2010). [DOI] [PMC free article] [PubMed] [Google Scholar]
- 32.Zhu Y et al. The Achilles’ heel of senescent cells: from transcriptome to senolytic drugs. Aging Cell 14, 644–658 (2015). [DOI] [PMC free article] [PubMed] [Google Scholar]
- 33.Farr JN et al. Targeting cellular senescence prevents age-related bone loss in mice. Nat Med 23, 1072–1079 (2017). [DOI] [PMC free article] [PubMed] [Google Scholar]
- 34.Ogrodnik M et al. Cellular senescence drives age-dependent hepatic steatosis. Nat Commun 8, 15691 (2017). [DOI] [PMC free article] [PubMed] [Google Scholar]
- 35.Xu M et al. Senolytics improve physical function and increase lifespan in old age. Nat Med 24, 1246–1256 (2018). [DOI] [PMC free article] [PubMed] [Google Scholar]
- 36.Zhu Y et al. Identification of a novel senolytic agent, navitoclax, targeting the Bcl-2 family of anti-apoptotic factors. Aging Cell 15, 428–435 (2016). [DOI] [PMC free article] [PubMed] [Google Scholar]
- 37.Chang J et al. Clearance of senescent cells by ABT263 rejuvenates aged hematopoietic stem cells in mice. Nat Med 22, 78–83 (2016). [DOI] [PMC free article] [PubMed] [Google Scholar]
- 38.Guieze R et al. Mitochondrial Reprogramming Underlies Resistance to BCL-2 Inhibition in Lymphoid Malignancies. Cancer Cell 36, 369–384 e313 (2019). [DOI] [PMC free article] [PubMed] [Google Scholar]
- 39.Hernandez C et al. HMGB1 links chronic liver injury to progenitor responses and hepatocarcinogenesis. J Clin Invest 128, 2436–2451 (2018). [DOI] [PMC free article] [PubMed] [Google Scholar]
- 40.Khambu B et al. HMGB1 promotes ductular reaction and tumorigenesis in autophagy-deficient livers. J Clin Invest 128, 2419–2435 (2018). [DOI] [PMC free article] [PubMed] [Google Scholar]
- 41.Ge X et al. High Mobility Group Box-1 Drives Fibrosis Progression Signaling via the Receptor for Advanced Glycation End Products in Mice. Hepatology 68, 2380–2404 (2018). [DOI] [PMC free article] [PubMed] [Google Scholar]
- 42.Chen R et al. Emerging role of high-mobility group box 1 (HMGB1) in liver diseases. Mol Med 19, 357–366 (2013). [DOI] [PMC free article] [PubMed] [Google Scholar]
- 43.Kim KH, Chen CC, Monzon RI & Lau LF Matricellular protein CCN1 promotes regression of liver fibrosis through induction of cellular senescence in hepatic myofibroblasts. Mol Cell Biol 33, 2078–2090 (2013). [DOI] [PMC free article] [PubMed] [Google Scholar]
- 44.Seki E et al. CCR2 promotes hepatic fibrosis in mice. Hepatology 50, 185–197 (2009). [DOI] [PMC free article] [PubMed] [Google Scholar]
- 45.Lee S et al. A small molecule binding HMGB1 and HMGB2 inhibits microglia-mediated neuroinflammation. Nat Chem Biol 10, 1055–1060 (2014). [DOI] [PubMed] [Google Scholar]
- 46.Huangyang P et al. Fructose-1,6-Bisphosphatase 2 Inhibits Sarcoma Progression by Restraining Mitochondrial Biogenesis. Cell Metab (2019). [DOI] [PMC free article] [PubMed] [Google Scholar]
- 47.Lee S & Schmitt CA The dynamic nature of senescence in cancer. Nat Cell Biol 21, 94–101 (2019). [DOI] [PubMed] [Google Scholar]
- 48.Eggert T et al. Distinct Functions of Senescence-Associated Immune Responses in Liver Tumor Surveillance and Tumor Progression. Cancer Cell 30, 533–547 (2016). [DOI] [PMC free article] [PubMed] [Google Scholar]
- 49.Kang TW et al. Senescence surveillance of pre-malignant hepatocytes limits liver cancer development. Nature 479, 547–551 (2011). [DOI] [PubMed] [Google Scholar]
- 50.Gorgoulis V et al. Cellular Senescence: Defining a Path Forward. Cell 179, 813–827 (2019). [DOI] [PubMed] [Google Scholar]
- 51.Lujambio A et al. Non-cell-autonomous tumor suppression by p53. Cell 153, 449–460 (2013). [DOI] [PMC free article] [PubMed] [Google Scholar]
- 52.Liu F et al. Ceramide activates lysosomal cathepsin B and cathepsin D to attenuate autophagy and induces ER stress to suppress myeloid-derived suppressor cells. Oncotarget 7, 83907–83925 (2016). [DOI] [PMC free article] [PubMed] [Google Scholar]
- 53.Tian Z, Chen Y & Gao B Natural killer cells in liver disease. Hepatology 57, 1654–1662 (2013). [DOI] [PMC free article] [PubMed] [Google Scholar]
- 54.Baker DJ et al. Clearance of p16Ink4a-positive senescent cells delays ageing-associated disorders. Nature 479, 232–236 (2011). [DOI] [PMC free article] [PubMed] [Google Scholar]
- 55.Baker DJ et al. Naturally occurring p16(Ink4a)-positive cells shorten healthy lifespan. Nature 530, 184–189 (2016). [DOI] [PMC free article] [PubMed] [Google Scholar]
- 56.Kirkland JL & Tchkonia T Cellular Senescence: A Translational Perspective. EBioMedicine 21, 21–28 (2017). [DOI] [PMC free article] [PubMed] [Google Scholar]
- 57.Kirkland JL, Tchkonia T, Zhu Y, Niedernhofer LJ & Robbins PD The Clinical Potential of Senolytic Drugs. J Am Geriatr Soc 65, 2297–2301 (2017). [DOI] [PMC free article] [PubMed] [Google Scholar]
- 58.Childs BG et al. Senescent cells: an emerging target for diseases of ageing. Nat Rev Drug Discov 16, 718–735 (2017). [DOI] [PMC free article] [PubMed] [Google Scholar]
- 59.Dorr JR et al. Synthetic lethal metabolic targeting of cellular senescence in cancer therapy. Nature 501, 421–425 (2013). [DOI] [PubMed] [Google Scholar]
- 60.Toso A et al. Enhancing chemotherapy efficacy in Pten-deficient prostate tumors by activating the senescence-associated antitumor immunity. Cell Rep 9, 75–89 (2014). [DOI] [PubMed] [Google Scholar]
- 61.Demaria M et al. Cellular Senescence Promotes Adverse Effects of Chemotherapy and Cancer Relapse. Cancer Discov 7, 165–176 (2017). [DOI] [PMC free article] [PubMed] [Google Scholar]
- 62.Wang C et al. Inducing and exploiting vulnerabilities for the treatment of liver cancer. Nature 574, 268–272 (2019). [DOI] [PMC free article] [PubMed] [Google Scholar]
- 63.Mu X et al. Hepatocellular carcinoma originates from hepatocytes and not from the progenitor/biliary compartment. J Clin Invest 125, 3891–3903 (2015). [DOI] [PMC free article] [PubMed] [Google Scholar]
- 64.Mederacke I, Dapito DH, Affo S, Uchinami H & Schwabe RF High-yield and high-purity isolation of hepatic stellate cells from normal and fibrotic mouse livers. Nat Protoc 10, 305–315 (2015). [DOI] [PMC free article] [PubMed] [Google Scholar]
- 65.Serrano M, Lin AW, McCurrach ME, Beach D & Lowe SW Oncogenic ras provokes premature cell senescence associated with accumulation of p53 and p16INK4a. Cell 88, 593–602 (1997). [DOI] [PubMed] [Google Scholar]
- 66.Subramanian A et al. Gene set enrichment analysis: a knowledge-based approach for interpreting genome-wide expression profiles. Proc Natl Acad Sci U S A 102, 15545–15550 (2005). [DOI] [PMC free article] [PubMed] [Google Scholar]
- 67.Riscal R et al. Chromatin-Bound MDM2 Regulates Serine Metabolism and Redox Homeostasis Independently of p53. Mol Cell 62, 890–902 (2016). [DOI] [PubMed] [Google Scholar]
- 68.Possemato R et al. Functional genomics reveal that the serine synthesis pathway is essential in breast cancer. Nature 476, 346–350 (2011). [DOI] [PMC free article] [PubMed] [Google Scholar]
Associated Data
This section collects any data citations, data availability statements, or supplementary materials included in this article.
Supplementary Materials
Data Availability Statement
The human liver cancer data were derived from TCGA Research Network: https://cancergenome.nih.gov/cancersselected/LiverHepatocellularCarcinoma). Two public mouse NAFLD-HCC datasets (GSE6768019 and GSE9901020) were available at https://www.ncbi.nlm.nih.gov/geo/. RNA-seq data generated in this study have been deposited in the Gene Expression Omnibus (GEO) with the accession number GSE135616. Mass spectrometry data have been deposited in ProteomeXchange with the primary accession code PXD017831 (http://proteomecentral.proteomexchange.org/cgi/GetDataset?ID=PXD017831). The authors declare that the data supporting the findings of this study are available within the paper and its supplementary information files. All other data supporting the findings of this study are available from the corresponding author upon reasonable request.


