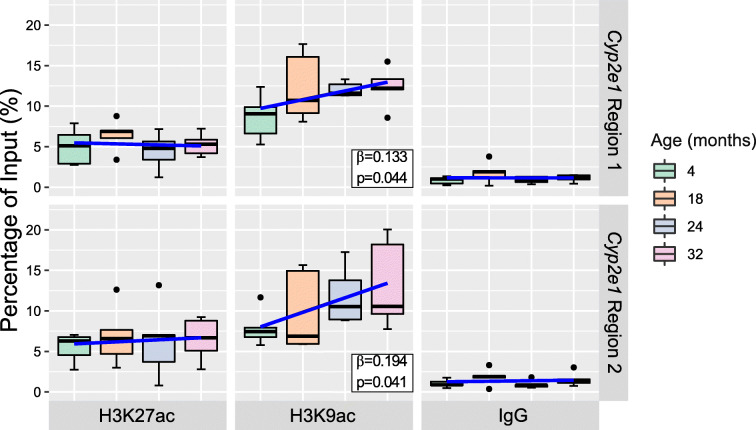
Fig. 5.
Chromatin immunoprecipitation quantitative polymerase chain reaction (ChIP-qPCR) data. Box plots with regression line (blue) of age-associated changes to percentage of input occupancy of histone 3 lysine 9 acetylation (H3K9ac) (n = 20 per region), histone 3 lysine 27 acetylation (H3K27ac) (n = 20 per region) at Cyp2e1 intron 1 (region 1, chr7: 147,950,223–147,950,367, mm9) and promoter (region 2, chr7: 147,942,350–147,942,468, mm9). IgG percentage of input shows a low background noise signal for each of the sample’s age groups (n = 20 per region). Data represent median (middle hinge), 25% (lower hinge), and 75% (upper hinge) quantiles. Data points beyond upper or lower 1.5 × interquantile range are represented as individual black dots

