Short abstract
Hypokalemia is one of the most common electrolyte disturbances in the clinic and it can increase the risk of life-threatening arrhythmias. Electrocardiographic characteristics associated with hypokalemia include dynamic changes in T-wave morphology, ST-segment depression, and U waves, which are often best seen in the mid-precordial leads (V2–V4). The PR interval can also be prolonged along with an increase in the amplitude of the P wave. We report a case of a patient with hypokalemia (1.31 mmol/L) who showed typical electrocardiographic characteristics of hypokalemia.
Keywords: Hypokalemia, electrocardiogram, diarrhea, T wave, potassium, arrhythmia
Introduction
Hypokalemia is one of the commonly encountered electrolyte disturbances, and has the potential to increase the risk of arrhythmia.1–4 Hypokalemia is defined as a potassium level <3.5 mmol/L, moderate hypokalemia as a potassium level of <3.0 mmol/L, and severe hypokalemia as a potassium level <2.5 mmol/L. Diarrhea and diuretic therapy are responsible for most cases of hypokalemia in the clinic.2,5 The level of serum potassium is vital for regulating depolarization and repolarization of the myocardium, and hypokalemia can alter the cardiac action potential and result in abnormities of cardiac conduction.6 Additionally, the P pulmonale pattern is occasionally observed in patients with hypokalemia, and it is transient and concomitant.7,8 These changes are responsible for findings on a surface electrocardiogram (ECG) associated with hypokalemia. When potassium levels are <2.7 mmol/L, changes in the ECG include dynamic changes in T-wave morphology (T-wave flattening and inversion), ST-segment depression, and U waves, which are often best seen in the mid-precordial leads (V1–V4). Furthermore, high potassium levels precipitate potentially life-threatening dysrhythmias.9,10 Therefore, serum potassium levels in patients who experience arrhythmia need to be checked, especially when they have diuretic therapy or diarrhea. We present a case of typical ECG parameters that were related to severe hypokalemia. This study aimed to discuss the electrophysiological mechanisms underlying dynamic changes in an ECG. We also aimed to provide a better understanding of hypokalemia-induced arrhythmias from cell to bedside, promoting management of this setting in clinical practice.
Case report
This study complied with the Declaration of Helsinki and was approved by the Ethics Committee of the First affiliated Hospital Affiliated of Xi’an Jiaotong University. The patient provided written informed consent.
Case
A 57-year-old man presented with diarrhea with approximately eight to ten stool emissions per day, progressive paralysis of the lower extremities, weakness, and inability to walk by himself over the past 3 months. His medical history was unremarkable. A physical examination showed that the patient was weak and bedridden, and thoracic and cardiac examinations were unremarkable. The patient’s abdomen was soft, with tenderness at palpation in the left lower quadrant, and bowel sounds were hyperactive. A neurological examination showed flaccid paralysis of the lower extremities (Medical Research Council Grade = 2) and swelling of the ankles. There were no swallowing or respiratory difficulties. Laboratory tests on admission showed severe hypokalemia (1.31 mmol/L; minimum on admission: 1.31 mmol/L, at discharge: 4.28 mmol/L; normal value: 3.5–5.5 mmol/L), a normal serum sodium level (140 mmol/L; minimum on admission: 132 mmol/L, at discharge: 142 mmol/L; normal value: 137–147 mmol/L), a low serum calcium level (1.65 mmol/L; minimum on admission: 1.31 mmol/L, at discharge: 1.83 mmol/L; normal value: 2.1–2.5 mmol/L), and a normal serum magnesium level (0.77 mmol/L; minimum on admission: 0.16 mmol/L, at discharge: 0.83 mmol/L; normal value: 0.75–1.02 mmol/L). At admission, the patient also had an elevated creatine kinase level (1595 U/L; normal value: 50–310 U/L), elevated creatine kinase-MB level (45 U/L; normal value: 0–24 U/L), elevated myohemoglobin level (6182.1 ng/mL; normal value: 0–146.9 ng/mL), normal troponin level (14.63 pg/mL; normal value: 0–26.2 pg/mL), and normal serum cortisol level (18.1 µg/dL; normal value: 5–28 µg/dL). Arterial blood gas analysis showed the following: pH, 7.56; partial pressure of oxygen, 108 mmHg; partial pressure of carbon dioxide, 35 mmHg; bicarbonate, 31.3 mmol/L; and oxygen saturation, 99%. These findings indicated metabolic alkalosis. Urinary electrolyte studies showed that potassium excretion was normal.
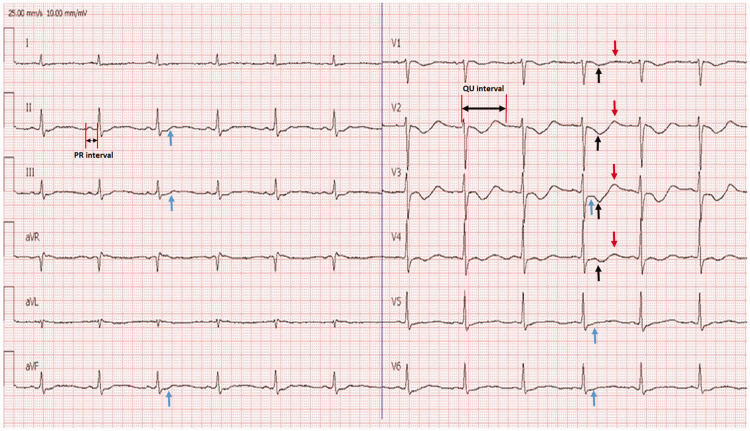
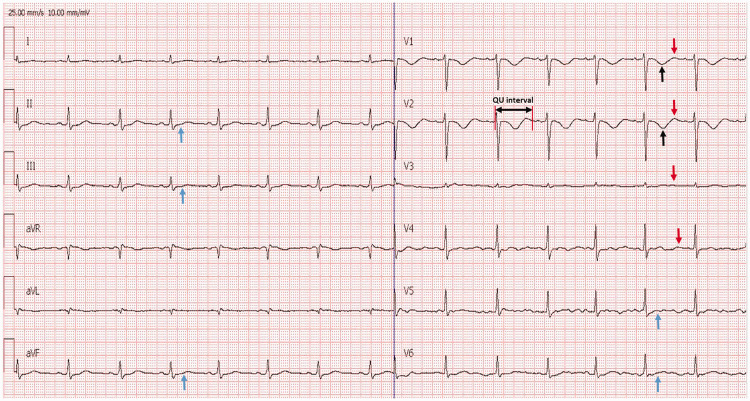
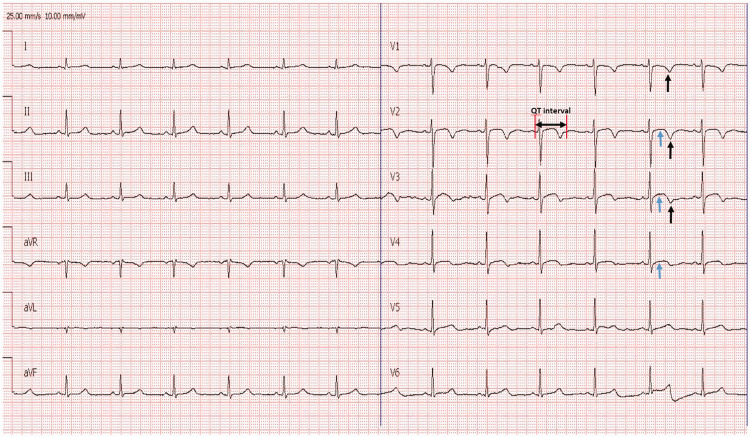
ECG on admission (Figure 1) showed a sinus rhythm of 52 beats/minute, prolonged QU interval of 820 ms, prolonged PR interval of 22 ms, ST-segment depression, T-wave inversion, and U waves, which were best seen in the precordial leads (particularly in leads V2 and V4). The level of serum potassium gradually increased following oral and intravenous potassium supplementation of approximately 10 g/day. Two days later, stool emissions were reduced to five times per day. The level of serum potassium was 2.85 mmol/L and a simultaneous ECG examination showed sinus rhythm of 58 beats/minute, a prolonged QU interval of 720 ms, ST-segment depression, T wave inversion, and improvement of U waves (Figure 2). After 5 days of potassium supplementation, potassium levels improved to normal levels and paralysis of the lower extremities gradually disappeared. ECG showed normalization of the QT (424 ms) and QTc (439 ms) intervals, smaller inverted T waves, and ST-segment elevation (Figure 3) compared with ECG on admission. The P wave amplitude of this patient was in the normal range in the ECG on admission and at a later date. With potassium and fluid supplementation, the patient improved in all aspects and was discharged 2 weeks after admission.
Figure 1.
Twelve-lead electrocardiogram taken on admission from a 57-year-old man with severe diarrhea, paralysis of the lower extremities, weakness, inability to walk, and severe hypokalemia (1.31 mmol/L; normal value: 3.5–5.5 mmol/L). Electrocardiography shows bradycardia, a prolonged PR interval, a prolonged QU interval, ST-segment depression, T wave inversion, U waves best seen in the precordial leads (particularly in leads V2–lead 4), and slurring of T waves into U waves (leads II and III), which are consistent with the diagnosis of hypokalemia. Red arrowheads indicate prominent U waves, black arrowheads indicate T wave inversion, and blue arrowheads indicate ST-segment depression.
Figure 2.
Twelve-lead electrocardiogram taken from the same patient following oral and intravenous potassium replacement (potassium level was 2.85 mmol/L during the electrocardiogram). An electrocardiogram shows bradycardia, a prolonged PR interval, a prolonged QU interval, ST-segment depression, T wave inversion, and improvement of U waves. Red arrowheads indicate prominent U waves, black arrowheads indicate T-wave inversion, and blue arrowheads indicate ST-segment depression.
Figure 3.
An electrocardiogram shows normalization of the QT and QTc intervals, smaller inverted T waves (black arrowheads), and ST-segment elevation (blue arrowheads).
Discussion
U-wave development is a classic change in the ECG in patients with hypokalemia. A U wave is described as positive deflection after the T wave and it is often best observed in the mid-precordial leads. Under the condition of extreme hypokalemia, giant U waves may often merge and then smaller preceding T waves are covered.11 Tall P waves, prominent J waves, ST-segment depression, a prolonged QT interval, premature ventricular contraction, ventricular tachycardia, and torsade de pointes can also be observed in patients with hypokalemia.12–16 In the present case of severe hypokalemia, the ECG showed typical alterations in T waves, U waves, and a prolonged QU interval. Multiple mechanisms contribute to the dynamic morphology of T waves related to hypokalemia.17
Potassium is one of the most abundant intracellular cations and it also determines the resting membrane potential.18 Hypokalemia leads to a more negative resting membrane potential, and in electrical diastole, widening between the threshold potential and the resting membrane potential leads to a decrease in membrane excitability.5 Because of low extracellular potassium levels, a delayed rectifier current (IKr) results in an increase in the action potential duration and a delay in repolarization.5 To open the delayed rectifier channel, extracellular potassium ions are required. Importantly, the action potential configuration is changed by hypokalemia; the slope of phase 2 first increases and subsequently decreases, whereas the duration of phase 3 decelerates. This results in a long action potential, leading to a decrease in the difference of the resting membrane potential from the threshold potential during the terminal phase of the action potential and an increase in the relative refractory period.5 Increased cardiac tissue excitability is associated with ectopy for a large portion of the action potential.
Conductance of potassium is often characterized by an intense allosteric dependence and dichotomous effects on extracellular potassium concentrations ([K+]o), including the inward rectifier potassium channel (IK1), the rapid component of the delayed rectifier-like potassium channel (IKr), and the transient outward potassium current (Ito).19 Because of cytoplasmic magnesium and polyamines, the IK1 shows a dichotomous effect during hypokalemia. The IK1 has a paradoxical connection with [K+]o where the IK1 peak current density is decreased during hypokalemia.20 Even though hypokalemia hyperpolarizes the potassium equilibrium potential, the driving force of outward potassium flow is increased, and the increased blocking stability of cations in the pore results in decreased of conductance and outward potassium current. The mechanisms that regulate the conductance of potassium channels of the IKr and Ito are different. These mechanisms speed rapid inactivation of the IKr and slow reactivation kinetics of the Ito to reduce outward repolarizing current, even with moderate hypokalemia.21 Hypokalemia also leads to internalization and degradation of IKr expression within hours.22 In the plasma membrane, enhanced degradation of the IKr downregulates the expression of IKr and IKs.22,23
The rate of the sodium-potassium pump in transporting ions depends on the affinities of the binding sites for sodium/potassium and the resting membrane potential. With regard to the α1 isoform of sodium-potassium ATPase in the mouse heart, the half maximally saturated concentration of the external potassium binding site is 1.9 mmol/L of [K+]o,24 and this operates at the half-maximal pumping rate at this concentration. The [K+]o is reduced from 4.5 to 2.7mmol/L, accompanied by an approximately 20% decrease in the ion pumping rate.25 The ion pumping rate is decreased by > 50% in the α2 isoform in which the half maximally saturated concentration of [K+]o is 2.9 mmol/L.24 Because the sodium-potassium pump generates a net outward current and is inhibited by hyperpolarization, the effect of hypokalemia is to reduce the sodium-potassium pump ion pumping rate.26
The action potential duration is prolonged because of a reduced outward current during hypokalemia, and this results in increased calcium influx through calcium channels.26 Intracellular calcium removal through sodium-calcium exchange is compromised because of elevated intracellular sodium concentrations, resulting from sodium-potassium pump inhibition. All of these processes result in increased cytoplasmic calcium concentration overload and calcium/calmodulin-dependent protein kinase activation.26 Additionally, the Purkinje fiber plateau is prolonged by hypokalemia, whereas it is shortened in ventricular fibers.27,28 The prolonged action potential tail of the conducting system is more than that in the ventricles, resulting in increased dispersion of repolarization.27,28 Hypokalemia increases diastolic depolarization of Purkinje fibers, thereby increasing automaticity and underlying the basis of U waves.5,27,28
All of these molecular changes contribute to a reduction in repolarization reserve. A decrease in potassium channel conductance is the cellular foundation for intricate T waves. Yan and coworkers17 showed that under normal circumstances, the T wave is usually upright and the epicardium is repolarized first, coinciding with the crest of the T wave. Finally, the M cells is repolarized, coinciding with the end of the T wave. During myocardial repolarization of phases 2 and 3, the voltage gradients between the M region lead to formation of the ECG T wave and determine the height and the ascending or descending limb of the T wave. Action potentials of the ventricular myocardium in phases 2 and 3 are predominantly mediated by the IKr and IKs which are in turn dependent on [K+]o. However, under the condition of hypokalemia, degradation of the IKr and IKs and decreased conduction of the IKr contribute to a preferential action potential prolongation of different transmural layers. This leads to a change in voltage gradients between the two sides of the M region.17,29,30 The variation in voltage gradients contributes to complex T wave morphologies, such as biphasic, inverted, and triphasic T waves.
Declaration of conflicting interest
The authors declare that there is no conflict of interest.
Funding
This research received no specific grant from any funding agency in the public, commercial, or not-for-profit sectors.
References
- 1.Pezhouman A, Singh N, Song Z, et al. Molecular basis of hypokalemia-induced ventricular fibrillation. Circulation 2015; 132: 1528–1537. DOI: 10.1161/CIRCULATIONAHA.115.016217. [DOI] [PMC free article] [PubMed] [Google Scholar]
- 2.Schulman M, Narins RG. Hypokalemia and cardiovascular disease. Am J Cardiol 1990; 65: 4E–9E; discussion 22E–23E. [DOI] [PubMed] [Google Scholar]
- 3.Habbab MA, el-Sherif N. TU alternans, long QTU, and torsade de pointes: clinical and experimental observations. Pacing Clin Electrophysiol 1992; 15: 916–931. [DOI] [PubMed] [Google Scholar]
- 4.Martinez-Vea A, Bardaji A, Garcia C, et al. Severe hyperkalemia with minimal electrocardiographic manifestations: a report of seven cases. J Electrocardiol 1999; 32: 45–49. [DOI] [PubMed] [Google Scholar]
- 5.El-Sherif N, Turitto G. Electrolyte disorders and arrhythmogenesis. Cardiol J 2011; 18: 233–245. 2011/06/11. [PubMed] [Google Scholar]
- 6.Viera AJ, Wouk N. Potassium disorders: hypokalemia and hyperkalemia. Am Fam Physician 2015; 92: 487–495. 2015/09/16. [PubMed] [Google Scholar]
- 7.Weaver WF, Burchell HB. Serum potassium and the electrocardiogram in hypokalemia. Circulation 1960; 21: 505–521. 1960/04/01. [DOI] [PubMed] [Google Scholar]
- 8.Chou TC, Helm RA. The pseudo P pulmonale. Circulation 1965; 32: 96–105. 1965/07/01. [DOI] [PubMed] [Google Scholar]
- 9.Macdonald JE, Struthers AD. What is the optimal serum potassium level in cardiovascular patients? J Am Coll Cardiol 2004; 43: 155–161. 2004/01/23. [DOI] [PubMed] [Google Scholar]
- 10.Cooper HA, Dries DL, Davis CE, et al. Diuretics and risk of arrhythmic death in patients with left ventricular dysfunction. Circulation 1999; 100: 1311–1315. 1999/09/24. [DOI] [PubMed] [Google Scholar]
- 11.Yan GX, Lankipalli RS, Burke JF, et al. Ventricular repolarization components on the electrocardiogram: cellular basis and clinical significance. J Am Coll Cardiol 2003; 42: 401–409. 2003/08/09. [DOI] [PubMed] [Google Scholar]
- 12.Wang A, Li X, Dookhun MN, et al. A female patient with hypokalaemia-induced J wave syndrome: an unusual case report. Medicine 2017; 96: e8098 DOI: 10.1097/MD.0000000000008098. [DOI] [PMC free article] [PubMed] [Google Scholar]
- 13.Kishimoto C, Tamaru K, Kuwahara H. Tall P waves associated with severe hypokalemia and combined electrolyte depletion. J Electrocardiol 2014; 47: 93–94. DOI: 10.1016/j.jelectrocard.2013.09.002. [DOI] [PubMed] [Google Scholar]
- 14.Khan MU, Patel AG, Wilbur SL, et al. Electrocardiographic changes in combined electrolyte depletion. Int J Cardiol 2007; 116: 276–278. DOI: 10.1016/j.ijcard.2006.04.070. [DOI] [PubMed] [Google Scholar]
- 15.Chang KY, Lee SH, Park HS, et al. Severe hypokalemia and thyrotoxic paralysis from painless thyroiditis complicated by life-threatening polymorphic ventricular tachycardia and rhabdomyolysis. Intern Med 2014; 53: 1805–1808. 2014/08/19. [DOI] [PubMed] [Google Scholar]
- 16.Kumar V, Khosla S, Stancu M. Torsade de pointes induced by hypokalemia from imipenem and piperacillin. Case Rep Cardiol 2017; 2017: 4565182 2017/06/24. DOI: 10.1155/2017/4565182. [DOI] [PMC free article] [PubMed] [Google Scholar]
- 17.Yan GX, Antzelevitch C. Cellular basis for the normal T wave and the electrocardiographic manifestations of the long-QT syndrome. Circulation 1998; 98: 1928–1936. 1998/11/03. [DOI] [PubMed] [Google Scholar]
- 18.Hoffman BF, Suckling EE. Effect of several cations on transmembrane potentials of cardiac muscle. Am J Physiol 1956; 186: 317–324. 1956/08/01. DOI: 10.1152/ajplegacy.1956.186.2.317. [DOI] [PubMed] [Google Scholar]
- 19.Osadchii OE. Mechanisms of hypokalemia-induced ventricular arrhythmogenicity. Fundam Clin Pharmacol 2010; 24: 547–559. 2010/06/30. DOI: 10.1111/j.1472-8206.2010.00835.x. [DOI] [PubMed] [Google Scholar]
- 20.Nichols CG, Lopatin AN. Inward rectifier potassium channels. Annu Rev Physiol 1997; 59: 171–191. 1997/01/01. DOI: 10.1146/annurev.physiol.59.1.171. [DOI] [PubMed] [Google Scholar]
- 21.Killeen MJ, Thomas G, Gurung IS, et al. Arrhythmogenic mechanisms in the isolated perfused hypokalaemic murine heart. Acta Physiol (Oxf) 2007; 189: 33–46. 2007/02/07. DOI: 10.1111/j.1748-1716.2006.01643.x. [DOI] [PMC free article] [PubMed] [Google Scholar]
- 22.Guo J, Massaeli H, Xu J, et al. Extracellular K+ concentration controls cell surface density of IKr in rabbit hearts and of the HERG channel in human cell lines. J Clin Invest 2009; 119: 2745–2757. 2009/09/04. DOI: 10.1172/jci39027. [DOI] [PMC free article] [PubMed] [Google Scholar]
- 23.Guo J, Wang T, Yang T, et al. Interaction between the cardiac rapidly (IKr) and slowly (IKs) activating delayed rectifier potassium channels revealed by low K+-induced hERG endocytic degradation. J Biol Chem 2011; 286: 34664–34674. 2011/08/17. DOI: 10.1074/jbc.M111.253351. [DOI] [PMC free article] [PubMed] [Google Scholar]
- 24.Han F, Tucker AL, Lingrel JB, et al. Extracellular potassium dependence of the Na+-K+-ATPase in cardiac myocytes: isoform specificity and effect of phospholemman. Am J Physiol Cell Physiol 2009; 297: C699–C705. 2009/07/03. DOI: 10.1152/ajpcell.00063.2009. [DOI] [PMC free article] [PubMed] [Google Scholar]
- 25.Weiss JN. Palpitations, potassium and the pump. J Physiol 2015; 593: 1387–1388. 2015/03/17. DOI: 10.1113/jphysiol.2014.285924. [DOI] [PMC free article] [PubMed] [Google Scholar]
- 26.Aronsen JM, Skogestad J, Lewalle A, et al. Hypokalaemia induces Ca2+ overload and Ca2+ waves in ventricular myocytes by reducing Na+, K+-ATPase α2 activity. J Physiol 2015; 593: 1509–1521. 2015/03/17. DOI: 10.1113/jphysiol.2014.279893. [DOI] [PMC free article] [PubMed] [Google Scholar]
- 27.Sheu SS, Korth M, Lathrop DA, et al. Intra- and extracellular K+ and Na+ activities and resting membrane potential in sheep cardiac purkinje strands. Circ Res 1980; 47: 692–700. 1980/11/01. [DOI] [PubMed] [Google Scholar]
- 28.Gettes L, Surawicz B. Effects of low and high concentrations of potassium on the simultaneously recorded Purkinje and ventricular action potentials of the perfused pig moderator band. Circ Res 1968; 23: 717–729. 1968/12/01. [DOI] [PubMed] [Google Scholar]
- 29.Viswanathan PC, Shaw RM, Rudy Y. Effects of IKr and IKs heterogeneity on action potential duration and its rate dependence: a simulation study. Circulation 1999; 99: 2466–2474. 1999/05/11. [DOI] [PubMed] [Google Scholar]
- 30.Emori T, Antzelevitch C. Cellular basis for complex T waves and arrhythmic activity following combined I(Kr) and I(Ks) block. J Cardiovasc Electrophysiol 2001; 12: 1369–1378. 2002/01/19. [DOI] [PubMed] [Google Scholar]


