

Abstract
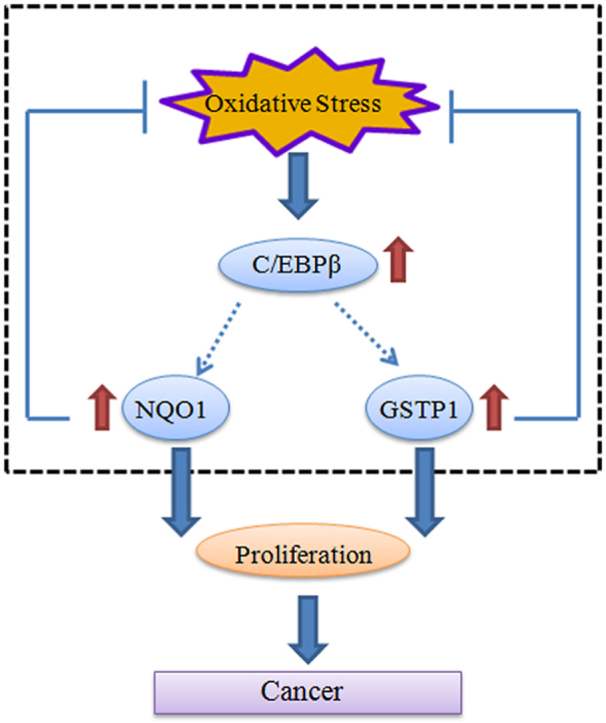
Glioblastoma (GBM) is the most common and most aggressive brain tumor, associated with high levels of reactive oxidative species (ROS) due to metabolic and signaling aberrations. High ROS levels are detrimental to cells, but it remains incompletely understood how cancer cells cope with the adverse effects. Here we show that C/EBPβ, a ROS responsive transcription factor, regulates the transcription of NQO1 and GSTP1, two antioxidative reductases, which neutralize ROS in the GBM and mediates their proliferation. C/EBPβ is upregulated in EGFR overexpressed GBM cells, inversely correlated with the survival rates of brain tumor patients. Interestingly, C/EBPβ binds the promoters of NQO1 and GSTP1 and escalates their expression. Overexpression of C/EBPβ selectively decreases the ROS in EGFR-overexpressed U87MG cells and promotes cell proliferation via upregulating NQO1 and GSTP1; whereas knocking down C/EBPβ elevates the ROS and reduces proliferation by repressing the reductases. Accordingly, C/EBPβ mediates the brain tumor growth in vivo, coupling with NQO1 and GSTP1 expression and ROS levels. Hence, C/EBPβ regulates the expression of antioxidative reductases and balances the ROS, promoting brain tumor proliferation.
Keywords: Oxidative stress, NQO1, GSTP1, Transcription factor, C/EBPβ, GBM
Graphical abstract
Highlights
-
•
C/EBPβ is upregulated in EGFR overexpressed GBM cells, inversely correlated with the survival rates of brain tumor patients.
-
•
C/EBPβ binds the promoters of NQO1 and GSTP1 and escalates their expression.
-
•
C/EBPβ mediates the brain tumor growth in vitro and in vivo, coupling with NQO1 and GSTP1 expression and ROS levels.
Abbreviations
- GBM
Glioblastoma
- ROS
Reactive oxidative species
- EGFR
Epidermal growth factor receptor
- PTEN
Phosphatase and tensin homolog
- PI3K
Phosphoinositide 3-kinase
- MAPK
Mitogen-activated protein kinase
- Nrf2
Nuclear erythroid 2-related factor 2
- AREs
Antioxidant response elements
- NQO1
NAD(P)H quinone oxidoreductase 1
- GSTP1
Glutathione S-Transferase Pi 1
- C/EBPβ
CCAAT/enhancer-binding protein β
- ER
Endoplasmic reticulum
- EMSA
Electrophoretic Mobility Shift Assay
- CHIP
Chromatin immunoprecipitation
- LDH
Lactate Dehydrogenase
1. Introduction
Cancer cells are characterized by increased aerobic glycolysis (termed the Warburg effect) and high levels of oxidative stress [1]. This oxidative stress is exerted by reactive oxygen species (ROS) that accumulate as a result of an imbalance between ROS generation and elimination. The high ROS levels in cancer cells are a consequence of alterations in several signaling pathways that affect cellular metabolism. Many signaling pathways that are linked to tumorigenesis can also regulate the metabolism of ROS through direct or indirect mechanisms [2]. Glioblastoma (GBM) is the most malignant human brain tumor, which is highly aggressive, infiltrative, and destructive. Approximately 40% of glioblastomas show amplification of the EGFR gene locus [3] and about half of these tumors express a mutant receptor (EGFRvIII) that is constitutively active due to an in-frame deletion of exons 2 to 7 within the extracellular ligand-binding domain [4,5]. Despite tremendous efforts in recent years, effective therapies based on GBM common mutations and alterations have been disappointing [6,7]. The EGFR is a receptor tyrosine kinase that regulates fundamental processes of cell growth and differentiation. In response to ligation, EGFR forms homodimers and heterodimers activating several intracellular signal pathways, such as phosphatidylinositol 3′-kinase (PI3K)/Akt and Ras/mitogen-activated protein kinase (MAPK), leading to increase in DNA synthesis [8]. Primary GBMs usually possess EGFR amplification, PTEN mutation, and loss of chromosome 10, while TP53 mutations are common in secondary GBM, unlike the primary types [9,10]. These mutations affect the redox balance in the tumor environment. For instance, ligation of EGFR by EGF induces endogenous production of intracellular reactive oxygen species (ROS) and H2O2 in cancer cell lines [8,11]. Also, high levels of H2O2 (200 pM) significantly increase the Tyr autophosphorylation by EGFR, resulting in the generation of ROS [8]. EGFRvIII overexpression in glioblastoma cells causes increased levels of ROS, DNA strand break accumulation, and genome instability [12,13].
Cancer cells adapt to the imbalanced redox status created by their rapid growth and other conditions, such as oxygen and limited availability of nutrients, by developing alternative metabolic reactions that render them insensitive to further stress inducers such as chemotherapy and radiation [14]. These ROS levels are counteracted by elevated antioxidant defense mechanisms in cancer cells [15]. Nuclear erythroid 2-related factor 2 (Nrf2), a redox-sensitive transcription factor, is involved in the regulation of the antioxidant response element (ARE)-mediated expression of phase II detoxifying antioxidant enzymes [16]. In response to oxidative stress, Nrf2 is activated and form heterodimers with other bZIP proteins, bind to cis-acting element(s) termed antioxidant response elements (AREs) in the promoters of target genes [17], inducing transcriptional responses. ARE-dependent genes encode various enzymes, including detoxification enzymes such as glutathione S-transferases (GSTs), NAD(P)H quinone oxidoreductase 1 (NQO1), and heme oxygenase 1 (HO-1), as well as antioxidant enzymes such as catalase (CAT), sulfiredoxin (SRX), γ -glutamate-cysteine ligase catalytic subunit (GCLC) and regulatory subunit (GCLM). Nrf2, therefore, plays a central role in the cellular adaptive response to oxidative stress [18]. In addition to these reductases, active Nrf2 also triggers an immediate induction of CCAAT/enhancer-binding protein β (C/EBPβ). Cebpβ promoter associates with Nrf2 transcription factor via ARE binding site in the promoter of the Cebpβ gene during adipogenesis and upregulates its expression [18]. Most recently, we reported that NQO1 is regulated by PTEN in glioblastoma, mediating cell proliferation and oxidative stress [19].
CCAAT/enhancer-binding proteins (C/EBP) are a family of transcription factors of the basic-leucine zipper (bZIP) class. C/EBPs are a six-member family of transcription factors that bind to DNA as homodimers and heterodimers. They are involved in the regulation and expression of numerous genes. C/EBPs affect gene expression by binding to a DNA binding site (consensus sequence “CCAAT”), which is present in many gene promoters and enhancer regions [20]. C/EBPβ is highly expressed in the intestine, liver, kidney, lungs, spleen, adipose tissue, pancreatic cells [21]. Notably, C/EBPβ is involved in the regulation of pro-inflammatory gene expression in glial activation and plays a key role in the induction of neurotoxic effects by activated microglia [22]. Although C/EBPβ increases the expression of a wide variety of target genes that regulate numerous metabolic processes, C/EBPβ binding sites are particularly found in regulatory sequences of genes that are associated with the inflammatory response [23] or the ER stress pathway [24]. When the transactivation domain of C/EBPβ becomes phosphorylated by the inflammatory stimuli, transcription of the C/EBPβ gene increases [25], which subsequently elevates the expression of various proinflammatory genes including IL-6 [26]. Interestingly, increased C/EBPβ expression has been detected in breast cancer, ovarian tumors and colorectal tumors [[27], [28], [29], [30]]; by contrast, C/EBPβ −/− mice are refractory to tumorigenesis [31], supporting that C/EBPβ plays a critical role in mediating cancer progression.
In the current study, we show that C/EBPβ is highly increased in GBM, and EGFR overexpression escalates its expression, associated with elevated ROS levels. Remarkably, C/EBPβ mediates both NQO1 and GSTP1 transcriptional expression. Manipulation of C/EBPβ levels tightly dictates NQO1 and GSTP1 expression, regulating ROS and GBM cell proliferation. Notably, the depletion of NQO1 and GSTP1 abolishes the oncogenic activities of C/EBPβ. Therefore, these findings provide an innovative mechanism shedding light on how GBM tumors balance the redox and modulate cell proliferation.
2. Materials and methods
2.1. Cell lines and cell culture
The human glioblastoma cell lines were gifts from Dr. Paul S. Mischel's lab [32]. LN229/EGFR cell line was a gift from Dr. William Weiss lab at UCSF. In brief, the human glioblastoma cell line U87MG were stably transfected with vector control, PTEN, EGFR, and EGFRvIII, with various selection antibiotics. For wild-type EGFR, EGFRvIII, PTEN, 0.7 μg/mL of puromycin, 150 μg/mL of hygromycin and 400 μg/mL of G418 was added individually. The cells were supplemented with 10% fetal bovine serum (Hyclone, USA), penicillin (100 U/ml) and streptomycin (100 U/ml) (ABAM Life Technologies, USA) in a humidified incubator with 5% CO2 at 37 °C.
2.2. Luciferase assay
The cells were seeded in 24-well plates and cultured overnight. Cells were then transfected with C/EBPβ overexpression or knockdown together with NQO1 and GSTP1 luciferase reporter LightSwitch™ Promoter GoClone® (Active Motif). Forty-eight hours post-transfection, the cells were harvested in passive lysis buffer and analyzed using a LightSwitch Assay Reagent according to the manufacturer's protocol (Active Motif) on a microplate reader. Relative light units of NQO1 and GSTP1 luciferase were normalized to RenSP luciferase light units to control for transfection efficiency. The experiments were performed in triplicate.
2.3. EMSA (Electrophoretic Mobility Shift Assay; DNA: protein)
Nuclear proteins were extracted using NE-PER Nuclear and Cytoplasmic Extraction Reagents (Life Technologies). Protein concentrations were determined using a Coomassie Brilliant Blue protein assay kit (Bio-Rad). Double-stranded oligonucleotide probe for NQO1 and GSTP1 promoter or its mutation were labeled with biotin. Unlabeled probes were used as competitors. EMSA assay was performed as described in the LightShift Chemiluminescent EMSA Kit (Life Technologies). EMSA assay was recruited to detect the C/EBPβ binding ability on site -723~ -705 of NQO1 promoter (AGGGGTGGTGCAGTGGCAT), Mutation probe 1 (AGGGAAAATGCAGTGGCAT) or Mutation probe 2 (AGGGGTGGTGCAGTGAAAA) and supershift; EMSA detect the C/EBPβ binding ability on site -729~ -715 of GSTP1 promoter (CAACATGGTGAAACCCCGT), Mutation probe 1 (CAACAAAATGAAACCCCGT) or Mutation probe 2 (CAACATGGTGAAACCAAAA).
2.4. Chromatin immunoprecipitation (ChIP)
Briefly, the cells were fixed with 1% formaldehyde for 10 min and crosslinking was quenched with 2 M glycine for 5 min. Samples were rinsed 3 times with cold PBS. After nuclei isolation, the chromatin was sonicated using a Covaris S220 sonicator to obtain the desired DNA fragment size (major band at 500 bp). The sonicated chromatin was pre-cleaned by two rounds of centrifugation with maximum speed at 4 °C. In total, 5 μl of anti-C/EBPβ (C19, Santa Cruz) or 5 μl of anti-IgG (ab133470, Abcam) were used to precipitate the chromatin fragments that contain DNA-protein crosslinking ChIP samples, which was collected with 50 μl Dynabeads protein A (Invitrogen, 10001D). The chromatin was sheared with a sonicator. The enrichment of specific DNA sequences was examined by PCR using primer pairs of the human NQO1 promoter (CCC GCTAGC GCTTCCCTATAACTGCTATCT and CTT CTCGAG GCACTTGGGGGCCCATA) and GSTP1 promoter (CTT GCTAGC AGGAGTTCGAGACCAGCC and CTT CTCGAG AGGCTGGAGTGCAGTGG). PCR assay also detected each input sample and internal reference β-actin.
2.5. Cell proliferation assays
The cell survival was analyzed with the 3-(4, 5-dimethylthiazol- 2-yl)-2,5-diphenyltetrazolium bromide (MTT) as described previously. The cells were seeded (1 × 10⁴) in the regular growth medium, in 5 days, 20 μL of MTT (5 mg/mL in PBS, Sigma, USA) was added to each well and the plates were incubated for 4 h at 37 °C. The resulting formazan product was dissolved with DMSO. The absorbance at a wavelength of 490 nm was recorded using a microplate reader (BioTek Instruments Inc., USA).
2.6. Measurement of reactive oxygen species formation
The DCFH-DA method was used to detect the levels of intracellular reactive oxygen species (ROS). After different treatments, the cells were collected and then incubated with 5 μM DCFH-DA (ROS dye, #C6827, Invitrogen, USA) for 2 h at 37 °C. The fluorescence intensity was measured by the microplate reader (BioTek Instruments Inc., USA) with settings at excitation and emission equal to 485/535 nm. The Confocal Microscope (Olympus, FV1000, Japan) was also employed to obtain the images.
2.7. LDH measurements
The cytokine concentrations were measured using LDH assay kits (Promega Corporation, USA). Briefly, after collecting the supernatants, 50 μl of LDH detection reagent was added to each well. After 1 h of incubation at room temperature, 50 μl of Stop Solution was added to each well. Finally, the absorbance at 490 nm was recorded (BioTek Instruments Inc., USA).
2.8. GSH/GSSG ratio measurements and protein carbonyl assay
GSH/GSSG ratio and Protein carbonyl levels were measured from cell homogenates using GSH/GSSG-Glo™ (Promega Corporation, USA) and Protein Carbonyl Assay Kit (#ab126287, Abcam, Cambridge MA, USA), respectively.
2.9. Quantitative real-time PCR
The total RNA extraction was performed using Trizol reagent (Invitrogen, California, USA) which following the manufacturer's instructions. Reverse transcription was performed with the SuperScriptIII reverse transcriptase (Life Technologies). All real-time PCR reactions were performed using the ABI 7500-Fast Real-Time PCR System and Taqman Universal Master Mix Kit (Life Technologies). Gene-specific primers and probes were designed from Taqman (Life Technologies). The relative quantification of gene expression was calculated as 2−ΔΔCt method. All tests were conducted in triplicates.
2.10. Western blot analysis
After various treatments, the cells were harvested and the total proteins were extracted. Western blot assays were performed as described in our previous study. Equal amounts of the proteins were loaded on SDS-PAGE gels and were then transferred to a PVDF membrane. Primary antibodies to the following targets were used: p-EGFR (#2236, CST, USA); EGFR (#2232, CST, USA); PTEN (#9559S, CST, USA); p-C/EBPβ (#3084S, CST, USA); C/EBPβ (#7964, Santacruz, USA); NQO1 (#3187, CST, USA); GSTP1 (#3369, CST, USA); β-actin (#3700, CST, USA).
2.11. Transfection and infection of the cells
The overexpressing plasmids were purchased from Addgene. The siRNAs were obtained from Santa Cruz. The cells were transfected with 20 nM siRNA or 2 μg plasmid using the Lipofectamine 3000 and P3000 (#L3000075, Invitrogen, USA) using the manufacturer's protocol.
2.12. In vivo mouse model experiments
Animals were housed, maintained, and treated in accordance with protocols approved by the Institutional Animal Care and Use Committee (IACUC) at Emory University. For xenograft animal models, different groups of cells (2 × 10⁶) in 100 μl of PBS were inoculated subcutaneously into 6-week-old nude mice obtained from The Jackson Laboratory. The body weight and the tumor growth were assessed every 3 days. The total tumor volume (TV) was calculated according to the following formula: TV (mm3) = a * b2/2, where “a” is the minimum diameter and “b” denotes the maximum diameter. The mice were euthanized after 28 days.
2.13. Hematoxylin-eosin (H&E) staining and immunohistochemistry
The tumors and primary organs from the nude mice of the above models were fixed in 10% formalin overnight and were then embedded in paraffin. Different sections were prepared and H&E staining was conducted to detect any histological changes of the tumors and organs. The paraffin-embedded samples were stained using Ki67 (#550609, BD, USA) and 4-HNE (#46545, Abcam, USA) antibodies for immunohistochemistry using a technique that has been reported previously. Photographs were taken using a microscope (Olympus, Japan).
2.14. Bioinformatic analysis
Bioinformatic data analysis was obtained from the TCGA data portal (http://cancergenome.nih.gov/dataportal/data/about), UALCAN (http://ualcan.path.uab.edu/index.html) [33] and GlioVis (http://gliovis.bioinfo.cnio.es) respectively [34].
2.15. Statistical analysis
Data visualization and analysis were performed with GraphPad Prism 6 (GraphPad Software Inc., La Jolla, CA, USA). Statistical analysis was performed using either Student's t-test or one-way ANOVA. Significant Difference among groups was assessed as *p < 0.05; **p < 0.01; ***p < 0.001.
3. Results
3.1. C/EBPβ is highly expressed in brain tumors, correlating with poor survival rates
Cancers are tightly associated with extensive inflammation and ROS. C/EBPβ is transcriptionally activated by inflammatory cytokines such as IL-6, IL-1β, and TNF-α, and bacterial LPS [35]. Moreover, its upstream transcription factor Nrf2 is highly active in gliomas [36]. Hence, we hypothesized that C/EBPβ might be escalated and activated in GBM. To test this possibility, we explored whether C/EBPβ is implicated glioma tumorigenesis by searching the TCGA (The Cancer Genome Atlas) database. Remarkably, we found that C/EBPβ was selectively upregulated in GBM versus neighboring non-tumor tissues (Fig. 1A). However, its expression was independent of sex or age in the malignant GBM (Fig. 1B & C). Interestingly, C/EBPβ levels were inversely correlated with overall survival rates and disease-free survival (Fig. 1D &E). Since Nrf2 mediates C/EBPβ mRNA transcription, in addition to both NQO1 and GSTP1, we also analyzed the correlation between C/EBPβ, NQO1 and GSTP1, respectively. Consistent with our findings in GBM patients samples, a positive correlation was observed among the expression of C/EBPβ, NQO1 and GSTP1 (Fig. 1F&G). Hence, these findings suggested that C/EBPβ was upregulated in the tumors tissues of GBM patients, with high C/EBPβ expression correlating to a low patient survival rate.
Fig. 1.

C/EBPβ is the prognostic biomarker in glioblastoma patients.
(A) C/EBPβ expression in TCGA (The Cancer Genome Atlas) GBM samples compared with normal tissues. C/EBPβ expression compared between (B) gender and (C) age in the TCGA data set. (D) Overall survival in TCGA GBM patients stratified according to C/EBPβ expression. (E) Disease-Free Survival in TCGA GBM patients stratified according to C/EBPβ expression. (F) Immunohistochemistry analyses of C/EBPβ, NQO1 and GSTP1 expression in the human tissues. Bar: 100 μm. (G) Correlation between C/EBPβ with NQO1 expression and C/EBPβ with GSTP1 expression.
3.2. C/EBPβ expression couples with ROS concentrations, NQO1 and GSTP1 levels in U87MG cells
Since EGFR is frequently amplified in GBM that is associated with PTEN deletion. These mutations on EGFR affect the redox balance in the cancer cells. To assess whether C/EBPβ is indeed escalated in GBM, we analyzed its mRNA expression levels in PTEN-deficient U87MG glioblastoma cell lines stably transfected with EGFR or EGFRvIII [37]. qRT-PCR (Quantitative RT-PCR) showed C/EBPβ mRNA levels gradually escalated from U87MG to U87MG/EGFR to U87MG/EGFRvIII cells. Giving PTEN back to U87MG cells decreased C/EBPβ levels. Quantification of NQO1 and GSTP1 mRNA displayed a similar pattern to C/EBPβ (Fig. 2A). Immunoblotting revealed C/EBPβ protein concentrations echoed its mRNA levels in different cell lines. It is worth noting that p-C/EBPβ T235, a marker for C/EBPβ activation, was substantially reduced in the presence of PTEN. Consistently, NQO1 and GSTP1 mirrored the C/EBPβ expression patterns (Fig. 2B). Immunofluorescent co-staining demonstrated that as ROS escalated, both NQO1 and GSTP1 fluorescent signals augmented (Fig. 2G and Supplementary Fig. 1A). As expected, U87MG/EGFRvIII exhibited the fastest cell proliferation rates with U87MG/PTEN the slowest (Fig. 2C). LDH assay for the spontaneous cell death also unveiled a similar format (Fig. 2D), indicating that escalated ROS stress somehow increases cell death. To further examine the oxidative stress in these cells, we conducted protein carbonyl assay and GSG/GSSG ratio assay. We corroborated that carbonyl expression was significantly elevated in U87MG/EGFRvIII cells, fitting with ROS levels (Fig. 2E). By contrast, GSH/GSSG ratios were only augmented in U87MG/PTEN cells, inversely correlated with the ROS levels in the cells (Fig. 2F). Hence, C/EBPβ and NQO1 and GSTP1 exhibit the same expression format in U87MG cells and EGFRvIII highly escalates their expression levels.
Fig. 2.

C/EBPβ expression couples with ROS levels in U87MG cells, coupled with NQO1 and GSTP1 levels.
C/EBPβ expression levels correlate with NQO1 and GSTP1 in (A) mRNA and (B) protein levels. Different U87MG cell lines were analyzed by qRT-PCR and immunoblotting. (C) Cell proliferation over 5 days was dramatically increased in EGFRvIII-expressing cells compared with parental U87MG cells. (D) LDH levels, (E) Carbonyl Expression and (F) GSH/GSSG levels of different U87MG cell lines. (G) Co-staining of ROS (Green) with GSTP1 (Red) in 6 cell lines. Bar: 20 μm. Data are means ± SEM (*p < 0.05; **p < 0.01; ***p < 0.001, one way ANOVA, n = 3).
To further interrogate the potential link among the ROS, C/EBPβ and cell proliferation in U87MG/EGFRvIII cells, we treated the cells with various small molecular ROS inhibitors including Ascorbic acid, YCG063, and Acetylcysteine. As a result, these inhibitors strongly repressed ROS levels in U87MG/EGFRvIII cells, associated with robust cell proliferation escalation (Supplementary Fig. 2A &B). Interestingly, immunoblotting showed that these inhibitors evidently decreased p-C/EBPβ and its total levels. Concomitantly, NQO1 and GSTP1 levels were also reduced by these inhibitors as well (Supplementary Fig. 2C). Together these findings suggest that ROS activates p-C/EBPβ, resulting in NQO1 and GSTP1 upregulation.
3.3. C/EBPβ is a transcription factor for both NQO1 and GSTP1 reductases
The tight correlation between C/EBPβ and NQO1/GSTP1 makes us wonder whether C/EBPβ acts as a transcription factor for both NQO1 and GSTP1 as well. To address this possibility, we performed the promoter activity assay with luciferase-conjugated NQO1 and GSTP promoter plasmids, respectively, which were co-transfected with C/EBPβ into the cells. Overexpression of C/EBPβ significantly elevated their luciferase activities compared to the control vector. In contrast, the knocking down of endogenous C/EBPβ in the cells greatly diminished the luciferase activities (Fig. 3A). To determine whether C/EBPβ indeed binds to the DNA on their promoters, we performed ChIP (chromatin immunoprecipitation) assay using C/EBPβ antibody and control IgG. C/EBPβ antibody specifically pulled down NQO1 or GSTP1 genomic DNAs as compared to control IgG, though an equal amount of inputs were employed; Genomic DNA samples were pulled down with anti-Histone H3 and normalized by β-actin primers as the positive control. from both samples (Fig. 3B). Next, we also conducted EMSA (Electrophoretic Mobility Shift Assay) and Supershift Assay to further validate whether C/EBPβ binds to genomic DNAs from these two gene targets. C/EBPβ-containing nuclear extract potently interacted with the hot probe, which was completely competed away from the genomic DNAs by overwhelming cold probe or mut 1 probe; in contrast, mut 2 probe failed to compete C/EBPβ from the hot probe. Remarkably, anti-C/EBPβ but not control IgG incurred a super-shift on the gel, supporting that C/EBPβ specifically associated with the hot probe (Fig. 3C). Together, these studies support that C/EBPβ specifically binds to the promoter DNAs from both NQO1 and GSTP1 genes.
Fig. 3.

C/EBPβ acts as a transcription factor for NQO1 and GSTP1.
(A) Human NQO1 and GSTP1 promoters were constructed within a LightSwitch™ Promoter Reporter Vector. These plasmids were co-transfected into cells with C/EBPβ-GFP overexpression plasmids or siRNA for 48 h. Luciferase activities were calculated by using the Luciferase Reporter Assay System, which indicated the promoter activities. (Mean ± SEM, **P < 0.01 vs. vector, n = 3, one-way ANOVA). (B) ChIP assay was performed to detect the binding sites of C/EBPβ on the NQO1 and GSTP1 promoter. The DNA-protein crosslinking ChIP samples were immunoprecipitated with anti-C/EBPβ antibody or IgG. After reversing crosslinks, PCR assay also detected each input sample. Genomic DNA samples were pulled down with anti-Histone H3 and normalized by β-actin primers as a positive control. The equal amount of input was confirmed with NQO1 and GSTP1. (C) Nuclear extract proteins (NE) were isolated from cells transfected with C/EBPβ-GFP for 48 h. EMSA assay was recruited to detect the C/EBPβ binding ability on site -723~ -705 of NQO1 promoter (AGGGGTGGTGCAGTGGCAT), Mutation probe 1 (AGGGAAAATGCAGTGGCAT) or Mutation probe 2 (AGGGGTGGTGCAGTGAAAA) and supershift; EMSA detect the C/EBPβ binding ability on site -729~ -715 of GSTP1 promoter (CAACATGGTGAAACCCCGT), Mutation probe 1 (CAACAAAATGAAACCCCGT) or Mutation probe 2 (CAACATGGTGAAACCAAAA) and supershift. Data are representative of three independent experiments.
3.4. Knocking down of C/EBPβ in U87MG/EGFRvIII cells increases ROS and diminishes NQO1 and GSTP1 expression
To examine whether indeed C/EBPβ mediates NQO1 and GSTP1 mRNA expression, we chose the parental U87MG and EGFRvIII stably transfected cells. Compared to control siRNA or si-HSF, another transcription factor as control, knocking down of C/EBPβ significantly reduced NQO1 and GSTP1 from U87MG/EGFRvIII cells but not U87MG cells, though C/EBPβ itself was substantially eradicated from both cell lines (Fig. 4A), fitting with the observation that C/EBPβ was selectively upregulated with phosphorylated active status in U87MG/EGFRvIII cells (Fig. 2B). Immunoblotting validated that the deletion of C/EBPβ selectively decreased both NQO1 and GSTP1 expression levels in U87MG/EGFRvIII cells but not U87MG cells (Fig. 4B), in alignment with their reduced mRNAs by C/EBPβ knockdown. Remarkably, depletion of C/EBPβ from U87MG/EGFRvIII cells significantly reduced the cell proliferation as compared to control siRNA or si-HSF. By contrast, these siRNAs displayed no effect on U87MG cell proliferation (Fig. 4C). ROS, carbonyl expression, and GSH/GSSG ratio analysis demonstrated that knocking down of C/EBPβ selectively increased ROS levels and oxidative stresses in U87MG/EGFRvIII cell but not in U87MG cells, whereas si-control or si-HSF had no any effect in ROS levels (Fig. 4D, F & G). LDH assay revealed that the deletion of C/EBPβ specifically enhanced cell death in U87MG/EGFRvIII but not U87MG cells, while si-control or si-HSF had no effect (Fig. 4E). Hence, these data support that C/EBPβ selectively mediates NQO1 and GSTP1 mRNA transcription and protein expression in U87MG/EGFRvIII GBM cells.
Fig. 4.

The knocking down of C/EBPβ in U87MG/EGFRvIII cells increases ROS and diminishes NQO1 and GSTP1 expression.
Knockdown of C/EBPβ reduces NQO1 and GSTP1 expression in (A) mRNA and (B) protein levels in U87MG and U87MG/EGFRvIII cell lines. The cells were analyzed by qRT-PCR and immunoblotting. (C) Cell proliferation over 5 days in U87MG and U87MG/EGFRvIII-expressing cells after knocking down C/EBPβ. (D) The ROS levels, (E) LDH levels, (F) Carbonyl Expression and (G) GSH/GSSG levels in U87MG and U87MG/EGFRvIII cell lines after knocking down C/EBPβ. Data are means ± SEM (*p < 0.05; **p < 0.01; ***p < 0.001, one way ANOVA, n = 3).
We also extended the study into another GBM cell line LN229 that contains intact PTEN. We found that knocking down C/EBPβ led to selective reduction of NQO1 and GSTP1 protein levels in EGFR-overexpressed LN229 cells but not the parental cells. In contrast, si-HSF or control siRNA revealed no effect in either cell line (Supplementary. Fig 3A). In alignment with U87MG/EGFRvIII cell line, the depletion of C/EBPβ selectively decreased LN229/EGFR cell proliferation without affecting LN229 cell growth (Supplementary Fig. 3B). Markedly, ROS and cell death were significantly elevated in LN229/EGFR but not LN229 cells, when C/EBPβ was deleted. By contrast, the deletion of HSF exhibited no demonstrable effect in either cell line (Supplementary Fig. 3C & D).
3.5. Overexpression of C/EBPβ in U87MG/EGFRvIII cells reduces ROS and escalates NQO1 and GSTP1 levels
To further investigate the roles of C/EBPβ on NQO1 and GSTP1 expression, we overexpressed C/EBPβ, HSF or control vector into U87MG and U87MG/EGFRvIII cells. qRT-PCR showed that C/EBPβ overexpression greatly escalated both NQO1 and GSTP1 mRNAs in U87MG/EGFRvIII cells but not in U87MG cells, though C/EBPβ was greatly expressed in both cell lines. By contrast, HSF or control vector displayed no effect (Fig. 5A). Western blotting confirmed that overexpression of C/EBPβ selectively augmented NQO1 and GSTP1 in U87MG/EGFRvIII cells but not in U87MG cells, albeit C/EBPβ was highly overexpressed in both cells (Fig. 5B). As expected, C/EBPβ overexpression significantly enhanced U87MG/EGFRvIII cell proliferation compared with the control vector or HSF. In contrast, it failed to stimulate U87MG cell proliferation as compared to control or HSF plasmid (Fig. 5C). The deletion of C/EBPβ also selectively reduced ROS levels and carbonyl expression and increased ratio of GSH/GSSG in U87MG/EGFRvIII cells as compared to U87MG cells. Again, control vector or HSF overexpression exhibited no effect in the oxidative stresses (Fig. 5D, F & G). Consistently, overexpression of C/EBPβ significantly decreased cell death in U87MG/EGFRvIII cell versus U87MG cells; by contrast, HSF overexpression did not affect LDH levels in any of the cell lines (Fig. 5E).
Fig. 5.

Overexpression of C/EBPβ in U87MG/EGFRvIII cells reduces ROS and escalates NQO1 and GSTP1 levels.
Overexpression of C/EBPβ increases NQO1 and GSTP1 expression in (A) mRNA and (B) protein levels in U87MG and U87MG/EGFRvIII cell line. The cells were analyzed by qRT-PCR and immunoblotting. (C) Cell proliferation over 5 days in U87MG and U87MG/EGFRvIII-expressing cells after overexpression C/EBPβ. (D) The ROS levels, (E) LDH levels, (F) Carbonyl Expression and (G) GSH/GSSG levels in U87MG and U87MG/EGFRvIII cell lines after overexpression C/EBPβ. Data are means ± SEM (*p < 0.05; **p < 0.01; ***p < 0.001, one way ANOVA, n = 3).
Next, we also extended our study into LN229 and LN229/EGFR cells. Once more, overexpression of C/EBPβ selectively increased NQO1 and GSTP1 in LN229/EGFR but not LN229 cells. In contrast, HSF exhibited no detectable effect (Supplementary Fig. 4A). Consequently, C/EBPβ but not HSF overexpression significantly stimulated LN229/EGFR cell proliferation. However, neither of them augmented LN229 cell proliferation (Supplementary Fig. 4B). Fitting with NQO1 and GSTP1 reductases elevation by C/EBPβ overexpression, ROS levels in LN229/EGFR cells were reduced as compared to LN229 cells, and the cell death also displayed the same effect as revealed by LDH assay (Supplementary Fig. 4C & D). Hence, C/EBPβ selectively affects ROS and cell proliferation via mediating NQO1 and GSTP1 expression in the context of EGFR overexpression.
3.6. Deletion of NQO1 and GSTP1 abolishes C/EBPβ overexpression-regulated ROS and cell proliferation
To interrogate whether NQO1 and GSTP1 indeed act downstream of C/EBPβ and mediate its biological functions in U87MG/EGFRvIII cells, we knocked down NQO1 or GSTP1 separately or simultaneously in the presence of C/EBPβ overexpression. Cell proliferation assay demonstrated that the deletion of NQO1 or GSTP1 significantly reduced cell proliferation, and the maximal effect occurred when both of them were deleted in control vector-transfected cells. C/EBPβ overexpression strongly stimulated cell proliferation. However, when NQO1 and GSTP1 both were deleted, the stimulatory effect was significantly abrogated (Fig. 6A). Immunoblotting validated the overexpression of C/EBPβ and knockdown of NQO1 and GSTP1 in the transfected cells (Fig. 6B). LDH assay revealed that deleting both of NQO1 and GSTP1 increased cell death in control vector or C/EBPβ overexpressed U87MG/EGFRvIII cells (Fig. 6C), inversely correlated with cell proliferation results. As expected, overexpression of C/EBPβ strongly repressed ROS levels in U87MG/EGFRvIII cells due to the high expression of the reductases of NQO1 and GSTP1. Accordingly, deleting either of NQO1 or GSTP1 or both strongly escalated ROS levels (Fig. 6D). Thus, C/EBPβ mediates U87MG/EGFRvIII cell proliferation and decreases the ROS via regulating NQO1 and GSTP1 reductases’ expression.
Fig. 6.

Deletion of NQO1 and GSTP1 abolishes C/EBPβ overexpression regulated ROS and cell proliferation.
(A) Cell proliferation over 5 days in U87MG/EGFRvIII-expressing cells after overexpressing C/EBPβ and knocking down NQO1 and GSTP1. (B) Western blot analysis of U87MG/EGFRvIII cells C/EBPβ and knocking down NQO1 and GSTP1. (C) The LDH levels and (D) The ROS levels in U87MG and U87MG/EGFRvIII cell lines after overexpressing C/EBPβ and knocking down NQO1 and GSTP1. Data are means ± SEM (*p < 0.05; **p < 0.01; ***p < 0.001, one way ANOVA, n = 3).
To further assess whether NQO1 and GSTP1 are required for mediating C/EBPβ’s biological effects, we treated C/EBPβ-overexpressed U87MG/EGFRvIII cells with vehicle control or the inhibitor MNPC that simultaneously blocks both NQO1 and GSTP1 reductase activities. MNPC is a derivative of FDA-approved nitazoxanide (NTZ) and tizoxanide (TIZ) for treating antiparasitic and cryptosporidium-infection that inhibits reductases including NQO1 and GSTP1 [38,39]. Interestingly, MNPC significantly inhibited U87MG/EGFRvIII cell growth as compared to vehicle control. It displayed a similar antagonistic effect in C/EBPβ overexpressed U87MG/EGFRvIII cells as well (Supplementary Fig. 5A &B). Interestingly, MNPC considerably elevated LDH activities and ROS levels in U87MG/EGFRvIII cells. The stimulatory effect was pronouncedly decreased when C/EBPβ was transfected (Supplementary Fig. 5C & D). Therefore, blocking NQO1 and GSTP1 substantially diminishes C/EBPβ overexpression-elicited effects, supporting that these reductases upregulation mediates the biological events triggered by C/EBPβ.
3.7. C/EBPβ modulates NQO1 and GSTP1 and ROS levels, mediating GBM proliferation in vivo
To explore whether C/EBPβ also mediates U87MG/EGFRvIII proliferation in vivo, we established the stably transfected cells by overexpressing or knocking down of C/EBPβ. The GFP-C/EBPβ or GFP-shRNA-C/EBPβ plasmid transfected cells were validated by immunofluorescent staining and immunoblotting (Supplementary Fig. 6A & B). The stable cells were inoculated in nude mice subcutaneously, and the tumor volumes were quantitatively measured at different time points. The tumor growth did not significantly affect the nude mice body weight (Fig. 7A). Noticeably, overexpression of C/EBPβ strongly stimulated tumor growth as compared to control cells; in contrast, the deletion of C/EBPβ robustly reduced tumor growth (Fig. 7B&D). After the termination of the experiment, we monitored tumor weights and found that C/EBPβ overexpression significantly elevated tumor weights, whereas depletion of C/EBPβ mitigated tumor weights compared to control (Fig. 7C). H&E staining showed the major organs appeared normal (Fig. 7E). Ki67 staining supported that cell proliferation was strongly escalated in C/EBPβ overexpressed cells, while the deletion of C/EBPβ prominently attenuated cell proliferation in the tumors as compared to control (Fig. 7F, middle panels). ROS staining assay with 4-HNE (4-hydroxynonenal), a marker for ROS level, showed that C/EBPβ overexpression evidently ameliorated ROS. By contrast, the deletion of C/EBPβ strongly augmented ROS levels, inversely coupled with NQO1 and GSTP1 immunohistochemical staining (Fig. 7F & G).
Fig. 7.

The effect of C/EBPβ in the nude mice model.
(A) The body weight of mice during the experiment. (B) Tumor growth suppression caused by different groups. (C) Tumor weight of the mice at the endpoint. Significant differences are considered when *p < 0.05; **p < 0.01; ***p < 0.001. (D) Tumor growth suppression caused by different groups. (E) Histological analysis of hematoxylin-eosin stained heart, liver, spleen, lung, and kidney of different mice groups. Bar: 100 μm. (F) H&E, Ki67 and 4-HNE staining of tumor slices in various groups. Bar: 100 μm. (G) IHC staining of C/EBPβ, NQO1, and GSTP1 in tumor slices in various groups. Bar: 100 μm. . Data are means ± SEM (*p < 0.05; **p < 0.01; ***p < 0.001, one way ANOVA, n = 3).
4. Discussion
Most of the cancer cells rely on highly progressed glycolytic activity to substantially acquire energy (i.e. the Warburg effect) and are prone to be induced into the oxidative stress state due to the elevation of ROS [40]. The regulation of oxidative stress is an important factor in both tumor development and responses to anticancer therapies. In the current report, we show that C/EBPβ, which is mediated by the ROS sensitive transcription factor Nrf2, regulates the reductases NQO1 and GSTP1 mRNA transcription and protein expression in GBM cell lines with EGFR amplification. Overexpression of C/EBPβ increases both of the reductases, leading to repression of ROS and increased cell proliferation. On the other hand, depletion of C/EBPβ significantly attenuates both reductases’ expression, resulting in the escalation of ROS and decreased cell proliferation in EGFR overexpressed GBM cells. Employing siRNA to knock down both of them, we found that C/EBPβ-triggered cell proliferation and ROS reduction are primarily mediated by these two reductases. In alignment with these findings, the tumor volumes from C/EBPβ stably expressed U87MG/EGFRvIII cells are much larger than those from C/EBPβ-depleted cells. Concurrently, the GBM cell proliferation in C/EBPβ-overexpressed U87MG/EGFRvIII cells, validated with Ki67 staining, is highly augmented as compared to C/EBPβ knocked down cells. These effects are associated with increased NQO1 and GSTP1 levels and reduced ROS levels. Hence, our findings demonstrated that C/EBPβ plays a key role in mediating redox status in EGFR-amplified malignant GBM cells via modulating the reductases NQO1 and GSTP1 expression. Interestingly, deletion or inhibition of these two reductases significantly represses cell proliferation and increases cell death (Fig. 6 & Fig. S5), and these events are tightly coupled with ROS escalation due to reductase inactivation. Hence, disruption of the fragile balance between the elevated ROS and reductase activities in EGFR-amplified GBM effectively triggers GBM cell death, resulting in suppression of cell proliferation.
Mammalian cells have an ingenious antioxidant system that serves to protect them from excessive intracellular ROS and extracellular oxidants. Superoxide dismutases (SODs), catalases, and glutathionylation-related enzymes are representative antioxidant enzymes that balance the ROS levels and protect cellular components from oxidative harmfulness. Of the glutathionylation-related enzymes, the glutathione S-transferases (GSTs) superfamily is classically identified as phase II detoxifying enzymes that contribute to neutralizing exogenous as well as endogenous electrophiles, including ROS, through the conjugation of glutathione (GSH) [41]. In humans, GST superfamily consists of numerous isozymes, including pi (GSTP), etc. [42]. Of the seven GST isotypes, GSTP1 acts as a predominant member, and GSTP-silencing using siRNA results in a remarkable hampering of cancer cell growth and promoted excessive ROS generation [43]. GSTP intervenes in various cellular events via its non-enzymatic activity and plays a pivotal role in cellular proliferation. GSTP binds to c-Jun N-terminal kinase (JNK) as a natural inhibitor of JNK in cancer cells, leading to resistance to apoptosis [44]. Accordingly, many GSTP inhibitors have been developed [45]. For instance, GSH analog TLK117, an esterified ezatiostat (TLK199) that binds to GSTP and induces JNK activation, is in a clinical trial for the treatment of myelodysplastic syndrome [46]. The SNP in the GSTP1 gene (rs1695) is a substitution of A [Iso] to G [Val] at position 105 leads to miscoded GSTP1 protein with decreased enzymatic activity and less effective detoxification. A Val variant of GSTP1 has been reported as a risk factor in esophageal cancer [47] and in Asian-associated breast cancer [48,49]. NQO1 is also a phase II detoxifying enzyme that may be involved in cancer prevention. NQO1 genetic C609T polymorphism is associated with the risk of various cancers [[50], [51], [52]]. A polymorphic form of NQO1 (p.P187S) is associated with increased cancer risk and certain neurological disorders (such as multiple sclerosis and Alzheimer's disease), possibly due to its roles in the antioxidant defense. p.P187S has greatly reduced FAD affinity and stability, due to destabilization of the flavin binding site and the C-terminal domain, which leads to reduced activity and enhanced degradation [53].
High ROS levels are generally detrimental to cells, and the redox status of cancer cells usually differs from that of normal cells. Because of metabolic and signaling aberrations, cancer cells exhibit elevated ROS levels. For instance, EGFR amplification and mutation are detected in more than 40% of malignant GBM. Accordingly, we show that ROS levels and cell proliferation and C/EBPβ are all coordinately elevated in U87MG/EGFR and LN229/EGFR as compared to their parental cells, associated with enhanced levels of reductase NQO1 and GSTP1 to counteract the harmful ROS (Fig. 2, Fig. S1). The NQO1 and ROS levels in U87MG cells discrepany in our previous report and the current studies might be due to the different treatments and time windows. For instance, the cellular ROS and NQO1 levels were immediately analyzed after EGF treatment previously, whereas the cells in the current study are not treated with EGF [19]. Stimulation of EGFR by EGF induces endogenous production of intracellular reactive oxygen species (ROS) and H2O2 in cancer cell lines [8,11] that subsequently alter NQO1 temporal expression. To ascertain that these reductases indeed are accountable for C/EBPβ-mediated cell proliferation and balanced oxidative stress, we manipulate C/EBPβ levels and find that both cell proliferation and ROS tightly oscillate upstream C/EBPβ and downstream NQO1 and GSTP1 (Fig. 4, Fig. 5, Fig. S3 and Fig. S4). Notably, depletion of NQO1/GSTP1 or inhibition of these reductases robustly blunts C/EBPβ’s stimulatory activities (Fig. 6, Fig. S5). It is worth noting that these effects are only observed in EGFR-amplified GBM cells but not in normal EGFR GBM cells, indicating that C/EBPβ activity is somehow mediated by EGFR signaling. Interestingly, C/EBPβ T235 is greatly phosphorylated and activated by p-MAPK [54], one of the key downstream effectors of the EGFR signaling pathway, supporting this conjecture. Furthermore, p-C/EBPβ signals in EGFR or EGFRvIII GBM cells are much stronger than parent cells (Fig. 2, Fig. 4, Fig. S3).
The observation that this is balanced by an increased antioxidant capacity suggests that high ROS levels may constitute a barrier to tumorigenesis. However, ROS can also promote tumor formation by inducing DNA mutations and pro-oncogenic signaling pathways. These contradictory effects have important implications for potential anticancer strategies that aim to modulate levels of ROS [2]. Nrf2 might be the most important regulator of the expression of molecules that possess antioxidant functions. Under resting conditions, Nrf2 is constitutively degraded by the Kelch-like ECH-associated protein 1 (KEAP1)-Cullin 3 (CUL3) E3 ligase complex [55]. Under the oxidative stress, KEAP1 is oxidized and modified so that it cannot bind to Nrf2, thereby leading to the stabilization of Nrf2 and its translocation to the nucleus [56]. Transcriptional activation of antioxidant genes through an antioxidant response element (ARE) is largely dependent upon Nrf2. The genes that contain a functional ARE include those encoding GSTA1, GSTA2, NQO1, and gamma-glutamylcysteine synthetase heavy and light subunits that play a role in defense against oxidative stress. Besides these reductases, C/EBPβ has been reported to be the downstream target gene of Nrf2 [18]. C/EBPβ plays multiple physiological roles. By regulating transcription of specific sets of genes, it participates in a cell-specific manner in cellular programs such as cell differentiation, proliferation, cell death and survival, energy metabolism as well as in more global responses such as inflammation. The C/EBPβ mRNA expression is elevated in 100% of mammary tumors isolated from these ErbB2 overexpressing mice and, interestingly, C/EBPα mRNA is detected at low levels in 30% of tumors, C/EBPδ mRNA at variable levels in 50% of the tumors, and CHOP mRNA is detectable in most of the tumors examined [57]. Fitting with our observations that C/EBPβ is elevated in malignant brain tumors (Fig. 1), C/EBPβ expression is increased breast cancer, ovarian tumors and colorectal tumors [[27], [28], [29], [30]]. Noticeably, C/EBPβ −/− mice are refractory to tumorigenesis [31]. This finding is consistent with our observation that C/EBPβ depletion decreases NQO1 and GSTP1 expression and reduces U87MG/EGFRvIII and LN229/EGFR cell proliferation, inversely coupled with increased ROS levels (Fig. 4, Fig. 7).
It is well understood that the deregulation of tumor-suppressor genes and oncogenes frequently affects intracellular ROS levels [58]. Cancer cells are constantly challenged by the need to balance oxidative stress and control ROS levels as ROS exerts both pro- and anti-growth effects in cancer [2]. As high ROS levels are harmful to cells, oxidative stress can have a tumor-suppressive effect. The induction of oxidative stress can lead to the preferential killing of cancer cells. Numerous drugs with direct or indirect effects on ROS have been used for effective cancer therapies. Drugs that directly affect ROS metabolism target two of the three major antioxidant pathways, such as those involving reduced glutathione and thioredoxin [2]. Currently, a number of anticancer agents are being developed based on the modulation of cellular oxidative stress with strategies to regulate cellular ROS levels [2]. Accordingly, we employed the dual inhibitor MNPC that simultaneously binds and blocks both NQO1 and GSTP1, and found that MNPC significantly reduces C/EBPβ overexpressed U87MG/EGFRvIII cell proliferation, associated with increased ROS and cell death validated by LDH assay (Fig. S5). The efficacy of EGFR-targeted small-molecule inhibitors or monoclonal antibodies in glioblastomas that also have mutation or deletion of the gene encoding phosphatase and tensin homolog (PTEN) has been modest [10,59]. Conceivably, crushing the tenuous redox balance in EGFR-amplified gliomas using small molecular inhibitors blocking NQO1 and GSTP1 reductases might provide an innovative pharmacological intervention strategy for treating these lethal diseases.
Grant support
This work is funded with Federal funds from National Cancer Institute (NCI), National Institutes of Health (NIH) NIH grant RO1 CA186918 (K.Y.).
Dr. Kecheng Lei was supported by a grant from China Postdoctoral Science Foundation (2018M632168).
Declaration of competing interest
No potential conflicts of interest were disclosed.
Acknowledgments
The authors are thankful for Dr. Paul S. Mischel, Department of Pathology, UCSD School of Medicine, La Jolla, CA 92093, USA; Moores Cancer Center, UCSD School of Medicine, La Jolla, CA 92093, USA, for the U87MG stable cell lines. In addition, the authors are indebted to Dr. William Weiss at UCSF for the LN229/EGFR cell line.
Footnotes
Supplementary data to this article can be found online at https://doi.org/10.1016/j.redox.2020.101578.
Contributor Information
Lingjing Jin, Email: lingjingjin@163.com.
Keqiang Ye, Email: kye@emory.edu.
Appendix A. Supplementary data
The following are the supplementary data to this article:
Immunofluorescent co-staining of ROS and NQO1 fluorescent signals in different U87MG cell lines. (A) Co-staining of ROS (Green) with (A) NQO1 (Red) in 6 cell lines. Bar: 20 μm.
Knocking down the ROS in U87MG/EGFRvIII cells diminishes C/EBPβ, NQO1, and GSTP1 expression. (A) The ROS level and (B) cell proliferation over 5 days U87MG/EGFRvIII-expressing cells. (C) Western blot analysis of U87 MG/EGFRvIII cells after ROS inhibitors treatment. Data are means ± SEM (*p < 0.05; **p < 0.01; ***p < 0.001, one way ANOVA, n = 3).
The knocking down of C/EBPβ in LN229/EGFR cells increases ROS and diminishes NQO1 and GSTP1 expression. (A) The knockdown of C/EBPβ reduces NQO1 and GSTP1 expression in LN229 and LN229/EGFR cells. The cells were analyzed by immunoblotting. (B) Cell proliferation over 5 days in LN229 and LN229/EGFR cells after knocking down C/EBPβ. (C) The ROS levels and (D) LDH levels in LN229 and LN229/EGFR cells after knocking down C/EBPβ. Data are means ± SEM (*p < 0.05; **p < 0.01; ***p < 0.001, one way ANOVA, n = 3).
Overexpression of C/EBPβ in LN229/EGFR cells reduces ROS and escalates NQO1 and GSTP1 levels. (A) Overexpression of C/EBPβ increases NQO1 and GSTP1 expression in the LN229/EGFR cells. The cells were analyzed by immunoblotting. (B) Cell proliferation over 5 days in LN229 and LN229/EGFR cells after overexpressing C/EBPβ. (C) The ROS levels and (D) LDH levels in LN229 and LN229/EGFR cells after overexpressing C/EBPβ. Data are means ± SEM (*p < 0.05; **p < 0.01; ***p < 0.001, one way ANOVA, n = 3).
NQO1 and GSTP1 are required for mediating C/EBPβ’s biological effects. (A) Cell proliferation over 5 days in U87MG/EGFRvIII-expressing cells after overexpressing C/EBPβ, followed by dual inhibitor MNPC treatment. (B)Western blot analysis of U87MG/ EGFRvIII cells after overexpressing C/EBPβ and dual inhibitor MNPC treatment. (C) The ROS levels and (D) LDH levels after overexpressing C/EBPβ and dual inhibitor MNPC treatment. Data are means ± SEM (*p < 0.05; **p < 0.01; ***p < 0.001, one way ANOVA, n = 3).
The effect of C/EBPβ in the stable cell lines. (A) The images of stable cell lines were captured under a fluorescence microscope. Bar: 100 μm; (B) Protein levels of C/EBPβ, GSTP1, and NQO1 in different stable cell lines.
References
- 1.Cairns R.A., Harris I.S., Mak T.W. Regulation of cancer cell metabolism. Nat. Rev. Canc. 2011;11:85–95. doi: 10.1038/nrc2981. [DOI] [PubMed] [Google Scholar]
- 2.Gorrini C., Harris I.S., Mak T.W. Modulation of oxidative stress as an anticancer strategy. Nat. Rev. Drug Discov. 2013;12:931–947. doi: 10.1038/nrd4002. [DOI] [PubMed] [Google Scholar]
- 3.Furnari F.B., Cloughesy T.F., Cavenee W.K., Mischel P.S. Heterogeneity of epidermal growth factor receptor signalling networks in glioblastoma. Nat. Rev. Canc. 2015;15:302–310. doi: 10.1038/nrc3918. [DOI] [PMC free article] [PubMed] [Google Scholar]
- 4.Wong A.J., Ruppert J.M., Bigner S.H., Grzeschik C.H., Humphrey P.A., Bigner D.S., Vogelstein B. Structural alterations of the epidermal growth factor receptor gene in human gliomas. Proc. Natl. Acad. Sci. U. S. A. 1992;89:2965–2969. doi: 10.1073/pnas.89.7.2965. [DOI] [PMC free article] [PubMed] [Google Scholar]
- 5.Ekstrand A.J., Sugawa N., James C.D., Collins V.P. Amplified and rearranged epidermal growth factor receptor genes in human glioblastomas reveal deletions of sequences encoding portions of the N- and/or C-terminal tails. Proc. Natl. Acad. Sci. U. S. A. 1992;89:4309–4313. doi: 10.1073/pnas.89.10.4309. [DOI] [PMC free article] [PubMed] [Google Scholar]
- 6.Kong P., Lei P., Zhang S., Li D., Zhao J., Zhang B. Integrated microarray analysis provided a new insight of the pathogenesis of Parkinson's disease. Neurosci. Lett. 2018;662:51–58. doi: 10.1016/j.neulet.2017.09.051. [DOI] [PubMed] [Google Scholar]
- 7.Fan Q.W., Weiss W.A. Targeting the RTK-PI3K-mTOR axis in malignant glioma: overcoming resistance. Curr. Top. Microbiol. Immunol. 2010;347:279–296. doi: 10.1007/82_2010_67. [DOI] [PMC free article] [PubMed] [Google Scholar]
- 8.Bae Y.S., Kang S.W., Seo M.S., Baines I.C., Tekle E., Chock P.B., Rhee S.G. Epidermal growth factor (EGF)-induced generation of hydrogen peroxide. Role in EGF receptor-mediated tyrosine phosphorylation. J. Biol. Chem. 1997;272:217–221. [PubMed] [Google Scholar]
- 9.Ohgaki H., Kleihues P. Genetic pathways to primary and secondary glioblastoma. Am. J. Pathol. 2007;170:1445–1453. doi: 10.2353/ajpath.2007.070011. [DOI] [PMC free article] [PubMed] [Google Scholar]
- 10.Reardon D.A., Ligon K.L., Chiocca E.A., Wen P.Y. One size should not fit all: advancing toward personalized glioblastoma therapy. Discov. Med. 2015;19:471–477. [PubMed] [Google Scholar]
- 11.Miller E.W., Tulyathan O., Isacoff E.Y., Chang C.J. Molecular imaging of hydrogen peroxide produced for cell signaling. Nat. Chem. Biol. 2007;3:263–267. doi: 10.1038/nchembio871. [DOI] [PubMed] [Google Scholar]
- 12.Nishikawa R., Ji X.D., Harmon R.C., Lazar C.S., Gill G.N., Cavenee W.K., Huang H.J. A mutant epidermal growth factor receptor common in human glioma confers enhanced tumorigenicity. Proc. Natl. Acad. Sci. U. S. A. 1994;91:7727–7731. doi: 10.1073/pnas.91.16.7727. [DOI] [PMC free article] [PubMed] [Google Scholar]
- 13.Nitta M., Kozono D., Kennedy R., Stommel J., Ng K., Zinn P.O., Kushwaha D., Kesari S., Inda M.M., Wykosky J., Furnari F., Hoadley K.A., Chin L., DePinho R.A., Cavenee W.K., D'Andrea A., Chen C.C. Targeting EGFR induced oxidative stress by PARP1 inhibition in glioblastoma therapy. PloS One. 2010;5 doi: 10.1371/journal.pone.0010767. [DOI] [PMC free article] [PubMed] [Google Scholar]
- 14.Jones R.G., Thompson C.B. Tumor suppressors and cell metabolism: a recipe for cancer growth. Genes Dev. 2009;23:537–548. doi: 10.1101/gad.1756509. [DOI] [PMC free article] [PubMed] [Google Scholar]
- 15.Diehn M., Cho R.W., Lobo N.A., Kalisky T., Dorie M.J., Kulp A.N., Qian D., Lam J.S., Ailles L.E., Wong M., Joshua B., Kaplan M.J., Wapnir I., Dirbas F.M., Somlo G., Garberoglio C., Paz B., Shen J., Lau S.K., Quake S.R., Brown J.M., Weissman I.L., Clarke M.F. Association of reactive oxygen species levels and radioresistance in cancer stem cells. Nature. 2009;458:780–783. doi: 10.1038/nature07733. [DOI] [PMC free article] [PubMed] [Google Scholar]
- 16.Favreau L.V., Pickett C.B. The rat quinone reductase antioxidant response element. Identification of the nucleotide sequence required for basal and inducible activity and detection of antioxidant response element-binding proteins in hepatoma and non-hepatoma cell lines. J. Biol. Chem. 1995;270:24468–24474. doi: 10.1074/jbc.270.41.24468. [DOI] [PubMed] [Google Scholar]
- 17.Motohashi H., O'Connor T., Katsuoka F., Engel J.D., Yamamoto M. Integration and diversity of the regulatory network composed of Maf and CNC families of transcription factors. Gene. 2002;294:1–12. doi: 10.1016/s0378-1119(02)00788-6. [DOI] [PubMed] [Google Scholar]
- 18.Hou Y., Xue P., Bai Y., Liu D., Woods C.G., Yarborough K., Fu J., Zhang Q., Sun G., Collins S., Chan J.Y., Yamamoto M., Andersen M.E., Pi J. Nuclear factor erythroid-derived factor 2-related factor 2 regulates transcription of CCAAT/enhancer-binding protein beta during adipogenesis. Free Radic. Biol. Med. 2012;52:462–472. doi: 10.1016/j.freeradbiomed.2011.10.453. [DOI] [PMC free article] [PubMed] [Google Scholar]
- 19.Luo S., Lei K., Xiang D., Ye K. NQO1 is regulated by PTEN in glioblastoma, mediating cell proliferation and oxidative stress. Oxid. Med. Cell. Longev. 2018;2018:9146528. doi: 10.1155/2018/9146528. [DOI] [PMC free article] [PubMed] [Google Scholar]
- 20.Zahnow C.A. CCAAT/enhancer binding proteins in normal mammary development and breast cancer. Breast Cancer Res. 2002;4:113–121. doi: 10.1186/bcr428. [DOI] [PMC free article] [PubMed] [Google Scholar]
- 21.Lu M., Seufert J., Habener J.F. Pancreatic beta-cell-specific repression of insulin gene transcription by CCAAT/enhancer-binding protein beta. Inhibitory interactions with basic helix-loop-helix transcription factor E47. J. Biol. Chem. 1997;272:28349–28359. doi: 10.1074/jbc.272.45.28349. [DOI] [PubMed] [Google Scholar]
- 22.Straccia M., Gresa-Arribas N., Dentesano G., Ejarque-Ortiz A., Tusell J.M., Serratosa J., Sola C., Saura J. Pro-inflammatory gene expression and neurotoxic effects of activated microglia are attenuated by absence of CCAAT/enhancer binding protein beta. J. Neuroinflammation. 2011;8:156. doi: 10.1186/1742-2094-8-156. [DOI] [PMC free article] [PubMed] [Google Scholar]
- 23.Akira S., Isshiki H., Sugita T., Tanabe O., Kinoshita S., Nishio Y., Nakajima T., Hirano T., Kishimoto T. A nuclear factor for IL-6 expression (NF-IL6) is a member of a C/EBP family. EMBO J. 1990;9:1897–1906. doi: 10.1002/j.1460-2075.1990.tb08316.x. [DOI] [PMC free article] [PubMed] [Google Scholar]
- 24.Meir O., Dvash E., Werman A., Rubinstein M. C/EBP-beta regulates endoplasmic reticulum stress-triggered cell death in mouse and human models. PloS One. 2010;5 doi: 10.1371/journal.pone.0009516. [DOI] [PMC free article] [PubMed] [Google Scholar]
- 25.Trautwein C., Caelles C., van der Geer P., Hunter T., Karin M., Chojkier M. Transactivation by NF-IL6/LAP is enhanced by phosphorylation of its activation domain. Nature. 1993;364:544–547. doi: 10.1038/364544a0. [DOI] [PubMed] [Google Scholar]
- 26.Hungness E.S., Luo G.J., Pritts T.A., Sun X., Robb B.W., Hershko D., Hasselgren P.O. Transcription factors C/EBP-beta and -delta regulate IL-6 production in IL-1beta-stimulated human enterocytes. J. Cell. Physiol. 2002;192:64–70. doi: 10.1002/jcp.10116. [DOI] [PubMed] [Google Scholar]
- 27.Raught B., Gingras A.C., James A., Medina D., Sonenberg N., Rosen J.M. Expression of a translationally regulated, dominant-negative CCAAT/enhancer-binding protein beta isoform and up-regulation of the eukaryotic translation initiation factor 2alpha are correlated with neoplastic transformation of mammary epithelial cells. Canc. Res. 1996;56:4382–4386. [PubMed] [Google Scholar]
- 28.Zahnow C.A., Younes P., Laucirica R., Rosen J.M. Overexpression of C/EBPbeta-LIP, a naturally occurring, dominant-negative transcription factor, in human breast cancer. J. Natl. Cancer Inst. 1997;89:1887–1891. doi: 10.1093/jnci/89.24.1887. [DOI] [PubMed] [Google Scholar]
- 29.Sundfeldt K., Ivarsson K., Carlsson M., Enerback S., Janson P.O., Brannstrom M., Hedin L. The expression of CCAAT/enhancer binding protein (C/EBP) in the human ovary in vivo: specific increase in C/EBPbeta during epithelial tumour progression. Br. J. Canc. 1999;79:1240–1248. doi: 10.1038/sj.bjc.6690199. [DOI] [PMC free article] [PubMed] [Google Scholar]
- 30.Rask K., Thorn M., Ponten F., Kraaz W., Sundfeldt K., Hedin L., Enerback S. Increased expression of the transcription factors CCAAT-enhancer binding protein-beta (C/EBBeta) and C/EBzeta (CHOP) correlate with invasiveness of human colorectal cancer. Int. J. Canc. 2000;86:337–343. doi: 10.1002/(sici)1097-0215(20000501)86:3<337::aid-ijc6>3.0.co;2-3. [DOI] [PubMed] [Google Scholar]
- 31.Zhu S., Yoon K., Sterneck E., Johnson P.F., Smart R.C. CCAAT/enhancer binding protein-beta is a mediator of keratinocyte survival and skin tumorigenesis involving oncogenic Ras signaling. Proc. Natl. Acad. Sci. U. S. A. 2002;99:207–212. doi: 10.1073/pnas.012437299. [DOI] [PMC free article] [PubMed] [Google Scholar]
- 32.Wang M.Y., Lu K.V., Zhu S., Dia E.Q., Vivanco I., Shackleford G.M., Cavenee W.K., Mellinghoff I.K., Cloughesy T.F., Sawyers C.L. Mammalian target of rapamycin inhibition promotes response to epidermal growth factor receptor kinase inhibitors in PTEN-deficient and PTEN-intact glioblastoma cells. Canc. Res. 2006;66:7864–7869. doi: 10.1158/0008-5472.CAN-04-4392. [DOI] [PubMed] [Google Scholar]
- 33.Chandrashekar D.S., Bashel B., Sah B., Creighton C.J., Ponce-Rodriguez I., Bvsk C., Varambally S. UALCAN: a portal for facilitating tumor subgroup gene expression and survival analyses. Neoplasia. 2017;19:649–658. doi: 10.1016/j.neo.2017.05.002. [DOI] [PMC free article] [PubMed] [Google Scholar]
- 34.Bowman R.L., Wang Q., Carro A., Verhaak R.G., Squatrito M. GlioVis data portal for visualization and analysis of brain tumor expression datasets. Neuro Oncol. 2017;19:139–141. doi: 10.1093/neuonc/now247. [DOI] [PMC free article] [PubMed] [Google Scholar]
- 35.Cloutier A., Guindi C., Larivee P., Dubois C.M., Amrani A., McDonald P.P. Inflammatory cytokine production by human neutrophils involves C/EBP transcription factors. J. Immunol. 2009;182:563–571. doi: 10.4049/jimmunol.182.1.563. [DOI] [PubMed] [Google Scholar]
- 36.Cong Z.X., Wang H.D., Wang J.W., Zhou Y., Pan H., Zhang D.D., Zhu L. ERK and PI3K signaling cascades induce Nrf2 activation and regulate cell viability partly through Nrf2 in human glioblastoma cells. Oncol. Rep. 2013;30:715–722. doi: 10.3892/or.2013.2485. [DOI] [PubMed] [Google Scholar]
- 37.Wang M.Y., Lu K.V., Zhu S., Dia E.Q., Vivanco I., Shackleford G.M., Cavenee W.K., Mellinghoff I.K., Cloughesy T.F., Sawyers C.L., Mischel P.S. Mammalian target of rapamycin inhibition promotes response to epidermal growth factor receptor kinase inhibitors in PTEN-deficient and PTEN-intact glioblastoma cells. Canc. Res. 2006;66:7864–7869. doi: 10.1158/0008-5472.CAN-04-4392. [DOI] [PubMed] [Google Scholar]
- 38.Müller J., Sidler D., Nachbur U., Wastling J., Brunner T., Hemphill A. Thiazolides inhibit growth and induce glutathione‐S‐transferase Pi (GSTP1)‐dependent cell death in human colon cancer cells. Int. J. Canc. 2008;123:1797–1806. doi: 10.1002/ijc.23755. [DOI] [PubMed] [Google Scholar]
- 39.Lam K.K., Zheng X., Forestieri R., Balgi A.D., Nodwell M., Vollett S., Anderson H.J., Andersen R.J., Av-Gay Y., Roberge M. Nitazoxanide stimulates autophagy and inhibits mTORC1 signaling and intracellular proliferation of Mycobacterium tuberculosis. PLoS Pathog. 2012;8 doi: 10.1371/journal.ppat.1002691. [DOI] [PMC free article] [PubMed] [Google Scholar]
- 40.Vander Heiden M.G., Cantley L.C., Thompson C.B. Understanding the Warburg effect: the metabolic requirements of cell proliferation. Science. 2009;324:1029–1033. doi: 10.1126/science.1160809. [DOI] [PMC free article] [PubMed] [Google Scholar]
- 41.Hayes J.D., Flanagan J.U., Jowsey I.R. Glutathione transferases. Annu. Rev. Pharmacol. Toxicol. 2005;45:51–88. doi: 10.1146/annurev.pharmtox.45.120403.095857. [DOI] [PubMed] [Google Scholar]
- 42.Oakley A. Glutathione transferases: a structural perspective. Drug Metab. Rev. 2011;43:138–151. doi: 10.3109/03602532.2011.558093. [DOI] [PubMed] [Google Scholar]
- 43.Fujitani N., Yoneda A., Takahashi M., Takasawa A., Aoyama T., Miyazaki T. Silencing of glutathione S-transferase pi inhibits cancer cell growth via oxidative stress induced by mitochondria dysfunction. Sci. Rep. 2019;9:14764. doi: 10.1038/s41598-019-51462-9. [DOI] [PMC free article] [PubMed] [Google Scholar] [Retracted]
- 44.Adler V., Yin Z., Fuchs S.Y., Benezra M., Rosario L., Tew K.D., Pincus M.R., Sardana M., Henderson C.J., Wolf C.R., Davis R.J., Ronai Z. Regulation of JNK signaling by GSTp. EMBO J. 1999;18:1321–1334. doi: 10.1093/emboj/18.5.1321. [DOI] [PMC free article] [PubMed] [Google Scholar]
- 45.Gate L., Tew K.D. Glutathione S-transferases as emerging therapeutic targets. Expert Opin. Ther. Targets. 2001;5:477–489. doi: 10.1517/14728222.5.4.477. [DOI] [PubMed] [Google Scholar]
- 46.Mahadevan D., Sutton G.R. Ezatiostat hydrochloride for the treatment of myelodysplastic syndromes. Expet Opin. Invest. Drugs. 2015;24:725–733. doi: 10.1517/13543784.2015.1021003. [DOI] [PubMed] [Google Scholar]
- 47.Rossini A., Rapozo D., Soares Lima S., Guimaraes D., Ferreira M., Teixeira R., Kruel C., Barros S., Andreollo N., Acatauassú R. Polymorphisms of GSTP1 and GSTT1, but not of CYP2A6, CYP2E1 or GSTM1, modify the risk for esophageal cancer in a western population. Carcinogenesis. 2007;28:2537–2542. doi: 10.1093/carcin/bgm222. [DOI] [PubMed] [Google Scholar]
- 48.Lu S., Wang Z., Cui D., Liu H., Hao X. Glutathione S-transferase P1 Ile105Val polymorphism and breast cancer risk: a meta-analysis involving 34,658 subjects. Breast Canc. Res. Treat. 2011;125:253–259. doi: 10.1007/s10549-010-0969-x. [DOI] [PubMed] [Google Scholar]
- 49.Sergentanis T.N., Economopoulos K.P. GSTT1 and GSTP1 polymorphisms and breast cancer risk: a meta-analysis. Breast Canc. Res. Treat. 2010;121:195–202. doi: 10.1007/s10549-009-0520-0. [DOI] [PubMed] [Google Scholar]
- 50.Yang F.Y., Guan Q.K., Cui Y.H., Zhao Z.Q., Rao W., Xi Z. NAD(P)H quinone oxidoreductase 1 (NQO1) genetic C609T polymorphism is associated with the risk of digestive tract cancer: a meta-analysis based on 21 case-control studies. Eur. J. Canc. Prev. 2012;21:432–441. doi: 10.1097/CEJ.0b013e32834f7514. [DOI] [PubMed] [Google Scholar]
- 51.Yanling H., Yuhong Z., Wenwu H., Lei X., Mingwu C. NQO1 C609T polymorphism and esophageal cancer risk: a HuGE review and meta-analysis. BMC Med. Genet. 2013;14:31. doi: 10.1186/1471-2350-14-31. [DOI] [PMC free article] [PubMed] [Google Scholar]
- 52.Gong M., Yi Q., Wang W. Association between NQO1 C609T polymorphism and bladder cancer susceptibility: a systemic review and meta-analysis. Tumour Biol. 2013;34:2551–2556. doi: 10.1007/s13277-013-0799-7. [DOI] [PubMed] [Google Scholar]
- 53.Beaver S.K., Mesa-Torres N., Pey A.L., Timson D.J. NQO1: A target for the treatment of cancer and neurological diseases, and a model to understand loss of function disease mechanisms. Biochim. Biophys. Acta Protein Proteonomics. 2019;1867:663–676. doi: 10.1016/j.bbapap.2019.05.002. [DOI] [PubMed] [Google Scholar]
- 54.Piwien-Pilipuk G., MacDougald O., Schwartz J. Dual regulation of phosphorylation and dephosphorylation of C/EBPbeta modulate its transcriptional activation and DNA binding in response to growth hormone. J. Biol. Chem. 2002;277:44557–44565. doi: 10.1074/jbc.M206886200. [DOI] [PubMed] [Google Scholar]
- 55.Sporn M.B., Liby K.T. NRF2 and cancer: the good, the bad and the importance of context. Nat. Rev. Canc. 2012;12:564–571. doi: 10.1038/nrc3278. [DOI] [PMC free article] [PubMed] [Google Scholar]
- 56.Taguchi K., Motohashi H., Yamamoto M. Molecular mechanisms of the Keap1-Nrf2 pathway in stress response and cancer evolution. Gene Cell. 2011;16:123–140. doi: 10.1111/j.1365-2443.2010.01473.x. [DOI] [PubMed] [Google Scholar]
- 57.Dearth L.R., Hutt J., Sattler A., Gigliotti A., DeWille J. Expression and function of CCAAT/enhancer binding proteinbeta (C/EBPbeta) LAP and LIP isoforms in mouse mammary gland, tumors and cultured mammary epithelial cells. J. Cell. Biochem. 2001;82:357–370. doi: 10.1002/jcb.1167. [DOI] [PubMed] [Google Scholar]
- 58.Nogueira V., Park Y., Chen C.-C., Xu P.-Z., Chen M.-L., Tonic I., Unterman T., Hay N. Akt determines replicative senescence and oxidative or oncogenic premature senescence and sensitizes cells to oxidative apoptosis. Canc. Cell. 2008;14:458–470. doi: 10.1016/j.ccr.2008.11.003. [DOI] [PMC free article] [PubMed] [Google Scholar]
- 59.Mellinghoff I.K., Wang M.Y., Vivanco I., Haas-Kogan D.A., Zhu S., Dia E.Q., Lu K.V., Yoshimoto K., Huang J.H., Chute D.J., Riggs B.L., Horvath S., Liau L.M., Cavenee W.K., Rao P.N., Beroukhim R., Peck T.C., Lee J.C., Sellers W.R., Stokoe D., Prados M., Cloughesy T.F., Sawyers C.L., Mischel P.S. Molecular determinants of the response of glioblastomas to EGFR kinase inhibitors. N. Engl. J. Med. 2005;353:2012–2024. doi: 10.1056/NEJMoa051918. [DOI] [PubMed] [Google Scholar]
Associated Data
This section collects any data citations, data availability statements, or supplementary materials included in this article.
Supplementary Materials
Immunofluorescent co-staining of ROS and NQO1 fluorescent signals in different U87MG cell lines. (A) Co-staining of ROS (Green) with (A) NQO1 (Red) in 6 cell lines. Bar: 20 μm.
Knocking down the ROS in U87MG/EGFRvIII cells diminishes C/EBPβ, NQO1, and GSTP1 expression. (A) The ROS level and (B) cell proliferation over 5 days U87MG/EGFRvIII-expressing cells. (C) Western blot analysis of U87 MG/EGFRvIII cells after ROS inhibitors treatment. Data are means ± SEM (*p < 0.05; **p < 0.01; ***p < 0.001, one way ANOVA, n = 3).
The knocking down of C/EBPβ in LN229/EGFR cells increases ROS and diminishes NQO1 and GSTP1 expression. (A) The knockdown of C/EBPβ reduces NQO1 and GSTP1 expression in LN229 and LN229/EGFR cells. The cells were analyzed by immunoblotting. (B) Cell proliferation over 5 days in LN229 and LN229/EGFR cells after knocking down C/EBPβ. (C) The ROS levels and (D) LDH levels in LN229 and LN229/EGFR cells after knocking down C/EBPβ. Data are means ± SEM (*p < 0.05; **p < 0.01; ***p < 0.001, one way ANOVA, n = 3).
Overexpression of C/EBPβ in LN229/EGFR cells reduces ROS and escalates NQO1 and GSTP1 levels. (A) Overexpression of C/EBPβ increases NQO1 and GSTP1 expression in the LN229/EGFR cells. The cells were analyzed by immunoblotting. (B) Cell proliferation over 5 days in LN229 and LN229/EGFR cells after overexpressing C/EBPβ. (C) The ROS levels and (D) LDH levels in LN229 and LN229/EGFR cells after overexpressing C/EBPβ. Data are means ± SEM (*p < 0.05; **p < 0.01; ***p < 0.001, one way ANOVA, n = 3).
NQO1 and GSTP1 are required for mediating C/EBPβ’s biological effects. (A) Cell proliferation over 5 days in U87MG/EGFRvIII-expressing cells after overexpressing C/EBPβ, followed by dual inhibitor MNPC treatment. (B)Western blot analysis of U87MG/ EGFRvIII cells after overexpressing C/EBPβ and dual inhibitor MNPC treatment. (C) The ROS levels and (D) LDH levels after overexpressing C/EBPβ and dual inhibitor MNPC treatment. Data are means ± SEM (*p < 0.05; **p < 0.01; ***p < 0.001, one way ANOVA, n = 3).
The effect of C/EBPβ in the stable cell lines. (A) The images of stable cell lines were captured under a fluorescence microscope. Bar: 100 μm; (B) Protein levels of C/EBPβ, GSTP1, and NQO1 in different stable cell lines.