

Abstract
Objectives. To assess if historical redlining, the US government’s 1930s racially discriminatory grading of neighborhoods’ mortgage credit-worthiness, implemented via the federally sponsored Home Owners’ Loan Corporation (HOLC) color-coded maps, is associated with contemporary risk of preterm birth (< 37 weeks gestation).
Methods. We analyzed 2013–2017 birth certificate data for all singleton births in New York City (n = 528 096) linked by maternal residence at time of birth to (1) HOLC grade and (2) current census tract social characteristics.
Results. The proportion of preterm births ranged from 5.0% in grade A (“best”—green) to 7.3% in grade D (“hazardous”—red). The odds ratio for HOLC grade D versus A equaled 1.6 and remained significant (1.2; P < .05) in multilevel models adjusted for maternal sociodemographic characteristics and current census tract poverty, but was 1.07 (95% confidence interval = 0.92, 1.20) after adjustment for current census tract racialized economic segregation.
Conclusions. Historical redlining may be a structural determinant of present-day risk of preterm birth.
Public Health Implications. Policies for fair housing, economic development, and health equity should consider historical redlining’s impacts on present-day residential segregation and health outcomes.
Research on health inequities (i.e., social group differences in health that are unfair, unnecessary, and preventable1) has begun to highlight structural racism,1–4 defined as
the totality of ways in which societies foster racial discrimination, through mutually reinforcing inequitable systems (in housing, education, employment, earnings, benefits, credit, media, health care, criminal justice, and so on) that in turn reinforce discriminatory beliefs, values, and distribution of resources, which together affect the risk of adverse health outcomes.3(p1454)
One example is the US federally sponsored policy of “redlining,” introduced in the 1930s by the Home Owners’ Loan Corporation (HOLC) color-coded maps5–7 (Table A, available as a supplement to the online version of this article at http://www.ajph.org). Recently digitized,7 these maps graded areas: A (“best”—green), B (“still desirable”—blue), C (“definitely declining”—yellow), and D (“hazardous”—red; hence: “redlining”).5–7
The HOLC maps jointly encouraged lending in predominantly White and more affluent areas (A or B) and discouraged lending in areas with residents of color (C or D), especially persons then termed “Negroes.”5–7 In the case of New York City (NYC), HOLC notes for areas rated D included such statements as: “There is a steady infiltration of negro, Spanish and Puerto Rican into the area. Population is very unstable and relief load is heavy” (Bronx, D4) and “Colored infiltration a definitely adverse influence on neighborhood desirability although Negroes will buy properties at fair prices and usually rent rooms” (Brooklyn, D8); for additional examples of the racial language used in HOLC area notes, see Table B (available as a supplement to the online version of this article at http://www.ajph.org). HOLC grades thus codified legal discriminatory policies, outlawed only in the 1960s,2,5 and are distinct from sociodemographic measures of such policies’ consequences (e.g., areas’ racial/ethnic composition and income distribution). Hypothesized pathways linking historical redlining to neighborhood trajectories and current health inequities, informed by past and present research on racial segregation and health,2–4,8,9 are provided in Figure 1.
FIGURE 1—
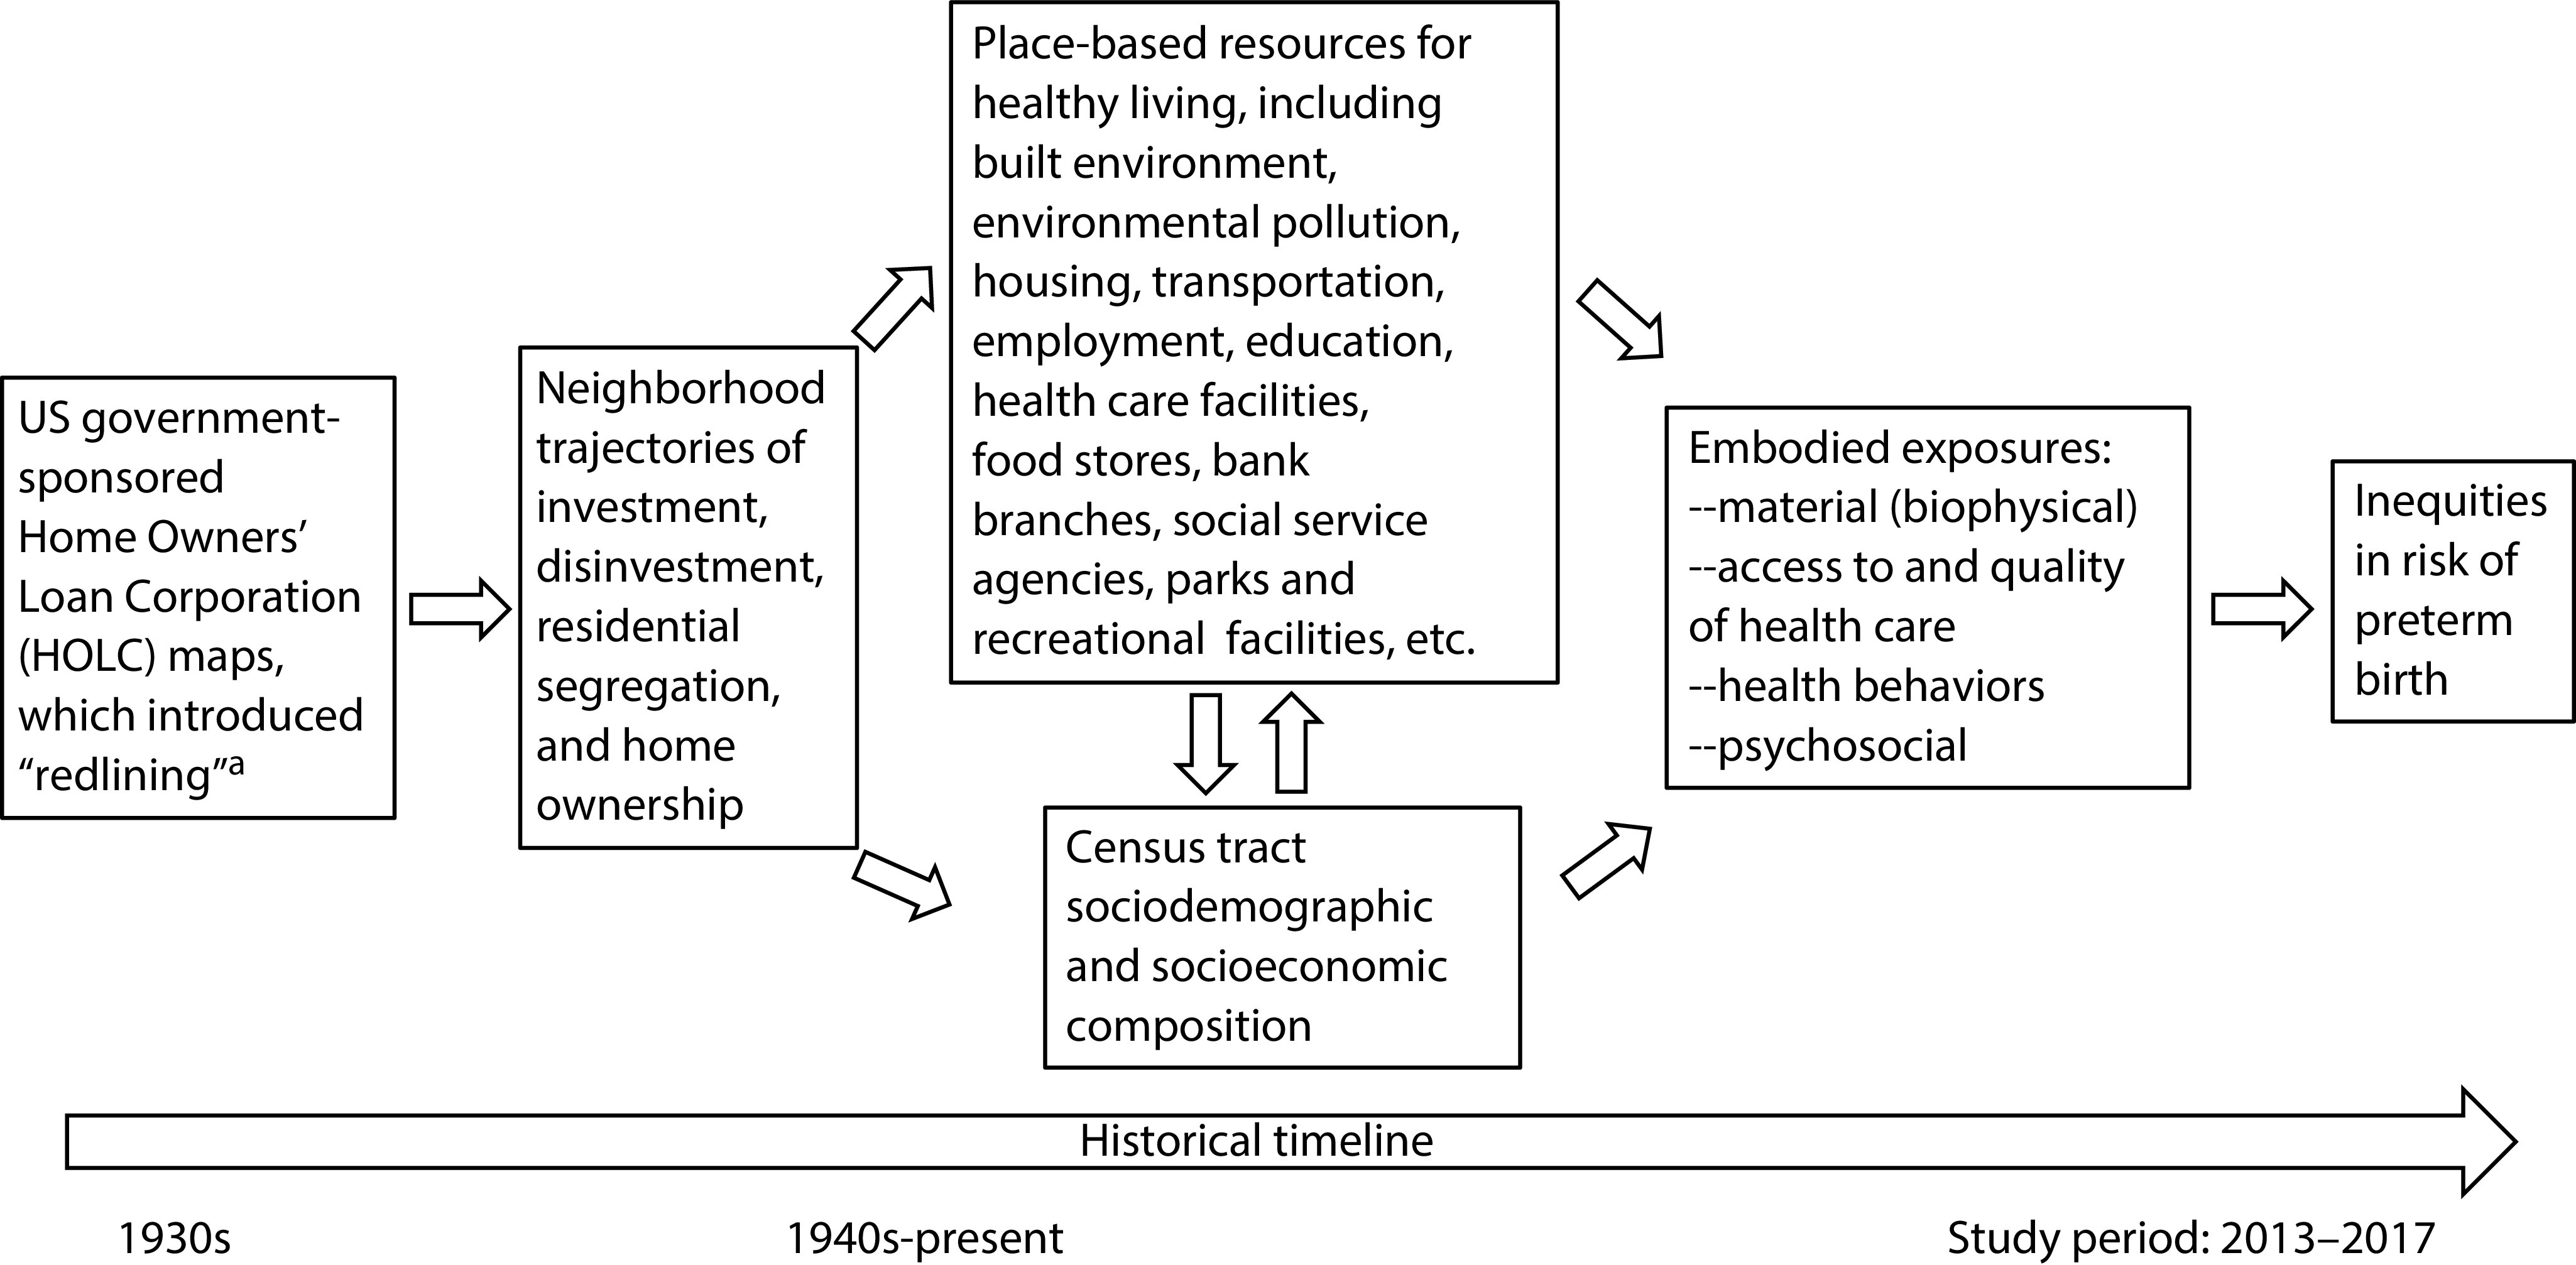
Conceptual Model: Hypothesized Pathways Among Historical Redlining, Neighborhood Trajectories, and Preterm Birth Inequities
aRedlining is a racially discriminatory practice in which Home Owners’ Loan Corporation maps rated areas in relation to how credit-worthy they were deemed for mortgages. The grades ranged from A (“best”—green) to B (“still desirable”—blue) to C (“definitely declining”—yellow) to D (“hazardous”—red, giving rise to the term “redlining”). A and B areas were predominantly White and affluent; C and D areas had residents of color, especially African Americans.
Whether historical redlining continues to be associated with present-day health inequities is largely unexplored.10–13 In the present study, we investigated associations between HOLC grades and risk of preterm birth in NYC, with preterm birth selected because of its public health significance: it exhibits marked and incompletely understood racial/ethnic inequities, is a primary determinant of infant death, and is an important pathway for intergenerational harm, whereby exposures adversely affecting pregnant women can compromise their children’s health, from infancy to adulthood.14,15
METHODS
We analyzed NYC DOHMH vital statistics birth certificate data for all NYC resident singleton births that occurred from January 1, 2013, through December 31, 2017 (n = 528 096), comprising the most recent data available. We defined preterm birth as a birth that occurred before 37 weeks of gestation,14,15 using data based on obstetrical estimates as recorded in the birth certificate.
We employed geocodes derived from NYC DOHMH’s geocoding of birth certificate residential addresses to the census tract level, using the 2010 normalized boundaries and Geosupport Desktop Editor version 19A (NYC Department of City Planning, New York, NY); only 0.001% of birth certificates could not be geocoded.
The 1938 HOLC grade (A to D), assigned only in this 1 year, was the study exposure; see original HOLC maps7 in Figure A (available as a supplement to the online version of this article at http://www.ajph.org). Among NYC’s current census tracts (n = 2166; average population = 3774.2 [SD = 2176]; median = 3426.5; range = 0–26588), 1015 (47%) were fully contained with 1 of the 1938 HOLC areas and we assigned them that parcel’s grade (see Table A for details of the methods employed). Among the remaining 1151 (53%) “mixed” census tracts whose boundaries either crossed the HOLC area boundaries or included areas without a HOLC grade, we assigned them the HOLC grade for which at least 50% of their land was in that grade, and categorized as “other” those census tracts with 50% or more of their land not in any given HOLC category or with no land assigned a HOLC grade. Among the “mixed” census tracts categorized as grade A through D, the mean value of the land area in the same grade as the assigned grade equaled 72% (range = 68.7% for HOLC grade A to 74.2% for HOLC grade C).
Covariates
Covariates pertained to maternal and census tract characteristics. We obtained self-report data from the birth certificates for maternal race/ethnicity, age at giving birth, nativity, and educational level, all of which are strongly associated with risk of preterm birth14,15; the categories used are provided in Table 1. We used the most currently available 5-year census tract data (2013–2017) from the American Community Survey.16 We used the index of concentration at the extremes, which quantifies differences in the proportions of persons in an area living at either end of designated extremes of distributions and ranges from −1 (all deprived) to 1 (all privileged),17–20 to assess the extent to which census tracts contained high concentrations of (1) high-income White households versus low-income Black households (thus measuring racialized economic segregation involving the 2 US racial/ethnic groups with the most extreme patterns of racial segregation5,6,18) and (2) homeowners versus renters. The formula and census variables used to compute these measures are provided in Table C (available as a supplement to the online version of this article at http://www.ajph.org); values in the lowest tercile can extend down to −1 and those in the highest tercile can extend up to 1. Previous research has shown this metric for racialized economic segregation was associated with preterm birth and infant mortality in NYC, with steeper gradients than observed for poverty or racial segregation only,18,19 and similar associations have been reported with this measure for these outcomes in other cities.20
TABLE 1—
Population, Singleton Preterm Birth, and Census Tract Characteristics, by 1938 Home Owners’ Loan Corporation (HOLC) Grade: New York City, 2013–2017
| By HOLC Grade |
||||||
| Variable | Total, No. (%) | A (Green)— “Best,” No. (%) | B (Blue)—“Still Desirable,” No. (%) | C (Yellow)—“Definitely Declining,” No. (%) | D (Red)— “Hazardous,” No. (%) | Not Classified (Gray), No. (%) |
| Individual level | ||||||
| Total singleton births (row %) | 528 096 (100) | 5 466 (1.0) | 73 950 (14.0) | 202 219 (38.3) | 153 460 (29.1) | 93 001 (17.6) |
| Preterm births (% of total singleton births) | 36 902 (7.0) | 274 (5.0) | 4 957 (6.7) | 14 098 (7.0) | 11 263 (7.3) | 6 310 (6.8) |
| Race/ethnicity (column %) | ||||||
| Non-Hispanic White | 165 103 (31.3) | 3 892 (71.2) | 27 064 (36.6) | 50 912 (25.2) | 45 582 (29.7) | 37 653 (40.5) |
| Non-Hispanic Black | 104 134 (19.7) | 98 (1.8) | 13 136 (17.8) | 35 133 (17.4) | 39 103 (25.5) | 16 664 (17.9) |
| Non-Hispanic Asian and Pacific Islander | 90 929 (17.2) | 720 (13.2) | 10 052 (13.6) | 46 640 (23.1) | 16 829 (11.0) | 16 688 (17.9) |
| Non-Hispanic other | 1 952 (0.4) | 14 (0.3) | 192 (0.3) | 886 (0.4) | 539 (0.4) | 321 (0.4) |
| Hispanic | 160 885 (30.5) | 670 (12.3) | 22 774 (30.8) | 67 044 (33.2) | 49 782 (32.4) | 20 615 (22.2) |
| Not provided or missing | 5 093 (1.0) | 72 (1.3) | 732 (1.0) | 1 604 (0.8) | 1 625 (1.1) | 1 060 (1.1) |
| Mother’s education (column %) | ||||||
| < high school | 103 443 (19.6) | 106 (1.9) | 11 614 (15.7) | 45 366 (22.4) | 34 853 (22.7) | 11 504 (12.4) |
| High school or GED | 121 354 (23.0) | 200 (3.7) | 14 091 (19.0) | 53 931 (26.7) | 37 209 (24.2) | 15 923 (17.1) |
| ≥ some college | 301 774 (57.1) | 5 147 (94.2) | 48 069 (65.0) | 102 436 (50.7) | 80 785 (52.6) | 65 337 (70.2) |
| Not provided (missing) | 1 525 (0.3) | 13 (0.2) | 176 (0.2) | 486 (0.2) | 613 (0.4) | 237 (0.2) |
| Census tract level | ||||||
| Census tracts: no. (row %)a | 2 166 (100) | 32 (1.5) | 304 (14.0) | 824 (38.0) | 541 (25.0) | 465 (21.5) |
| Poverty level, % below US poverty line (column %) | ||||||
| Very low (< 10%) | 664 (30.7) | 30 (93.8) | 101 (33.2) | 223 (27.1) | 86 (15.9) | 224 (48.2) |
| Medium (10% to < 20%) | 706 (32.6) | 1 (3.1) | 114 (37.5) | 312 (37.9) | 150 (27.7) | 129 (27.7) |
| High (20% to < 30%) | 412 (19.0) | 1 (3.1) | 52 (17.1) | 167 (20.3) | 142 (26.2) | 50 (10.8) |
| Very high (≥ 30%) | 384 (17.7) | 0 (0.0) | 37 (12.2) | 122 (14.8) | 163 (30.1) | 62 (13.3) |
| Cumulative poverty level for high poverty, > 20% below US poverty lineb (column %) | ||||||
| 0 time periods | 899 (41.5) | 29 (90.6) | 149 (49.0) | 378 (45.9) | 104 (19.2) | 239 (51.4) |
| 1–2 time periods | 449 (20.7) | 2 (6.2) | 71 (23.4) | 210 (25.5) | 95 (17.6) | 71 (15.3) |
| 3–5 time periods | 761 (35.1) | 1 (3.1) | 84 (27.6) | 234 (28.4) | 339 (62.7) | 103 (22.2) |
| Unranked | 57 (2.6) | 0 (0.0) | 0 (0.0) | 2 (0.2) | 3 (0.6) | 52 (11.2) |
| ICE for racialized economic segregationc (column %) | ||||||
| Tercile 1 (best off) | 706 (33.3) | 32 (100.0) | 133 (43.8) | 193 (23.5) | 146 (27.0) | 202 (48.0) |
| Tercile 2 | 707 (33.4) | 0 (0.0) | 89 (29.3) | 370 (45.0) | 132 (24.4) | 116 (27.6) |
| Tercile (worst off) | 706 (33.3) | 0 (0.0) | 82 (27.0) | 259 (31.5) | 262 (48.5) | 103 (24.5) |
| ICE for housing tenured (column %) | ||||||
| Tercile 1 (best off) | 706 (33.3) | 25 (78.1) | 98 (32.2) | 319 (38.8) | 78 (14.4) | 186 (44.2) |
| Tercile 2 | 707 (33.4) | 5 (15.6) | 119 (39.1) | 284 (34.6) | 192 (35.6) | 107 (25.4) |
| Tercile (worst off) | 706 (33.3) | 2 (6.2) | 87 (28.6) | 219 (26.6) | 270 (50.0) | 128 (30.4) |
Note. GED = general educational development; ICE = index of concentration at the extremes. We used 2010 normalized census tract boundaries. See Table A and Table C (available as supplements to the online version of this article at http://www.ajph.org) for technical details on the HOLC grade and census tract variables.
1 tract was missing from the analysis.
Time periods: 1980, 1990, 2000 decennial census, and 2008–2012 and 2013–2017 American Community Survey.
High-income White households vs low-income Black households. Missing from analysis = 48 census tracts.
Homeowners vs renters. Missing from analysis = 48 census tracts.
We also computed 2 census tract measures for the percentage of persons below the US poverty line: (1) current (2013–2017) and (2) cumulative (extending back to 1980; see Table B for the census variables employed).16,21,22 For cumulative poverty, the 3-level categorical variable indicated if the census tract had high poverty (defined by the US Census Bureau as greater than or equal to 20% of persons below poverty23) in 0, 1 or 2, or 3 or more of 5 specified time periods: 1980, 1990, 2000, 2008 to 2012, and 2013 to 2017.
Statistical Analyses
We used SAS version 9.4 (SAS Institute, Cary, NC) to perform statistical analyses. Following a prespecified analytic plan, we first quantified the distribution, including missingness, of the individual-level birth certificate and census tract–level variables, and compared these distributions across HOLC grades (χ2 test; 2-sided P < .05). We also used the Cochrane–Armitage test for trend (asymptotic; 1-side Pr < Z) for percentage of preterm births across HOLC grades A through D. Because missingness was uniformly low (typically 0% to at most 0.25% for the maternal data, and up to at most 2.2% for the census tract data), we analyzed the observed data with no imputation.
To analyze the association between preterm birth and HOLC grade, we set grade A as the referent group, both because it was the most privileged grade and the maternal and census tract characteristics for this grade significantly differed from all other grades (P < .05). We conducted multilevel generalized estimating equation logistic regression analyses, with individuals nested within census tracts. These models employ a semiparametric approach to estimating the population-averaged model parameters and their 95% confidence intervals (CIs) for clustered data (e.g., individuals nested in census tracts) and can be employed when the dependent variable is binary (e.g., preterm birth: yes vs no). For these models, neither the dependent nor independent variables need to be normally distributed, even as they do require a linear relationship between the predictors and the transformed dependent variables, based on the specified link function. We did not include the different census tract measures in the same model because of collinearity (as assessed with the Pearson correlation coefficient; P < .05; 2-sided test; Table D, available as a supplement to the online version of this article at http://www.ajph.org), and the diagnostics for multicollinearity for the models run indicated no grounds for concern.
Bivariable analyses first separately assessed the association between preterm birth and (1) HOLC grade, using grade A as referent, and (2) each census tract and maternal characteristic. Next, multivariable models assessed the association between HOLC grade and preterm birth while controlling for the maternal individual-level covariates and, separately and additionally, each census tract measure. We assessed goodness of fit by using the quasi-likelihood under independence model criterion statistic, for which lower values indicate a better fit. We controlled for, rather than stratified by, race/ethnicity because the small number of births in grade A for all racial/ethnic groups other than non-Hispanic White resulted in unstable HOLC parameter estimates for these diverse groups. We additionally conducted sensitivity analyses to assess if clustering attributable to repeat singleton births among mothers during the study interval (16% of the total 528 096 singleton births) affected the results. We restricted these analyses to (1) women who had only 1 singleton birth during the study time period (n = 226 590 births) and (2) the last singleton birth of women during the study time period (n = 452 029 births). Because results were consistent with our findings for total singleton births (data available upon request), we report results only for the latter, given the larger sample size and greater representativeness of the findings.
RESULTS
Overall, 7.0% of the 528 096 singleton NYC resident births for 2013 to 2017 were preterm (Table 1). Among the mothers, 91.1% were aged 20 to 39 years when they gave birth, 47.0% were US-born, and 42.6% had at most a high-school education. Their self-identified racial/ethnic distribution was 31.3% non-Hispanic White, 19.7% non-Hispanic Black, 17.2% non-Hispanic Asian and Pacific Islander, 30.5% Hispanic, 0.4% in another racial/ethnic group, and 1.0% with no racial/ethnic group reported (Table 1).
Two thirds of NYC’s 2166 census tracts were HOLC grades C (“definitely declining”—yellow: 38%) and D (“hazardous”—red: 25%), while 14% were grade B (“still desirable”—blue), only 1.5% were grade A (“best”—green), and 21% had 0% to less than 50% of their land area in any given HOLC grade (Table 1; Figure 2). Worse HOLC grades typically had higher prevalence of adverse maternal and census tract characteristics (Table 1). For example, the proportion of mothers with less than a high-school education was 2% in HOLC grade A versus 23% in HOLC grade D (P < .001); the proportion of census tracts in the worst tercile for racialized economic segregation (high concentration of non-Hispanic Black low-income households) was 0% in HOLC grade A versus 49% in HOLC grade D (P < .001). A statistically significant trend occurred in the percentage of preterm birth across HOLC grades, rising from 5.0% in grade A to 7.3% in grade D (1-sided asymptotic Cochran–Armitage trend test: P < .001).
FIGURE 2—
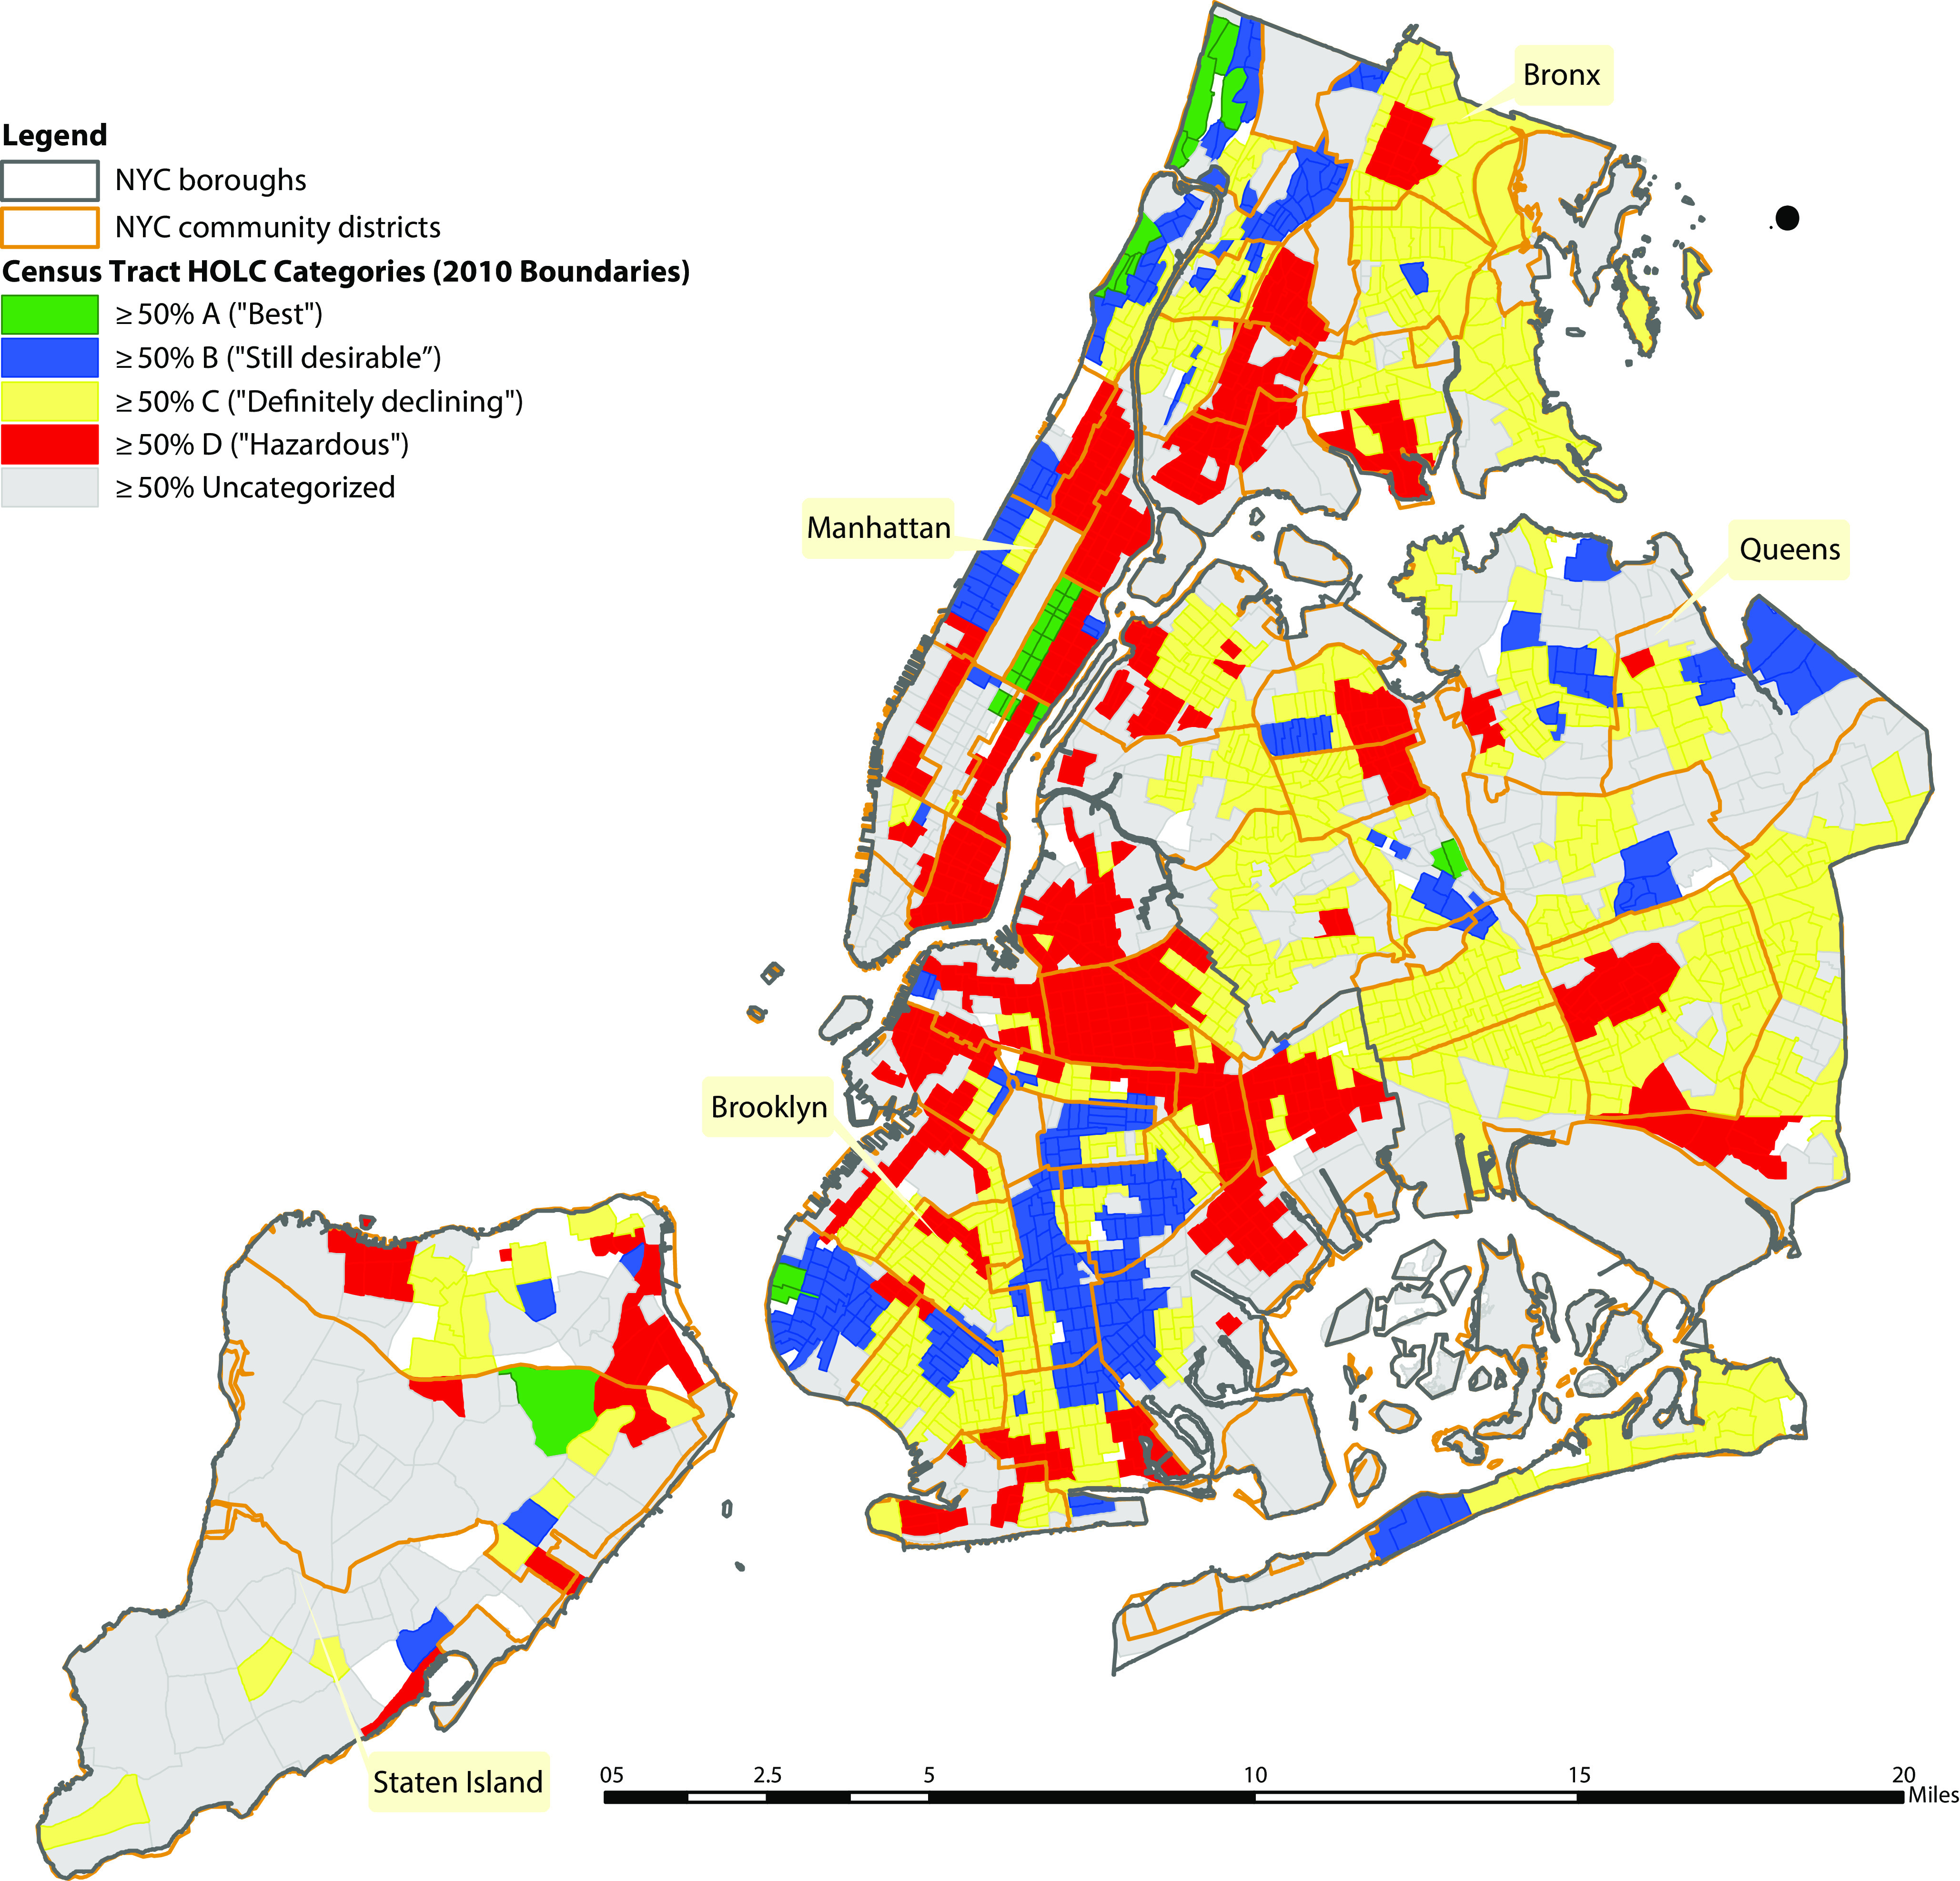
Census Tracts (n = 2166) by 1938 Home Owners’ Loan Corporation (HOLC) Grade: New York City
Note. NYC = New York City.
In bivariable analyses, preterm birth was significantly associated (P < .05) with HOLC grade and both maternal and census tract characteristics (Table 2, model 1). The unadjusted odds ratio (OR) for HOLC grade D versus A was 1.55 (95% CI = 1.39, 1.72); the mean risk difference was 2.6 percentage points (95% CI = 2.0, 3.1). Grades B and C were also associated with elevated risk of preterm birth, compared with grade A (P < .05), and the OR point estimates displayed a gradient (D = 1.6; C = 1.5; B = 1.4).
TABLE 2—
Bivariable and Multivariable Associations of Singleton Preterm Birth With the 1938 Home Owners’ Loan Corporation (HOLC) Grade, Individual-Level Maternal Characteristics, and Current Census Tract Poverty and Racialized Economic Segregation: New York City, 2013–2017
| Multivariable: HOLC Grade With Maternal Characteristics and Specified Census Tract Measures |
||||
| Census Tract–Level Variable | Bivariable Model 1, OR (95% CI) |
Model 2a,OR (95% CI) | Model 3ab,OR (95% CI) | Model 3bc, OR (95% CI) |
| HOLC grade | ||||
| A (green)—“best” (Ref) | 1 | 1 | 1 | 1 |
| B (blue)—“still desirable” | 1.37 (1.22, 1.53) | 1.17 (1.04, 1.31) | 1.14 (1.01, 1.28) | 1.09 (0.97, 1.22) |
| C (yellow)— “definitely declining” | 1.45 (1.31, 1.61) | 1.19 (1.07, 1.34) | 1.16 (1.03, 1.30) | 1.10 (0.98, 1.23) |
| D (red)—“hazardous” | 1.55 (1.39, 1.72) | 1.18 (1.05, 1.32) | 1.14 (1.02, 1.28) | 1.07 (0.96, 1.20) |
| Other or unclassified | 1.37 (1.23, 1.53) | 1.18 (1.05, 1.33) | 1.16 (1.03, 1.30) | 1.11 (0.99, 1.25) |
| Poverty level (% below US poverty line) | ||||
| Very low (< 10%; Ref) | 1 | . . . | 1 | . . . |
| Medium (10% to < 20%) | 1.11 (1.06, 1.17) | . . . | 1.05 (1.01, 1.09) | . . . |
| High (20% to < 30%) | 1.17 (1.12, 1.23) | . . . | 1.04 (1.00, 1.08) | . . . |
| Very high (≥ 30%) | 1.30 (1.24, 1.37) | . . . | 1.07 (1.02, 1.11) | . . . |
| ICE for racialized economic segregation: high-income White households vs low-income Black households | ||||
| Tercile 1 (best off; Ref) | 1 | . . . | . . . | 1 |
| Tercile 2 | 1.25 (1.20, 1.30) | . . . | . . . | 1.10 (1.06, 1.15) |
| Tercile 3 (worst off) | 1.74 (1.68, 1.80) | . . . | . . . | 1.25 (1.20, 1.30) |
Note. CI = confidence interval; ICE = index of concentration at the extremes; OR = odds ratio. Maternal characteristics (individual-level) adjusted for in the multivariable models: race/ethnicity, age, nativity, and educational level (note: all parameter estimates are provided in Table E, available as a supplement to the online version of this article at http://www.ajph.org). See Table A and Table C (available as supplements to the online version of this article at http://www.ajph.org) for technical details on the HOLC grade and census tract variables, and see Table E for models that separately adjust for cumulative census tract poverty and the census tract ICE for housing tenure, in addition to maternal characteristics.
Maternal only.
Maternal plus current poverty.
Maternal plus racialized economic segregation.
In multilevel multivariable analyses (Table 2), the OR for HOLC grade D versus A, and also for grade B versus A and grade C versus A, equaled 1.2 and remained significant (Table 2, model 2; P < .05) after we adjusted for maternal characteristics (age, nativity, education, and race/ethnicity, with parameter estimates for these covariates reported in Table E, available as a supplement to the online version of this article at http://www.ajph.org). The mean risk difference for grade D versus A was 1.4 percentage points (95% CI = −0.5, 3.4). Similar ORs (all P < .05) were observed in models that additionally and separately adjusted for current census tract poverty (Table 2, model 3a) and also cumulative census tract poverty (Table E) and the census tract measure for housing tenure (Table E). However, the OR was attenuated by adjustment for the current census tract racialized economic segregation (Table 2, model 3b), the respective ORs for HOLC grades B, C, and D versus A (OR = 1.1; P > .05), and this model had the lowest (best) goodness-of-fit statistic (Table E).
DISCUSSION
The primary finding of this study was that 80 years after the HOLC grades were delineated by the US government, they remained associated with contemporary risk of preterm birth among singletons. Among infants born in NYC in 2013 to 2017, singleton infants born in areas with a HOLC grade D (“hazardous”—red) versus A (“best”—green) were both relatively and absolutely more likely to be preterm (OR = 1.6; 95% CI = 1.4, 1.7; mean risk difference = 2.6 percentage points; 95% CI = 2.0, 3.1), with grades B and C exhibiting intermediate elevated risks (P < .05), and the test for trend in percentage of preterm births across HOLC grades A to D was statistically significant (1-side P < .001). Moreover, the observed excess risks, comparing HOLC grades B, C, and D to the most privileged grade A, remained elevated (OR = ∼1.2; P < .05) in multilevel multivariable models that additionally controlled for maternal characteristics and, separately, census tract current and cumulative poverty and housing tenure, with this risk attenuated in models that controlled for current census tract racialized economic segregation (OR = 1.1; P > .05).
This study’s observed associations between risk of preterm birth and both 1938 HOLC grade and current census tract characteristics, including poverty and racialized economic segregation, are in accord with 2 relevant strands of research regarding (1) health inequities in relation to HOLC grades10–13 and (2) racial segregation, economic deprivation, and preterm birth.14,15,19,20 Suggestive evidence regarding associations between redlining and increased health risk has been provided by the 4 extant published studies on this topic: (1) a cartographic analysis of risk of tuberculosis in Austin, Texas, in 195110; (2) a study of firearm injury rates in Philadelphia, Pennsylvania, (2013–2014), which found associations with 1937 HOLC grades even after adjusting for 1940 neighborhood sociodemographic factors11; (3) a study in Detroit, Michigan, which found that historic redlining both confounded and modified the associations between self-rated health and current neighborhood characteristics, as measured in 2008 to 201312; and (4) a study in Baltimore, Maryland, which documented that clusters of alcohol retail outlets in 2016 were associated with HOLC grade.13 Research on preterm birth likewise has reported (1) stronger associations with census tract measures of racialized economic segregation compared with poverty and (2) limited attenuation, by maternal and neighborhood characteristics, of racial/ethnic inequities in preterm birth.14,15,19,21
Together, the evidence from these previous studies, in conjunction with the associations detected in the present investigation, suggests that structural racism, past and present, including previous forms of racial discrimination that are now illegal, can affect current adverse health outcomes, net maternal sociodemographic characteristics and diverse current census tract characteristics.2,3,5 Our multilevel findings additionally underscore (1) the persistent privilege of HOLC grade A compared with the other grades, with the lack of a linear trend likely reflecting the variable histories of areas graded C and D in terms of persistent disinvestment versus gentrification,5–7 and (2) the possible mediation of HOLC effects via racialized economic segregation.
Potential pathways involving structural characteristics of areas affected by the HOLC grades are delineated in Figure 1 and include such place-based resources for healthy living as features of the built environment, environmental pollution, quality and availability of housing stock, access to transportation, presence of local employers and access to well-paying jobs, presence of and access to well-resourced schools, and access to and quality of health facilities, food stores, bank branches, social services, and parks and recreational facilities.2–15 New evidence, relevant to health risks, documents associations between historical redlining and the spatial distribution of urban heat islands, as linked to distributions of impervious land cover and tree canopy.24 Future research could thus fruitfully explore the diverse mechanisms, including the potential pathways we delineate, that result in historical redlining continuing to be associated with risk of adverse health outcomes.
Limitations
The first limitation is that this study focused solely on 1 city; however, attesting to its salience, NYC is the largest city in the United States (2018 estimated population: 8.4 million)25; similar studies could be conducted in other cities that experienced historical redlining to see if this study’s findings can be replicated. Second, the birth certificates included only the maternal residential address at birth, with no data on duration of residence at that address. US studies have estimated that anywhere from 12% to 33% of pregnant women have moved residence while pregnant.26,27 Suggesting contextual influences of such residential mobility was unlikely to bias results, US research has shown that people typically move to neighborhoods with similar racial/ethnic and economic composition.28,29
Third, combining census tracts with 100% of their land in a given HOLC grade into the same category as with those with greater than or equal to 50% to less than 100% of their land in this grade would have led to a conservative bias (i.e., diluting the association that would have been observed with solely homogenous census tracts). Fourth, because of the lack of consistent historical census tract data regarding race/ethnicity and income,22,23 the only census tract measure of cumulative adverse social exposure pertained solely to poverty and extended back only to 1980. Fifth, the study lacked data on mothers’ reasons for living where they resided at time of birth.
Sixth, had more extensive data been available on these types of covariates, as well as time-trend data on relevant housing and zoning policies and institutional practices regarding mortgages and loans, gentrification, and displacement,5–7,29 as presented in Figure 1, their role as potential mediators and moderators of the observed associations between HOLC grades and risk of preterm birth could have been assessed via formal mediation analysis.30 Lacking the data to meet the stringent assumptions required for counterfactual mediation analysis (e.g., no unmeasured confounding, including no unmeasured mediator confounding and no mediator-outcome confounding caused by the exposure30) we did not attempt these analyses. Seventh, we note that all census tracts in HOLC grade A were in the first (best) tercile for racialized economic segregation in the multilevel models using this metric, raising the possibility of structural confounding. Caution is thus warranted with regard to overinterpreting the results of the adjusted analyses, given the possibility of unmeasured confounders.
Conclusions
Historical redlining was associated with present-day risk of preterm birth and warrants scrutiny as a social determinant of health. The results of our study, especially if replicated in other areas that were subject to similar structural racism, can inform contemporary civic discourse about historical redlining (e.g., appearing in public exhibits, news articles, videos, and other social media31–33) and also current policy debates and allocation decisions regarding government programs for fair housing, economic development, and health equity.5,7,24,29 Examples of such policies include the Department of Housing and Urban Development’s requirements for cities to further fair housing, disparate impact remedies under the Fair Housing Act, local housing choice vouchers, and states’ allocation of Low-Income Housing Tax Credits.5,6 Raising important issues of government accountability, analysis of historical redlining and health indicates how using the lens of structural racism, informed by history, can spark new and needed research to strengthen work to understand, rectify, and prevent health inequities.
ACKNOWLEDGMENTS
This project was supported solely by the NYC DOHMH; there was no external funding. DOHMH funds covered the effort of the DOHMH employees and the additional non-DOHMH team members (N. K. and P. D. W.).
N. Krieger and P. D. Waterman acknowledge, with permission (e-mail: March 19, 2019), our colleagues Mariana Arcaya, ScD, and Justin Steil, JD, PhD, MSc, both in the Department of Urban Studies and Planning at the Massachusetts Institute of Technology, for insights (noncompensated) about the relevance of analyses of HOLC grades and contemporary health data for current policy debates over housing and economic development. G. Van Wye, M. Huynh, G. Maduro, and W. Li acknowledge, with permission, the analytic contribution of Chinelo Onyebeke, MPH (e-mail: May 13, 2019), for assisting (noncompensated) in data-checking the results and in populating the tables, as well as the many staff of the NYC DOHMH Bureau of Vital Statistics who ensure the timely and accurate completion of birth registrations in New York City.
Note. The sponsor of this investigation, the NYC DOHMH, supported a collaboration between the DOHMH and non-DOHMH team members in which all team members agreed on the scope, conduct, interpretation, and publication of the work. Thus, via this collaboration, the funder had a role in the design and conduct of the study; collection, management, analysis, and interpretation of the data; preparation, review, or approval of the article; and decision to submit the article for publication. G. Van Wye and M. Huynh, both staff at the NYC DOHMH, had full access to all the data in the study and take responsibility for the integrity of the data and the accuracy of the data analyses. Data analysts for the study were P. D. Waterman (for the HOLC and census-derived measures) and W. Li and G. Maduro (for the analyses employing the preterm birth data).
CONFLICTS OF INTEREST
None of the authors have any conflicts of interest to declare.
HUMAN PARTICIPANT PROTECTION
This study was approved as exempt by the institutional review boards of the Harvard T. H. Chan School of Public Health (protocol IRB15-2304) and the NYC DOHMH (protocol 15-104).
Footnotes
See also Kramer, p. 933.
REFERENCES
- 1. Commission of the Pan American Health Organization on Equity and Health Inequalities in the Americas. Just Societies, Health Equity, and Dignified Lives. 2018. Available at: http://iris.paho.org/xmlui/handle/123456789/49505. Accessed March 4, 2020.
- 2.Krieger N. Discrimination and health inequities. In: Berkman LF, Kawachi I, Glymour M, editors. Social Epidemiology. 2nd ed. New York, NY: Oxford University Press; 2014. pp. 63–125. [Google Scholar]
- 3.Bailey ZD, Krieger N, Agénor M, Graves J, Linos N, Bassett MT. Structural racism and health inequities: evidence and interventions. Lancet. 2017;389(10077):1453–1463. doi: 10.1016/S0140-6736(17)30569-X. [DOI] [PubMed] [Google Scholar]
- 4.Ford CL, Griffith DM, Bruce MA, Gilbert KL, editors. Racism: Science and Tools for the Public Health Professional. Washington, DC: American Public Health Association; 2019. [Google Scholar]
- 5.Rothstein R. The Color of Law: A Forgotten History of How Our Government Segregated America. New York, NY: Liveright; 2017. [Google Scholar]
- 6.Metzger MW, Webber HS, editors. Facing Segregation: Housing Policy Solutions for a Stronger Society. New York, NY: Oxford University Press; 2018. [Google Scholar]
- 7.Nelson RK, Winling L, Marciano R . Mapping inequality. In: Nelson RK, Ayers EL, editors. American Panorama. Available at: https://dsl.richmond.edu/panorama/redlining/#loc=4/36.71/-96.93&opacity=0.8. Accessed March 4, 2020. [Google Scholar]
- 8.Du Bois WEB. The Philadelphia Negro: A Social Study. Philadelphia, PA: University of Pennsylvania; 1899. [Google Scholar]
- 9.Yankauer A., Jr. The relationship of fetal and infant mortality to residential segregation: an inquiry into social epidemiology. Am Sociol Rev. 1950;15(5):644–648. doi: 10.2105/AJPH.2014.1052278. [DOI] [PMC free article] [PubMed] [Google Scholar]
- 10.Huggins JC. A cartographic perspective on the correlation between redlining and public health in Austin, Texas—1951. Cityscape (Wash, DC) 2017;19(2):267–280. [Google Scholar]
- 11.Jacoby SF, Dong B, Beard JH, Wiebe DJ, Morrison CN. The enduring impact of historical and structural racism on urban violence in Philadelphia. Soc Sci Med. 2018;199:87–95. doi: 10.1016/j.socscimed.2017.05.038. [DOI] [PMC free article] [PubMed] [Google Scholar]
- 12.McClure E, Feinstein L, Cordoba E et al. The legacy of redlining in the effect of foreclosures on Detroit residents’ self-rated health. Health Place. 2019;55:9–19. doi: 10.1016/j.healthplace.2018.10.004. [DOI] [PMC free article] [PubMed] [Google Scholar]
- 13.Trangenstein PJ, Gray C, Rossheim ME, Sadler R, Jernigan DL. Alcohol outlet clusters and population disparities. J Urban Health. 2020;97(1):123–136. doi: 10.1007/s11524-019-00372-2. [DOI] [PMC free article] [PubMed] [Google Scholar]
- 14.Mehra R, Boyd LM, Ickovics JR. Racial residential segregation and adverse birth outcomes: a systematic review and meta-analysis. Soc Sci Med. 2017;191:237–250. doi: 10.1016/j.socscimed.2017.09.018. [DOI] [PubMed] [Google Scholar]
- 15.Mutambudzi M, Meyer JD, Reisine S, Warren N. A review of recent literature on materialist and psychosocial models for racial and ethnic disparities in birth outcomes in the US, 2000–2014. Ethn Health. 2017;22(3):311–332. doi: 10.1080/13557858.2016.1247150. [DOI] [PubMed] [Google Scholar]
- 16.US Census Bureau. American Community Survey. Available at: https://www.census.gov/programs-surveys/acs. Accessed March 4, 2020.
- 17.Massey DS. The prodigal paradigm returns: ecology comes back to sociology. In: Booth A, Crouter A, editors. Does It Take a Village? Community Effects on Children, Adolescents, and Families. Mahwah, NJ: Lawrence Erlbaum Associates; 2001. pp. 41–48. [Google Scholar]
- 18.Krieger N, Waterman PD, Spasojevic J, Li W, Maduro G, Van Wye G. Public health monitoring of privilege and deprivation using the index of concentration at the extremes (ICE) Am J Public Health. 2016;106(2):256–263. doi: 10.2105/AJPH.2015.302955. [DOI] [PMC free article] [PubMed] [Google Scholar]
- 19.Huynh M, Spasojevic J, Li W et al. Spatial social polarization and birth outcomes: preterm birth and infant mortality—New York City, 2010–14. Scand J Public Health. 2018;46(1):157–166. doi: 10.1177/1403494817701566. [DOI] [PubMed] [Google Scholar]
- 20.Wallace ME, Crear-Perry J, Green C, Felker-Kantor E, Theall K. Privilege and deprivation in Detroit: infant mortality and the index of concentration at the extremes. Int J Epidemiol. 2019;48(1):207–216. doi: 10.1093/ije/dyy149. [DOI] [PubMed] [Google Scholar]
- 21.US Census Bureau. Decennial census of population and housing. Available at: https://www.census.gov/programs-surveys/decennial-census/data.html. Accessed March 4, 2020.
- 22.Krieger N, Chen JT, Waterman PD, Rehkopf DH, Subramanian SV. Painting a truer picture of US socioeconomic and racial/ethnic health inequalities: the Public Health Disparities Geocoding Project. Am J Public Health. 2005;95(2):312–323. doi: 10.2105/AJPH.2003.032482. [DOI] [PMC free article] [PubMed] [Google Scholar]
- 23.US Census Bureau. Statistical brief: poverty areas. Available at: https://www.census.gov/library/publications/1995/demo/sb95-13.html. Accessed March 4, 2020.
- 24.Hoffman JS, Shandas V, Pendleton N. The effects of historical housing policies on resident exposure to intra-urban heat: a study of 108 US urban areas. Climate (Basel) 2020;8(1):12. [Google Scholar]
- 25.New York City, Department of City Planning. Population—New York City population. Available at: https://www1.nyc.gov/site/planning/planning-level/nyc-population/nyc-population.page. Accessed March 4, 2020.
- 26.Canfield MA, Ramadhani TA, Langlois PH, Waller DK. Residential mobility patterns and exposure misclassification in epidemiologic studies of birth defects. J Expo Sci Environ Epidemiol. 2006;16(6):538–543. doi: 10.1038/sj.jes.7500501. [DOI] [PubMed] [Google Scholar]
- 27.Chen L, Bell EM, Caton AR, Druschel CM, Lin S. Residential mobility during pregnancy and the potential for ambient air pollution exposure misclassification. Environ Res. 2010;110(2):162–168. doi: 10.1016/j.envres.2009.11.001. [DOI] [PubMed] [Google Scholar]
- 28.South SJ, Crowder KD. Residential mobility between cities and suburbs: race, suburbanization, and back-to-the-city moves. Demography. 1997;34(4):525–538. [PubMed] [Google Scholar]
- 29.Duncan DT, Kawachi I. Neighborhoods and health: a progress report. In: Duncan DT, Kawachi I, editors. Neighborhoods and Health. 2nd ed. New York, NY: Oxford University Press; 2018. pp. 1–16. [Google Scholar]
- 30.VanderWeele TJ. Mediation analysis: a practitioner’s guide. Annu Rev Public Health. 2016;37(1):17–32. doi: 10.1146/annurev-publhealth-032315-021402. [DOI] [PubMed] [Google Scholar]
- 31.Designing the WE. Undesign the Redline. Available at: https://www.designingthewe.com/undesign-the-redline. Accessed March 4, 2020.
- 32.Badger E. Self-fulfilling prophecies: how redlining’s racist effects linger for decades. New York Times. August 24, 2017. Available at: https://www.nytimes.com/2017/08/24/upshot/how-redlinings-racist-effects-lasted-for-decades.html. Accessed March 4, 2020.
- 33.Lopez M, Rothstein R. YouTooCanWoo. Segregated by Design. 2019. Available at: https://www.segregatedbydesign.com. Accessed March 4, 2020.