Abstract
Recently, we have shown that changes in Fourier transform infrared (FTIR) spectra of living MDA-MB-231 cells (a triple negative cell line) upon exposure to anticancer drugs reflect the changes in the cellular compositions which are correlated to the modes of action of drugs. In the present study, MCF7 cells (an estrogen receptor expressing breast cancer cell line) were exposed to three anticancer drugs belonging to two well-characterized anticancer classes: selective estrogen receptor modulators (SERMs) and DNA-intercalating agent. First, we evaluated if the changes in the spectrum of cells are according to the modes of action of drugs and the characteristics of the MCF7 cell line in the same way as the MDA-MB-231 cell. Living MCF7 cells were treated in the three drugs at half maximal inhibitory concentration (IC50), and the difference spectra were analyzed using principal component analysis (PCA). The results demonstrated clear separation between tamoxifen/toremifene (SERM)-treated cells from the doxorubicin (DNA-intercalator)-treated and untreated cells (control). Tamoxifen and toremifene induced similar spectral changes in the cellular compositions of MCF7 cells and lead to the clustering of these two drugs in the same quadrant of the principal component 1 (PC1) versus PC2 score plots. The separation is mostly attributed to their similar modes of actions. However, doxorubicin-treated MCF7 cells highlighted spectral changes that mainly occur in bands at 1085 and 1200–1240 cm–1, which could be associated with the DNA-intercalation effects of the drug. Second, the pairwise PCA at various individual time points was employed to investigate whether the spectral changes of MCF7 and MDA-MB-231 cells in response to the IC50 of tamoxifen/toremifene and doxorubicin are dependent on the characteristics of the cell lines. The estrogen-expressing MCF7 cells demonstrated significant differences in response to the SERMs in comparison to the triple negative MDA-MB-231 cells, suggesting that different modes of action have taken place in the two tested cell lines. In contrast, the doxorubicin-treated MDA-MB-231 and MCF7 cells show similar changes in 1150–950 cm–1, which indicates that the DNA intercalation effect of doxorubicin is found in both cell lines. The results have demonstrated that live-cell FTIR analysis is sensitive to the different modes of action from the same drugs on cells with different characteristics.
Introduction
The development of anticancer drugs is a complex, time-consuming, and costly process. It takes more than ten years of development and cost approximately $1 billion on average.1,2 Despite the excessive efforts intended for inventing new anticancer drugs, the number of new drugs has not yet met the increasing demand. The attrition rate is considerably high, and only 5% of cancer drugs entering clinical trials have successfully reached approval for marketing.3,4 As a result, the classical screening approaches (cell-free or cell-based) have been re-evaluated, and progressively new techniques have been developed. Unlike classical approaches, these new techniques provide mechanistic information on the interaction of putative drugs with their targets. Metabolomics (the study of the metabolite profile in biological systems such as cells and tissues) is a promising tool which gives a holistic view on the interaction of drugs with cells.5 Various techniques such as mass spectroscopy and nuclear magnetic resonance have been employed in metabolomics.6 However, these techniques are laborious, destructive, and involve high capital cost equipment. Considering these limitations, it would be interesting to develop a screening approach based on Fourier transform infrared (FTIR) spectroscopy.
FTIR spectroscopy is a nondestructive and low-cost technique that can provide a holistic view of the chemical composition of biological samples. It is increasingly finding applications in the study of drug–cell interaction and present itself as a feasible technique for drug screening.7−9 Evidence of the effects of drugs on the cells can be inferred by acquiring the IR spectra of drug-treated cells. Several studies established numerous applications including, but are not limited to, the assessment of the effectiveness of cancer drugs against several types of cancer and distinguishing classes of anticancer drugs based on spectral changes that reflect the mode of actions of drugs.10−14 For instance, the effects of four structurally related anticancer cardiotonic steroids on prostate cancer cell line (PC-3) were investigated using FTIR spectroscopy, and the results demonstrated that unique spectral signatures can be observed from the different cellular pathways between the tested compounds.15 In a similar study, FTIR spectroscopy was employed to investigate the response of PC-3 cells to seven anticancer drugs that belong to three different classes. It was demonstrated that drugs that are known to induce similar effects appeared to cluster closely based on the resemblance of spectral features.16 Another study employed synchrotron radiation infrared microspectroscopy to distinguish classes of anticancer drugs that are known to have different effects on A2780 ovarian cancer cells. The results demonstrated a clear distinction between drugs from different modes of actions and untreated cells.17
The previously mentioned studies were conducted on chemically fixed or dry cells to benefit from the easy handling of the samples and avoid the dominance of the water signal in the mid-IR regions. These studies provided invaluable biochemical information about changes in the cellular compositions in response to the treatment; either at a single-cell level or as a population of cells. However, the chemical fixation has been shown to cause various changes of structures within cells, and hence, it may influence the spectral features of cells exposed to anticancer drugs.18−21 The study of live cells in their aqueous environment using FTIR spectroscopy has been made available using the multi-reflection attenuated total reflection (ATR) sampling method. Although water is a major obstacle in the IR study of live cells,22 the spectra of live cells can be acquired with a high signal-to-noise ratio (SNR) using the multi-reflection ATR approach.23,24 The proposed in situ approach provides two main advantages; it eliminates the artefacts originated from drying and fixing cells and allows continuous monitoring of the response of living cells exposed to anticancer drugs. The latter advantage enables a real-time probing of the changes in the major cellular compositions such as proteins, nucleic acids, and phosphorylated compounds. Therefore, it further enhances the predictability of this approach in the study of drug–cell interaction, as cellular changes can be tracked at different time points in the same experiment.
We have recently shown that ATR FTIR spectroscopy combined with principal component analysis (PCA) is a powerful technique to distinguish the response of MDA-MB-231 cells, a triple negative cell, based on their different modes of actions. The results have shown that drugs with the same mode of action (tamoxifen and toremifene) were clustered together and well-separated from other drugs of different modes of action (imatinib and doxorubicin).25
In the present work, a different cell line, MCF7, which is known to express estrogen, progesterone, and human epidermal growth factor receptor 2 (HER2) receptor (triple positive) is utilized to evaluate if the different modes of action of the same drug on different cell line can also be distinguished using the live cell FTIR approach. MCF7 and MDA-MB-231 cells are both commonly used breast cancer cell lines as an in vitro model to study breast cancer biology. Both cells are used in the National Cancer Institute (NCI60) screening program and in research for the development of anticancer drugs as well as in understanding drug resistance.26 Studies have demonstrated different biochemical pathways for the response of MCF7 and MDA-MB-231 cells to the selective estrogen receptor modulators (SERMs) such as tamoxifen and toremifene. The cytotoxicity of tamoxifen against the triple negative breast cancer cells (e.g., MDA-MB-231) has shown to be mediated through an estrogen-independent pathway.27 However, tamoxifen induces cytotoxicity in MCF7 cells mainly through an estrogen-dependent pathway.28 To our knowledge, this is the first study which utilized FTIR spectroscopy to compare two breast cancer cells (having different expression level of estrogen receptor) in response to the same drugs and investigate if the induced spectral changes correlate with the different modes of actions. Furthermore, the response of MCF7 cells to doxorubicin (DNA-intercalating agent) aimed at investigating if the spectral changes of a specific mode of action are similar for both cell lines.
Results and Discussion
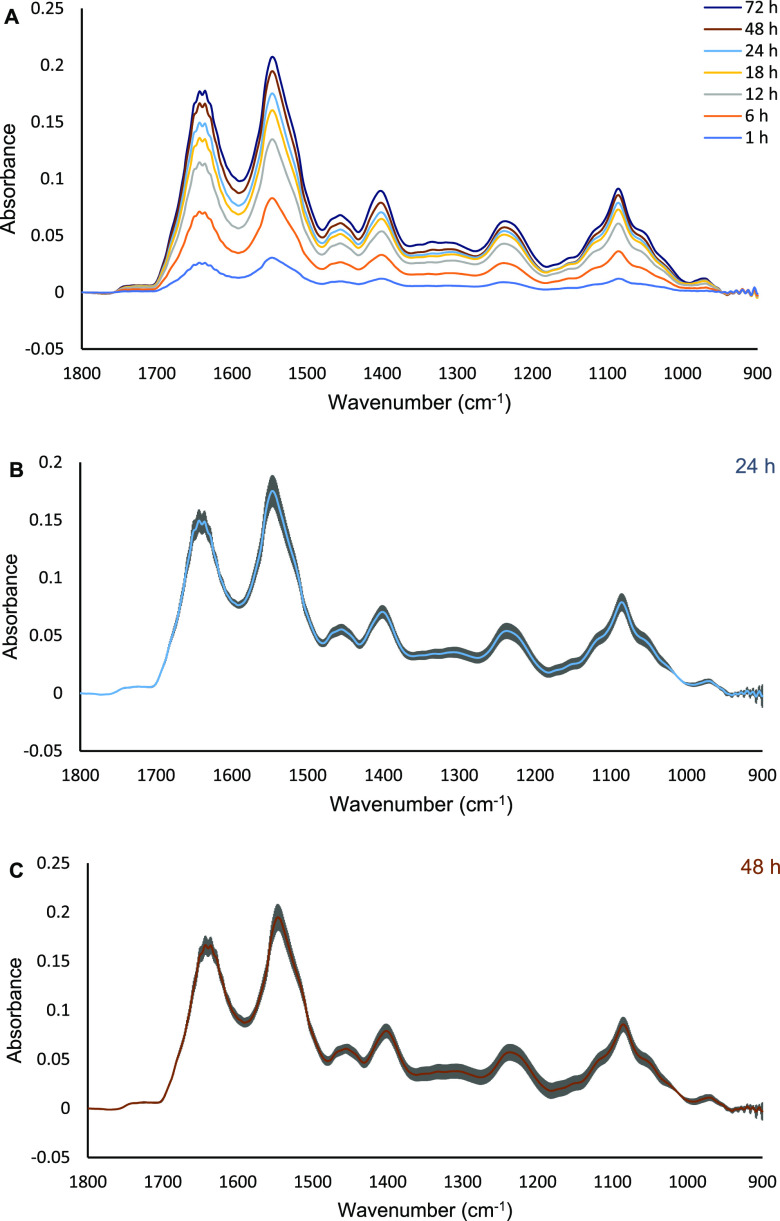
The attachment and growth of MCF7 cells on the ZnS ATR element in the culture medium (i.e., L-15 medium) was first examined for the time of the experiment (in total, approximately 72 h from seeding the cells). The cells were seeded at high density (∼200,000 cells/cm2) to ensure a monolayer of cells is formed. Figure 1A shows the typical FTIR spectra of MCF7 cells with the absorbance of amide II (1545 cm–1) reproducibly reaching a plateau of ∼0.22 a.u. after 72 h from seeding. The growth of the absorbance of amide II slowed down after 24 h of seeding, suggesting that the cell has reached the plateau phase. This enables the detection of the subtle changes in cellular compositions after the addition of the drugs at the 24th h. The averaged spectra of the 24th and 48th h after seeding the cells from four repeated experiments, each from a separate culture, are presented in Figure 1B and C. The high reproducibility of the experiment was indicated by the small standard deviation shown.
Figure 1.
Representative ATR FTIR spectra of MCF7 cells seeded on the ATR element for 72 h (A). The spectra are an average of four independent FTIR measurements. A straight line between 1800 and 950 cm–1 was used to baseline the spectra. The error bars of the 24th and 48th h average spectra are presented in (B,C), respectively (n = 4). The gray color in (B and C) indicates the standard deviations of the measurements for every wavenumber (cm–1).
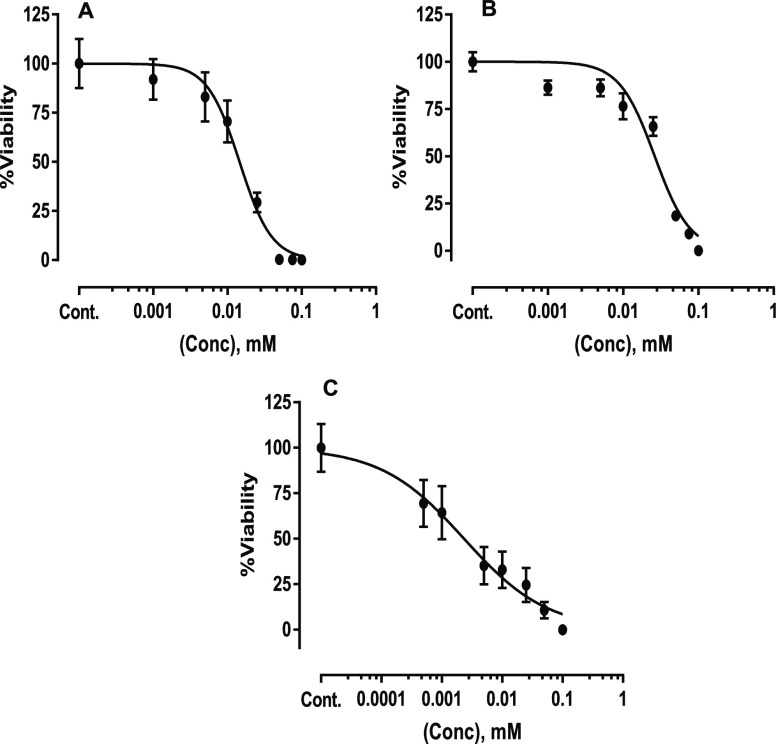
In the previous study, we have demonstrated that studying spectral changes of cells at the IC50 (the concentration required to cause 50% reduction in the growth of cells after 24 h) produced the most clear grouping of drugs according to their modes of action.25 IC50 is also a commonly used concentration in the screening for new drugs and, therefore, it is used as a reference concentration in this study to normalize possible variations in the performance of the drugs because of differences in the rate of drug uptake and transport. The percentage viability of MCF7 treated with tamoxifen, toremifene, and doxorubicin for 24 h were determined by the 3-(4,5-dimethylthiazol-2-yl)-2,5-diphenyltetrazolium bromide (MTT) assay are shown in (Figure 2A–C) and in Table 1.
Figure 2.
Viability percentage of MCF7 cells seeded in L-15 medium and treated with tamoxifen (A), toremifene (B), and doxorubicin (C) for 24 h. Data are presented as mean ± SD of three independent MTT assays.
Table 1. Summary of the Calculated IC50 against MCF7 Cells and the Modes of Action of Drugs Used in This Study.
| drug | mode of action | IC50 (μM) |
|---|---|---|
| tamoxifen | SERMs also known as estrogen-dependent pathway mainly in ER-positive breast cancer (e.g. MCF7) | ∼14.5 |
| toremifene | SERMs also known as estrogen-dependent pathway mainly in ER-positive breast cancer (e.g. MCF7) | ∼23.3 |
| doxorubicin | DNA-intercalating agent | ∼2.1 |
The effect of tamoxifen and toremifene on the estrogen positive breast cancer (e.g., MCF7) is believed to be mediated through competitive binding to estrogen receptors (ER) against estrogen, which is also known as a classical genomic mechanism. Other studies also suggested a nongenomic mechanism that is mediated through the epidermal growth factor receptor (EGFR), which leads to sustained phosphorylation of ERK 1/2 in ER-positive cancer cell lines (MCF-7 and T47D).28,29 Doxorubicin is a broad spectrum anthracycline anticancer agent that is very effective in the treatment of many cancer types and widely used in the treatment of breast cancer cells.30 The in vitro effect of doxorubicin on the MCF7 and MDA-MB-231 cells is well-established. For example, some studies have shown multiple mechanisms at the molecular level of the doxorubicin DNA intercalation effects in breast cancer, which eventually leads to the induction of apoptosis and cells death.31
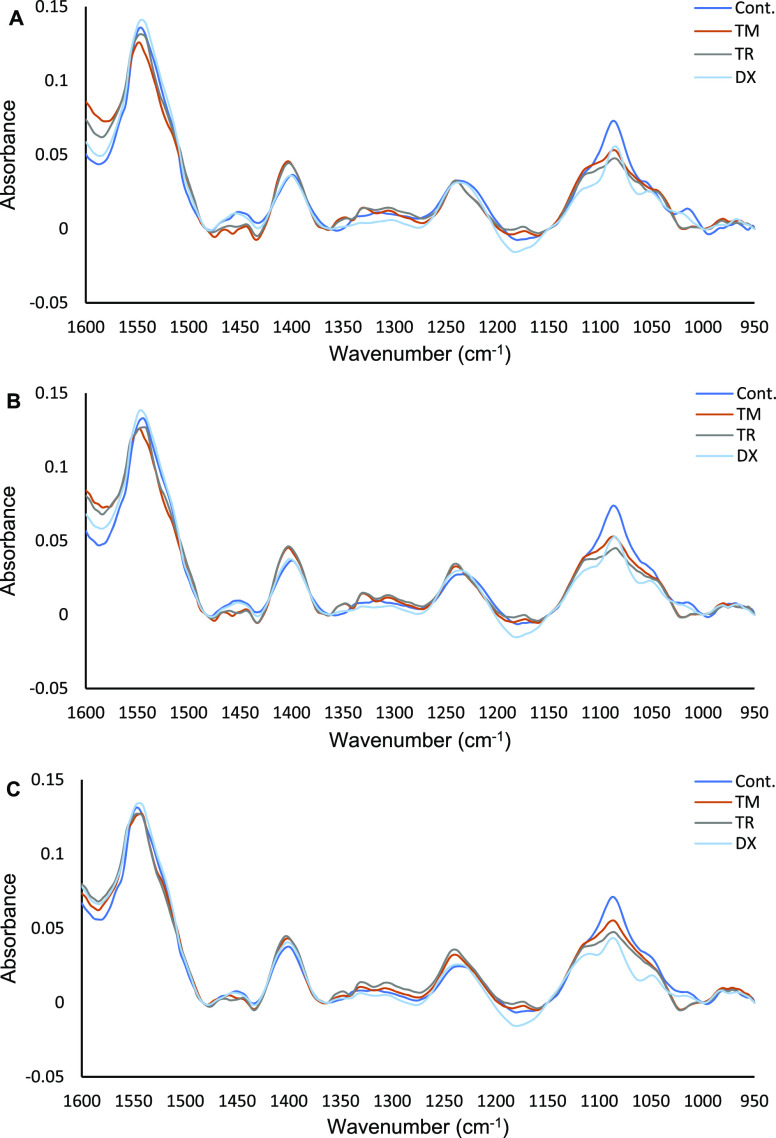
The acquired data were preprocessed as previously described.25 The first spectrum measured immediately after adding the drugs was used as a background, which was ratioed to the subsequent spectra to obtain the difference spectra. The difference spectra underline the subtle spectraI changes of cells after the introduction of anticancer drugs. Because spectra were collected at 20 min intervals, many time points can be analyzed individually. To maintain the simplicity of the presentation, vector-normalized difference spectra acquired at the 2nd, 4th, and 6th hours of exposure to drugs have been selectively presented in (Figure 3A–C). The difference spectra of untreated cells (control) mainly highlight the typical spectrum of cells because of the continual incremental growth of the cell, as previously shown in (Figure 1). In comparison to the control, the drug-treated MCF7 cells demonstrated different spectral changes mainly in the 1240–950 cm–1 region where absorbance peaks of cellular components such as nucleic acids, phosphorylated compounds, and carbohydrates can be identified. Tamoxifen and toremifene, which belong to the same class of anticancer drugs (i.e., SERMs) prominently show similar spectral changes that are different from the control and the doxorubicin-treated cells. Furthermore, the doxorubicin-treated MCF7 cell spectrum shows a reduction in the absorbance of peaks at 1085 and 1050 cm–1 regions at the 2nd hour of exposure, which become more apparent at the 4th and 6th hours of exposure, while amide II bands ∼1545 cm–1 showed no significant changes (Figure 3B and C). These changes have been previously recognized in PC-3 cells treated with 1.0 μM doxorubicin and in MDA-MB-231 cells treated with IC50 of doxorubicin (∼3 μM), which is attributed to the breakage of the phosphate backbone of the DNA because of the intercalation effect of doxorubicin.24,25
Figure 3.
FTIR (vector normalized) difference spectra of live MCF7 cells after exposure to 0.1% dimethyl sulfoxide (DMSO) [drug vehicle; control(C)] and IC50 of tamoxifen (TM), toremifene (TR), and doxorubicin (DX) for 2, 4, and 6 h (A, B, and C, respectively). The spectra presented are an average of four repeated measurements for each condition. Refer to Figure S5 for the average spectra with error bars.
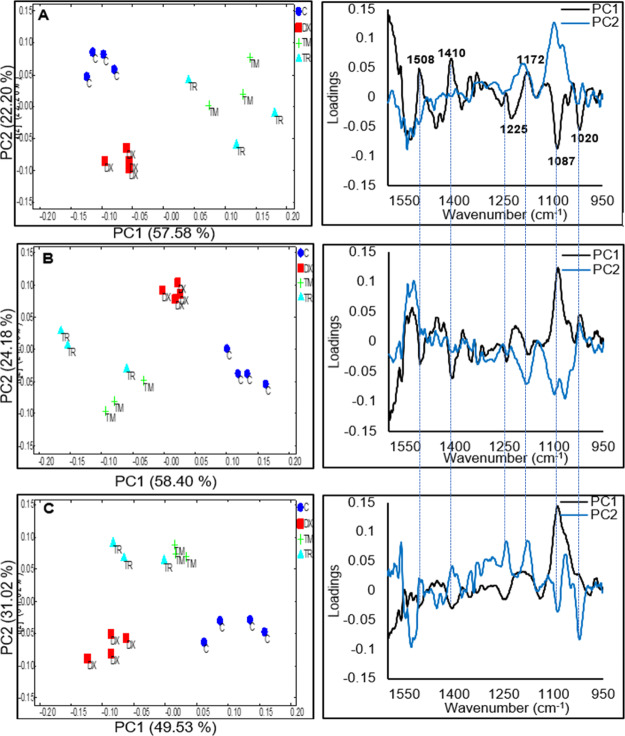
PCA of the difference spectra of control and drug-treated MCF7 cells are shown in Figure 4. The score (which highlights the “intensity”) and the corresponding loading (which highlights the spectral pattern) plots of first two PCs at the 2nd, 4th, and 6th hours of live MCF7 cells exposed to the IC50 of tamoxifen, toremifene, and doxorubicin are shown in Figure 4A–C, respectively. First, it can be observed that the score plots of PC1 versus PC2 of the 2nd, 4th, and 6th h clearly separated tamoxifen/toremifene-treated MCF7 cells from doxorubicin-treated and from untreated cells (control). Most importantly, tamoxifen and toremifene-treated MCF7 cells always clustered relatedly, which again confirmed the remarkable similarity observed from the difference spectra shown in Figure 3A–C. Additionally, the PCA loading plots demonstrated a time-dependent spectral change in which the loadings of PC1 and PC2 in the 2nd hour of exposure are different from that of 6th hour of exposure. In Figure 4A, for example, the PC1 of the 2nd hour (accounted for 57.58% of the major variances) mainly separated tamoxifen/toremifene-treated MCF7 cells from doxorubicin-treated cells and control and highlighted spectral changes at 1020, 1087, 1172, 1225, 1410, and 1508 cm–1. The peaks at 1172 and 1508 cm–1 overlap with the spectrum of tamoxifen and toremifene and are possibly indicative of drug accumulations in the cells (refer Figure S6). However, other peaks that are notably detected in the same PC1 loadings are not originated from the absorbance of the drugs and accounted for the grouping as well. The PC2 score (22.20% of the variances) and loading plots of the 2nd hour exposure highlighted changes at 1200–1240 and 1085 cm–1 and mainly separated doxorubicin-treated cells from the control, as presented in Figure 4A. These bands are characteristic of the asymmetric (∼1237 cm–1) and symmetric phosphodiester vibrations of nucleic acids (∼1085 cm–1) and could be an indication of DNA-intercalating mechanism of doxorubicin. The score plot of PC1 versus PC2 for the 4th h shown in Figure 4B once again provided a grouping of the drugs in a similar pattern, with an inverted sign, as previously observed in the 2nd h exposure (Figure 4A). The PC1 represented 58.40% of the variances and separated tamoxifen/toremifene-treated MCF7 cells from doxorubicin-treated cells and control and highlighted the same spectral changes, as observed in Figure 4A, with an inverted sign. Compared to the 2nd hour of exposure, the contribution of tamoxifen/toremifene accumulations peaks (i.e., bands at 1508 and 1172 cm–1) was weaker. At the 6th hour of exposure, the score plot of PC1 versus PC2 continues to show a clear separation between the drugs with different modes of actions, as shown in Figure 4C. However, PC1 (49.53% of the variances), mainly in this case, separated doxorubicin-treated cells from tamoxifen/toremifene and untreated cells. The PC1 loadings remarkably highlighted spectral changes at 1240–1200 and 1085 cm–1 that are associated with DNA-intercalating effects of doxorubicin, as previously discussed. PC2 mainly separated tamoxifen/toremifene-treated MCF7 cells and highlighted spectral changes similar to the PC1 at the 2nd and 4th hour of treatment with a diminished contribution from the 1508 cm–1 band.
Figure 4.
PCA scores and their corresponding loadings of FTIR vector normalized difference spectra of live MCF7 cells after exposure to 0.1% DMSO (control) and IC50 of tamoxifen (TM), toremifene (TR), and doxorubicin (DX) in the 2nd h (A), 4th h (B), and 6th h (C). Vertical lines were added to the loading plots to aid in the comparison between the different hours of treatment.
Importantly, the PCA loadings of the live MCF7 cells exposed to drugs at different time points grouped drugs according to their modes of actions and remarkably highlighted spectral changes in the 1250–950 cm–1 region. Absorbance peaks in this particular region are indicative of changes in the asymmetric PO2– of nucleic acids, phosphorylated proteins (∼1237 cm–1), C–O of carbohydrates and proteins side chains (∼1150 cm–1), symmetric PO2– of nucleic acids and PO42– phosphorylated proteins, C–O–C and C–O–P of polysaccharides (∼1080 cm–1), C–O of carbohydrates (∼1050–1036 cm–1), and PO42– of phosphorylated proteins and nucleic acids (∼990–970 cm–1). It is worth mentioning that spectral changes in the 1250–950 cm–1 region have been previously demonstrated in MDA-MB-231 cells exposed to the IC50 of tamoxifen/toremifene, imatinib, and doxorubicin. In a similar approach to the one employed in this study, PCA of the 2nd, 4th, and 6th h grouped drugs with a similar mode of action in the same cluster, while drugs with different modes of action were clustered separately.25 Further investigation, as we shall discuss later, will underline if the spectral changes due to the exposure to the same drug will be similar in different cell lines with different properties.
Comparison Between MCF7 and MDA-MB-231 Cells
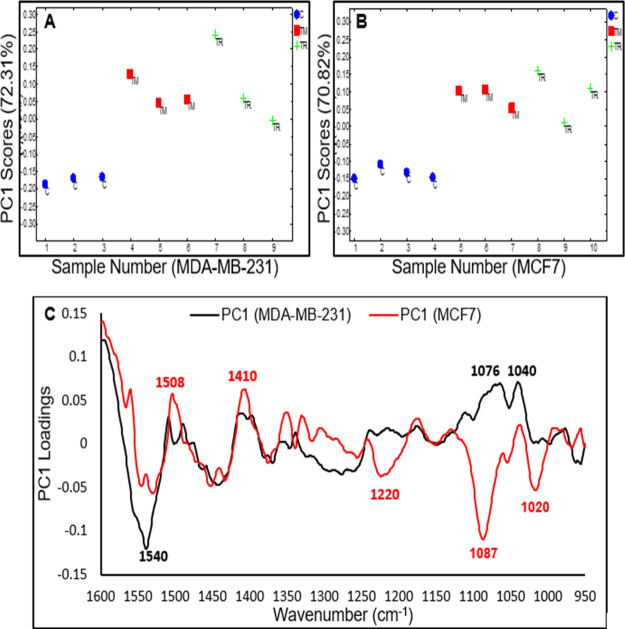
The response of MCF7 and MDA-MB-231 cells treated with the IC50 of tamoxifen, toremifene, and doxorubicin have been investigated to determine whether the different modes of action of the same drug in different cell lines can be detected using the live cell FTIR approach. The results from the pairwise PCA (SERM drugs-treated vs control) for the MCF7 and MDA-MB-231 cells at a specific length of time of exposure are shown in Figures 5 and 7. In all pairwise PCA, PC1 represented more than 70% of the variances and is the only PC that provides clear separation between the drug-treated cells and the control cells. The pairwise PCA of the spectral response of MCF7 cells and MDA-MB-231 has shown clear separation after the second hour of exposure to IC50 tamoxifen/toremifene (Figure 5A–C). Although similar spectral changes were detected in the 1600–1400 cm–1 region, remarkable difference can be observed in the 1400–900 cm–1 region, suggesting that these drugs have different modes of actions in the MCF7 and MDA-MB-231 cells. Tamoxifen/toremifene are known SERMs, and their classical modes of actions in ER-positive cancer cells (i.e., MCF7) are mainly mediated through their competition with estrogen for binding to the estrogen receptor (ER), which eventually lead to the induction of cell death. The MDA-MB-231 cells, also known as triple negative cells, lack the expression of ER, progesterone receptor (PR), and HER2. The cytotoxicity of tamoxifen against MDA-MB-231 is well-established and demonstrated to be mediated through the inhibition of protein phosphatase 2A (CIP2A) and phospho-Akt (p-Akt).27,32 Moreover, tamoxifen induces cells death in both ER-positive (MCF7) and ER-negative (MDA-MB-231) cells by the rapid mitochondrial death program that involves an increase in the production of reactive oxygen species (ROS), the release of cytochrome c, and decrease in the mitochondrial membrane potential.28,33 The dissimilarity in the response of MCF7 and MDA-MB-231 cells to tamoxifen/toremifene at the same cytotoxicity level (i.e., IC50) reflected the different modes of actions of tested drugs on these two cell lines.
Figure 5.
(A) Pairwise PC1 scores of MDA-MB-231 cells for control (1–3) vs tamoxifen (4–6) and toremifene (7–9). (B) Pairwise PC1 score of MCF7 cells for control (1–4) vs tamoxifen (5–7) and toremifene (8–10). (C) Corresponding PC1 loadings of MDA-MB-231 cells (black spectrum) and MCF7 (red spectrum) after the 2nd h of exposure to the IC50 of tamoxifen/toremifene.
Figure 7.
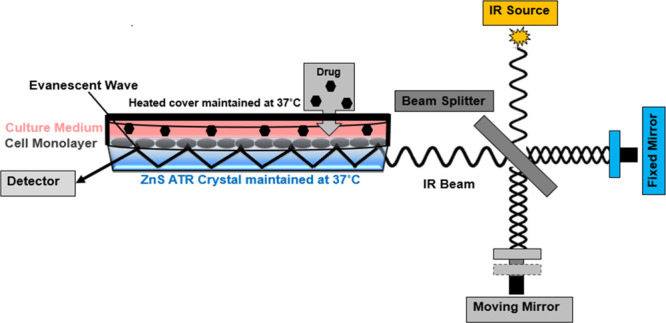
Schematic describing the ATR element and the cell culture set up for the live cells FTIR measurement. An IR beam from the interferometer is shone on the live cells intimately adhered to the ATR surface and undergoes internal reflections. The generated evanescent wave penetrates (∼2–3 μm) and is absorbed by the sample (cells), which is then converted to an ATR absorbance spectrum by FT.
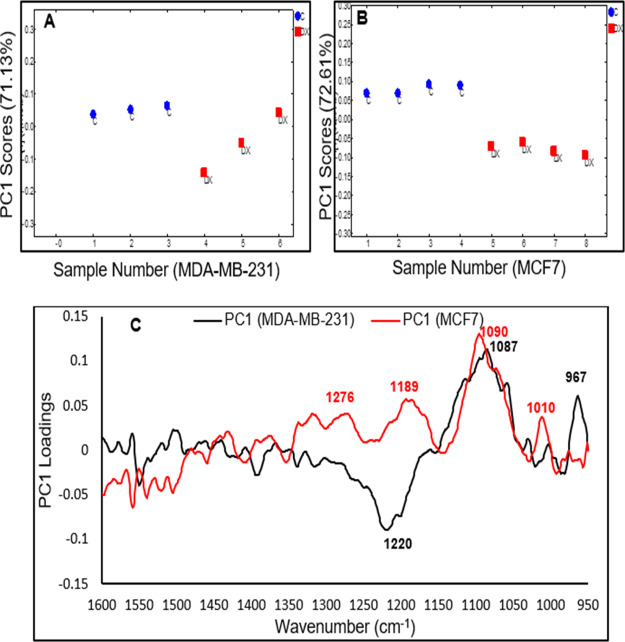
Likewise, the pairwise PCA of the response of MCF7 cells and MDA-MB-231 after the second hour of exposure to the IC50 of doxorubicin are shown in Figure 6A–C. The PC1 loadings of MDA-MB-231 cells (black spectrum) and MCF7 cells (red spectrum), to some extent, show similarity in the 1150–950 cm–1 region with a significant decrease in absorbance of the band at 1087 cm–1. This band is mainly associated with the symmetric phosphodiester vibrations of nucleic acids (∼1085 cm–1), which is expected from the DNA-intercalating effects of doxorubicin in these two cell lines. The differences in response observed in the 1250–1150 cm–1 possibly originated from other cellular metabolites that are originated from upstream or downstream signaling cascades because of the DNA intercalations. As previously mentioned, different mechanisms have been demonstrated to explain the role of doxorubicin in the DNA-intercalation such as the generation of free radicals, inhibition of topoisomerase II enzyme, and the interference of helicase activity and DNA unwinding.31,34 Doxorubicin has also been demonstrated to induce transcriptional changes with many variations between cell types.35,36 The pairwise analysis of the 4th and 6th h of MCF7 and MDA-MB-231 cells in response to each of the drugs demonstrated similar spectral changes (PCs loadings) to the 2nd h, and the results are presented in Figures S7 and S8.
Figure 6.
(A) Pairwise PC1 scores of MDA-MB-231 cells for control (1–3) vs doxorubicin (4–6). (B) Pairwise PC1 scores of MCF7 cells for control (1–4) vs doxorubicin (5–8). (C) Corresponding PC1 loadings of MDA-MB-231 cells (black spectrum) and MCF7 (red spectrum) after the 2nd hour of exposure to the IC50 of doxorubicin.
Conclusions
In this study, live-cell FTIR spectroscopy has been demonstrated as a powerful technique to distinguish the modes of actions between different drugs on the same cell line and the different response to the same drug from cell lines of different characteristics. The difference spectra of MCF7 cells treated in IC50 of tamoxifen and toremifene, which belong to the same anticancer class (SERMs), show remarkable similar spectral changes. However, doxorubicin-treated MCF7 cells presented spectral changes that are different from cells treated in tamoxifen/toremifene. These changes mainly occurred in the spectral regions at 1085 and 1200–1240 cm–1, which could be associated with the DNA-intercalation effects of doxorubicin. The pairwise PCA confirms that MCF7 cells responded differently to the SERMs in comparison to the triple negative MDA-MB-231 cells when treated in the SERMs, which is another evidence of the cell line-dependent modes of actions of these drugs. These results are in good agreement with several studies, which have shown that SERMs can induce their cytotoxic effect either in an estrogen-dependent pathway (for estrogen-positive cells such as MCF7) or estrogen-independent pathway (for estrogen-negative cells such as MDA-MB-231).
Furthermore, the pairwise PCA of doxorubicin-treated cells demonstrated remarkable similarity between the two cell lines in the 1150–950 cm–1 regions, highlighting the DNA intercalating effect of the drug, but some variations were observed at 1200–1250 cm–1. This indicates that the response of different breast cancer cells to doxorubicin is not entirely the same, and several types of breast cancer cells should be tested in the future. In summary, the live-cell FTIR method holds promising potential in distinguishing drugs according to their modes of action. Further collection of live-cell data will help in designing a discrimination model to predict the modes of action of anticancer molecules and eventually can be employed in preclinical screening for novel anticancer drugs.
Experimental Section
Multibounce ATR-FTIR Accessory
A 10-reflection (10 internal reflections on the sample side) ATR accessory trough plate (HATR, Pike technologies) controlled at 37 °C with a 45° ZnS ATR element (80 × 10 × 4 mm, Crystran Ltd., UK) was used. A schematic is shown in Figure 7. The effective path length obtained in the living cells produced from this accessory is approximately 20–30 μm, with a depth of penetration (dp) nearly 2–3 μm. The trough plate has a measurement surface of about 500 mm2, where live cells are adhered and continuously measured.
Live Cell Preparation
MCF7 cells were maintained in T25 cell culture flasks using DMEM high glucose medium with 10% FBS, 1% MEM NEAA, 2 mM l-glutamine, 100 U/mL penicillin, and 100 U/mL streptomycin and incubated in a 5% CO2 and 37 °C incubator. The cells were trypsinized and harvested when they reached ∼80% confluence and then centrifuged into a pellet. The pellet was then resuspended in the L-15 medium, supplemented with 10% FBS, 1% MEM NEAA, 2 mM l-glutamine, 100 U/mL penicillin, and 100 μg/mL streptomycin, to reach a cell density of ∼5.0 × 10⁵ cells/mL and total of 2.0 mL of suspension (i.e., ∼1.0 × 10⁶ cells). Cell suspension was directly seeded onto the multi-reflection trough plate controlled at 37 °C and sealed with a heated glass cover lid at 37 °C, to control the temperature in the measurement chamber. After 24 h of incubation, the high seeding density ensured that cells are attached to the measurement surface as a monolayer with high (∼90%) confluence. A reflective optical microscope with 10× objective (L2003 microscope fitted with a digital camera) was used to confirm the confluence and attachment of cells to the measurement surface (see Figure S1).
Determination of Cell Viability
The viability of cells was determined using the standard MTT assay.37 In brief, suspension of MCF7 cells (2 × 10⁴ cells per well) in L-15 medium was seeded in a 96-well plate and allowed to grow for 24 h at 37 °C to reach a comparable confluence (∼90%) to the ATR–FTIR experiment. The medium was then replaced with the L-15 medium containing different concentrations of tamoxifen, toremifene (dissolve in DMSO), and doxorubicin (dissolved in water) and incubated at 37 °C for 24 h. In all treatments, the final concentration of DMSO was maintained at 0.1%. Afterward, the supernatant of each well was removed, washed once with PBS, and replaced with 100 μL (0.5 mg/mL) of MTT in L-15 medium. The 96-well plate was incubated for 3 h before discarding the MTT solution. In the last step, 100 μL per well of DMSO was added to dissolve the resulted formazan product, and the absorbance was measured at 570 nm, with the reference at 630 nm, in a Spectra MAX 190 multiwell plate reader. The relative cell viability percentage was calculated by comparing the absorbance of treated cells with control, where 0.1% DMSO in L-15 medium was applied instead of the drug solution. GraphPad Prism was used to calculate the IC50 and data presented as mean ± SD.
FTIR Measurement of Samples
An FTIR spectrometer (Frontier, PerkinElmer Ltd., UK) fitted with a room-temperature deuterated triglycine sulfate (DTGS) detector was used. After seeding the cells in the ATR trough plate for 24 h, the cells attached to the ZnS ATR element were exposed to IC50 of tamoxifen, toremifene, and doxorubicin by adding appropriate amounts of 50 mM stock solution in the L-15 medium and maintain a total of 0.1% DMSO. Cell spectra were measured by averaging ∼237 scans (scanning time of 11 min) and were acquired every 20 min so that three spectra were collected hourly (i.e., 144 spectra were collected within the 48 h period). The IR spectrum of cells were measured in the spectral region of 2000–900 cm–1 with a spectral resolution of 8 cm–1 and 0.2 cm/s mirror speed. A strong Norton–Beer apodization function and self-phase correction were selected for the interferogram process. Spectrum 10 software (PerkinElmer Ltd., UK) was used for data processing, including baseline and the water vapor correction. Spectra of cells were continuously monitored from the moment after seeding the cells on the ATR element for 24 h. For control, DMSO was added to the medium on the ATR trough to reach a concentration of 0.1% and measured for another 24 h. A spectrum of L-15 medium was used as a background to obtain the full spectra of cells with water vapor subtracted. For difference spectra, the first spectrum of cells immediately after the addition of drugs was used as a background to highlight the changes in live cells (see Figure S2). All experiments were repeated at least three times.
Principal Component Analysis
PCA was carried out using PyChem Software (http://pychem.sourceforge.net/).38 This analysis was applied to reduce the dimension of the spectroscopic data. The correlation matrix and Nonlinear Iterative Partial Least Squares (NIPALS) were selected for the PCA analysis. The data preprocessing was performed, as previously described in reference (25). Briefly, the spectral wavenumber range was truncated to 1800–900 cm–1, and then, an interactive baseline correction using the Spectrum 10 software (PerkinElmer) was performed based on the minima absorbance at 2000, 1800, 1757, 1480, 1000, and 950 cm–1. Vector normalization was calculated in Microsoft Excel 10, in which spectra were divided by the square root of the sum of the mean intensities squared. PCA was applied to analyze spectra extracted from different time points after the addition of drugs. The analysis was focused on the first two principle components (i.e., PC1 and PC2), as they accounted for more than 85% of the variances (Figure S3). The amide I region (∼1640 cm–1) was excluded in the PCA, as the water peak at this region exceeded 1, which indicates that the detector will not operate in linear response at this band (Figure S4).23,39
Acknowledgments
K.L.A.C. thanks EPSRC (grant number EP/L013045/1) for funding support. A.A. thanks Prince Sattam Bin Abdulaziz University (Saudi Arabia) for his PhD sponsorship.
Glossary
Abbreviations
- ATR
attenuated total reflection
- DNA
deoxyribonucleic acid
- EGFR
epidermal growth factor receptor
- ER
estrogen receptors
- FTIR
Fourier transform infrared
- HER2
human epidermal growth factor receptor 2
- MTT
3-(4,5-dimethylthiazol-2-yl)-2,5-diphenyltetrazolium bromide
- PC1
principal component 1
- PC2
principal component 2
- PCA
principal component analysis
- PR
progesterone receptor
- ROS
reactive oxygen species
- SERMs
selective estrogen receptor modulators
- SNR
signal-to-noise ratio
Supporting Information Available
The Supporting Information is available free of charge at https://pubs.acs.org/doi/10.1021/acsomega.9b04369.
Visible image of MCF7 cells on the ZnS ATR crystal; spectra of cells after various treatments; cumulative variance versus number of principle component plot; ATR FTIR spectrum of water; difference spectra of MCF7 cells after various treatments; spectra of drugs in solution; pairwise (drug-treated and control) PCA analysis at 4 h after treatment; and pairwise (drug-treated and control) PCA analysis at 6 h after treatment (PDF)
Author Contributions
K.L.A.C. and K.M.R. conceived the idea, A.A. carried out all experimental works, processed the data, and wrote the draft. K.L.A.C. and A.A. interpreted the data. All authors proof-read the draft.
The authors declare no competing financial interest.
Supplementary Material
References
- Hambley T. W. Is Anticancer Drug Development Heading in the Right Direction?. Cancer Res. 2009, 69, 1259–1262. 10.1158/0008-5472.can-08-3786. [DOI] [PubMed] [Google Scholar]
- Hait W. N. Anticancer drug development: the grand challenges. Nat. Rev. Drug Discovery 2010, 9, 253–254. 10.1038/nrd3144. [DOI] [PubMed] [Google Scholar]
- Hutchinson L.; Kirk R. High drug attrition rates-where are we going wrong?. Nat. Rev. Clin. Oncol. 2011, 8, 189–190. 10.1038/nrclinonc.2011.34. [DOI] [PubMed] [Google Scholar]
- Moreno L.; Pearson A. D. How can attrition rates be reduced in cancer drug discovery?. Expert Opin. Drug Discovery 2013, 8, 363–368. 10.1517/17460441.2013.768984. [DOI] [PubMed] [Google Scholar]
- Wishart D. S. Applications of metabolomics in drug discovery and development. Drugs R&D 2008, 9, 307–322. 10.2165/00126839-200809050-00002. [DOI] [PubMed] [Google Scholar]
- Mikami T.; Aoki M.; Kimura T. The application of mass spectrometry to proteomics and metabolomics in biomarker discovery and drug development. Curr. Mol. Pharmacol. 2012, 5, 301–316. 10.2174/1874467211205020301. [DOI] [PubMed] [Google Scholar]
- Jamieson L. E.; Byrne H. J. Vibrational spectroscopy as a tool for studying drug-cell interaction: Could high throughput vibrational spectroscopic screening improve drug development?. Vib. Spectrosc. 2017, 91, 16–30. 10.1016/j.vibspec.2016.09.003. [DOI] [Google Scholar]
- Mignolet A.; Derenne A.; Smolina M.; Wood B. R.; Goormaghtigh E. FTIR spectral signature of anticancer drugs. Can drug mode of action be identified?. Biochim. Biophys. Acta, Proteins Proteomics 2016, 1864, 85–101. 10.1016/j.bbapap.2015.08.010. [DOI] [PubMed] [Google Scholar]
- Hughes C.; Clemens G.; Baker M. J. Preclinical screening of anticancer drugs using infrared (IR) microspectroscopy. Trends Biotechnol. 2015, 33, 429–430. 10.1016/j.tibtech.2015.03.010. [DOI] [PubMed] [Google Scholar]
- Zwielly A.; Gopas J.; Brkic G.; Mordechai S. Discrimination between drug-resistant and non-resistant human melanoma cell lines by FTIR spectroscopy. Analyst 2009, 134, 294–300. 10.1039/b805223a. [DOI] [PubMed] [Google Scholar]
- Rutter A. V.; Siddique M. R.; Filik J.; Sandt C.; Dumas P.; Cinque G.; Sockalingum G. D.; Yang Y.; Sulé-Suso J. Study of Gemcitabine-Sensitive/Resistant Cancer Cells by Cell Cloning and Synchrotron FTIR Microspectroscopy. Cytometry, Part A 2014, 85, 688–697. 10.1002/cyto.a.22488. [DOI] [PubMed] [Google Scholar]
- Derenne A.; Gasper R.; Goormaghtigh E. The FTIR spectrum of prostate cancer cells allows the classification of anticancer drugs according to their mode of action. Analyst 2011, 136, 1134–1141. 10.1039/c0an00872a. [DOI] [PubMed] [Google Scholar]
- Berger G.; Gasper R.; Lamoral-Theys D.; Wellner A.; Gelbcke M.; Gust R.; Nève J.; Kiss R.; Goormaghtigh E.; Dufrasne F. Fourier Transform Infrared (FTIR) spectroscopy to monitor the cellular impact of newly synthesized platinum derivatives. Int. J. Oncol. 2010, 37, 679–686. 10.3892/ijo_00000717. [DOI] [PubMed] [Google Scholar]
- Gasper R.; Dewelle J.; Kiss R.; Mijatovic T.; Goormaghtigh E. IR spectroscopy as a new tool for evidencing antitumor drug signatures. Biochim. Biophys. Acta, Biomembr. 2009, 1788, 1263–1270. 10.1016/j.bbamem.2009.02.016. [DOI] [PubMed] [Google Scholar]
- Gasper R.; Mijatovic T.; Bénard A.; Derenne A.; Kiss R.; Goormaghtigh E. FTIR spectral signature of the effect of cardiotonic steroids with antitumoral properties on a prostate cancer cell line. Biochim. Biophys. Acta, Mol. Basis Dis. 2010, 1802, 1087–1094. 10.1016/j.bbadis.2010.07.012. [DOI] [PubMed] [Google Scholar]
- Derenne A.; Verdonck M.; Goormaghtigh E. The effect of anticancer drugs on seven cell lines monitored by FTIR spectroscopy. Analyst 2012, 137, 3255–3264. 10.1039/c2an35116a. [DOI] [PubMed] [Google Scholar]
- Flower K. R.; Khalifa I.; Bassan P.; Démoulin D.; Jackson E.; Lockyer N. P.; McGown A. T.; Miles P.; Vaccari L.; Gardner P. Synchrotron FTIR analysis of drug treated ovarian A2780 cells: an ability to differentiate cell response to different drugs?. Analyst 2011, 136, 498–507. 10.1039/c0an00564a. [DOI] [PubMed] [Google Scholar]
- Hobro A. J.; Smith N. I. An evaluation of fixation methods: Spatial and compositional cellular changes observed by Raman imaging. Vib. Spectrosc. 2017, 91, 31–45. 10.1016/j.vibspec.2016.10.012. [DOI] [Google Scholar]
- Whelan D. R.; Bambery K. R.; Heraud P.; Tobin M. J.; Diem M.; McNaughton D.; Wood B. R. Monitoring the reversible B to A-like transition of DNA in eukaryotic cells using Fourier transform infrared spectroscopy. Nucleic Acids Res. 2011, 39, 5439–5448. 10.1093/nar/gkr175. [DOI] [PMC free article] [PubMed] [Google Scholar]
- Wood B. R. The importance of hydration and DNA conformation in interpreting infrared spectra of cells and tissues. Chem. Soc. Rev. 2016, 45, 1980–1998. 10.1039/c5cs00511f. [DOI] [PubMed] [Google Scholar]
- Doherty J.; Zhang Z.; Wehbe K.; Cinque G.; Gardner P.; Denbigh J. Increased optical pathlength through aqueous media for the infrared microanalysis of live cells. Anal. Bioanal. Chem. 2018, 410, 5779–5789. 10.1007/s00216-018-1188-2. [DOI] [PMC free article] [PubMed] [Google Scholar]
- Kuimova M. K.; Chan K. L. A.; Kazarian S. G. Chemical imaging of live cancer cells in the natural aqueous environment. Appl. Spectrosc. 2009, 63, 164–171. 10.1366/000370209787391969. [DOI] [PubMed] [Google Scholar]
- Chan K. L. A.; Fale P. L. V. Label-free in situ quantification of drug in living cells at micromolar levels using infrared spectroscopy. Anal. Chem. 2014, 86, 11673–11679. 10.1021/ac503915c. [DOI] [PubMed] [Google Scholar]
- Fale P. L.; Altharawi A.; Chan K. L. A. In situ Fourier transform infrared analysis of live cells’ response to doxorubicin. Biochim. Biophys. Acta, Mol. Cell Res. 2015, 1853, 2640–2648. 10.1016/j.bbamcr.2015.07.018. [DOI] [PubMed] [Google Scholar]
- Altharawi A.; Rahman K. M.; Chan K. L. A. Towards identifying the mode of action of drugs using live-cell FTIR spectroscopy. Analyst 2019, 144, 2725–2735. 10.1039/c8an02218f. [DOI] [PubMed] [Google Scholar]
- Shoemaker R. H. The NCI60 human tumour cell line anticancer drug screen. Nat. Rev. Cancer 2006, 6, 813–823. 10.1038/nrc1951. [DOI] [PubMed] [Google Scholar]
- Liu C.-Y.; Hung M.-H.; Wang D.-S.; Chu P.-Y.; Su J.-C.; Teng T.-H.; Huang C.-T.; Chao T.-T.; Wang C.-Y.; Shiau C.-W.; Tseng L.-M.; Chen K.-F. Tamoxifen induces apoptosis through cancerous inhibitor of protein phosphatase 2A-dependent phospho-Akt inactivation in estrogen receptor-negative human breast cancer cells. Breast Cancer Res. 2014, 16, 431–439. 10.1186/s13058-014-0431-9. [DOI] [PMC free article] [PubMed] [Google Scholar]
- Zheng A.; Kallio A.; Harkonen P. Tamoxifen-induced rapid death of MCF-7 breast cancer cells is mediated via extracellulary signal-regulated kinase signaling and can be abrogated by estrogen. Endocrinology 2007, 148, 2764. 10.1210/en.2006-1269. [DOI] [PubMed] [Google Scholar]
- Björnström L.; Sjöberg M. Mechanisms of estrogen receptor signaling: Convergence of genomic and nongenomic actions on target genes. Mol. Endocrinol. 2005, 19, 833–842. 10.1210/me.2004-0486. [DOI] [PubMed] [Google Scholar]
- Sinha B. K.; Mimnaugh E. G.; Rajagopalan S.; Myers C. E. Adriamycin activation and oxygen free-radical formation in human-breast tumor-cells - protective role of glutathione-peroxidase in adriamycin resistance. Cancer Res. 1989, 49, 3844–3848. [PubMed] [Google Scholar]
- Pilco-Ferreto N.; Calaf G. M. Influence of doxorubicin on apoptosis and oxidative stress in breast cancer cell lines. Int. J. Oncol. 2016, 49, 753–762. 10.3892/ijo.2016.3558. [DOI] [PubMed] [Google Scholar]
- Manna S.; Holz M. K. Tamoxifen action in ER-negative breast cancer. Signal Transduction Insights 2016, 5, STI.S29901. 10.4137/sti.s29901. [DOI] [PMC free article] [PubMed] [Google Scholar]
- Kallio A.; Zheng A.; Dahllund J.; Heiskanen K. M.; Härkönen P. Role of mitochondria in tamoxifen-induced rapid death of MCF-7 breast cancer cells. Apoptosis 2005, 10, 1395–1410. 10.1007/s10495-005-2137-z. [DOI] [PubMed] [Google Scholar]
- Yang F.; Teves S. S.; Kemp C. J.; Henikoff S. Doxorubicin, DNA torsion, and chromatin dynamics. Biochim. Biophys. Acta, Rev. Cancer 2014, 1845, 84–89. 10.1016/j.bbcan.2013.12.002. [DOI] [PMC free article] [PubMed] [Google Scholar]
- Bar-On O.; Shapira M.; Hershko D. D. Differential effects of doxorubicin treatment on cell cycle arrest and Skp2 expression in breast cancer cells. Anti-Cancer Drugs 2007, 18, 1113–1121. 10.1097/cad.0b013e3282ef4571. [DOI] [PubMed] [Google Scholar]
- Taymaz-Nikerel H.; Karabekmez M. E.; Eraslan S.; Kırdar B. Doxorubicin induces an extensive transcriptional and metabolic rewiring in yeast cells. Sci. Rep. 2018, 8, 13672. 10.1038/s41598-018-31939-9. [DOI] [PMC free article] [PubMed] [Google Scholar]
- Mosmann T. Rapid colorimetric assay for cellular growth and survival: application to proliferation and cytotoxicity assays. J. Immunol. Methods 1983, 65, 55–63. 10.1016/0022-1759(83)90303-4. [DOI] [PubMed] [Google Scholar]
- Jarvis R. M.; Broadhurst D.; Johnson H.; O’boyle N. M.; Goodacre R. PYCHEM: a multivariate analysis package for python. Bioinformatics 2006, 22, 2565–2566. 10.1093/bioinformatics/btl416. [DOI] [PubMed] [Google Scholar]
- Chan K. L. A.; Fale P. L.. Label-free optical imaging of live cells. Biophotonics for Medical Applications; Elsevier, 2015; pp 215–241. [Google Scholar]
Associated Data
This section collects any data citations, data availability statements, or supplementary materials included in this article.


