

Abstract

At present, a few chemicals can be separated after further processing of high-temperature coal tar (HTCT) distillates, which have a lower utilization. However, hydrogenation to produce clean fuel oil has not been widely reported in literature. Thus, due to the use of new feedstocks and the implementation of more severe environmental legislations, deep hydrodesulfurization (HDS) of HTCT will face formidable challenges. A series of HDS experiments were performed in a continuous isothermal trickle bed reactor in which the reactor temperature was varied from 648 to 678 K, the pressure from 12 to 16 MPa, and the liquid hourly space velocity (LHSV) from 0.25 to 0.35 h–1, and hydrogen-to-oil ratio kept constant at 2000 L/L. Based on the experimental data, possible reaction pathways of HDS reaction were investigated, and a modified Langmuir–Hinshelwood (LH) HTCT desulfurization kinetic model was established. gPROMS software was used to obtain optimal kinetic parameters that are as follows: EA = 26,842, K0 = 93,958, α = −1.14, n = 1.65, and m = 0.86. The model can well reproduce various working conditions and has better prediction accuracy. Some characteristics of HTCT HDS reactions were discovered; the reaction order (n) of HTCT HDS is slightly higher than that of crude oil and medium/low-temperature coal tar (M/LTCT), but the activation energy (EA) is relatively smaller. The established reactor model was used to predict the changes of the concentration of hydrogen, hydrogen sulfide, and sulfur compounds in the gas, liquid, and solid phases along the length of the reactor, respectively. The model was also used to predict the effects of pressure, temperature, and LHSV on the conversion rate of sulfur and catalyst effectiveness factors. The results showed that the LHSV has a greater impact on the conversion rate, and the pressure and temperature are less pronounced at high-severity operating conditions; the effectiveness factor is significantly smaller than that of other HDS processes, temperature has a greater effect on the effectiveness factor, followed by pressure and LHSV. The conclusion can provide a basis for further understanding the HTCT hydrotreating process.
1. Introduction
Coal tar is obtained mainly from the process of coal gasification and carbonization, its output accounts for 2.5–10.0 mass % of coal feed, and over 21 million tons of coal tar are produced within China in 2018. High-temperature coal tar (HTCT) accounts for 80% of total coal tar production, produced by coal pyrolysis at a temperature range of 1173–1373 K, a black viscous liquid at normal temperatures, which belongs to heavy oil, with a complex mixture composed of thousands of aromatics and asphaltene content.1
In China, HTCT is usually separated into crude products such as light oil, phenol oil, naphthalene oil, washing oil, anthracene oil, and asphalt, and only a small part is further separated to obtain chemical products such as naphthalene, anthracene, and fluorene. HTCT processing equipment is generally scattered, small in scale, high in energy consumption, and seriously pollutes the environments, which resulted in lower HTCT utilization. The volume fraction of hydrogen in the coal pyrolysis coke oven gas is about 55%. Hydrogen can be obtained from coke oven gas with a purity of more than 99% through pressure swing adsorption technology. It is an inexpensive hydrogen source and can provide raw materials for the hydrotreating of HTCT. Therefore, hydrotreating of HTCT to produce ultralow heteroatom clean transportation fuels has better environmental and economic benefits.2 At present, only some scholars3−5 have conducted research on the hydro-upgrading of HTCT and distillate oil (anthracene oil) to obtain the light oils (gasoline and diesel). However, the kinetic mechanism of HTCT hydrogenation is still unclear. Due to the implementation of more severe environmental legislations, deep hydrodesulfurization (HDS) of HTCT will face huge challenges.
Studies on the kinetics of desulfurization compounds and other impurities have a crucial impact on the optimization of HDS, hydrodenitrogenation (HDN), and hydrodeoxygenation (HDO) process parameters and catalyst selection.6 The kinetic model is the basis for the establishment of the reactor model. At present, the research on the kinetics of coal tar hydrogenation is mainly concentrated on the medium- and low-temperature coal tar (M/LTCT), the research reports on the kinetics of HTCT hydrogenation are limited. Dai et al.7,8 established an eight-lumped kinetic model of medium-temperature coal tar and applied the model to the prediction of product yield changes. Zhu et al.9 established a low-temperature coal tar (LTCT) HDO dynamic model based on the power-law model, and the model was validated by effective experiments. Niu et al.10 established HDS and HDN kinetic models of 633 K fore-distillate LTCT to predict the sulfur and nitrogen concentration in the product, and they verified the accuracy of the model. Feng et al.11,12 established kinetic models for HDS and HDN of whole-fraction LTCT containing catalyst deactivation factors, and they verified the accuracy of the model through experiments.
The performance of the hydrotreating unit is greatly affected by the catalysts, reactor type, process flow, and operating parameters.13 To understand the behavior of the hydrotreating process deeply, a reliable reactor model must be established to further simulate, optimize, and design the process. Korsten and Hoffman14 proposed a three-phase heterogeneous model of vacuum gas oil (VGO) HDS for the performance analysis of the pilot plant trickle bed reactor (TBR). This model was based on the two-film theory, and it takes into account the mass transfer phenomenon at the gas–liquid and liquid–solid interfaces. The model of the chemical reaction rate is based on the Langmuir–Hinsherwood (LH) reaction mechanism. The variation of the reactant sulfur and product along the length of the reactor was simulated. Jarullah et al.15 reported the HDS of crude oil and used an optimization technique (the minimum error of the sum of squared experimental and predicted value (SSE) method) to obtain the optimal kinetic parameter values for the TBR experiments of pilot plants. A steady-state heterogeneous model was established, and gPROMS software was used to simulate HDS. Jiménez et al.16 used the steady-state one-dimensional heterogeneous TBR model to predict the product quality of VGO during hydrotreatment (HDT) based on the data obtained from the pilot plant. Murali et al.17 developed a one-dimensional heterogeneous model to simulate the performance and product quality of laboratory and commercial-scale diesel HDT reactors. Feng et al.12 modified the reaction rate equation, established a three-phase heterogeneous model for HDS of whole fraction LTCT, studied the effects of various reaction conditions on HDS, and predicted hydrogen sulfide and sulfur concentration changes in gas, liquid, and solid phases. However, the development and application of the reactor model are mainly focused on crude oil or M/LTCT systems, and a few studies have been conducted on HTCT.
HTCT has high viscosity and density, high sulfur and nitrogen content, large hydrocarbon ratio, and high gum and asphaltene content, and also it is easy to condense to produce coke. In the composition of the distillates, the content of the distillate is lower before 633 K (accounts for about 35% of the total volume), and the content of distillate is higher after 633 K. Hence, hydrogenation to produce clean fuel oil is more difficult. As mentioned previously, the published literature on experimental research and reactor simulation of HTCT HDS reaction is not abundant. Our research team has been carried out a lot of research on the technology of hydrogenation of whole-fraction LTCT to produce fuel oil in the early stage, and we achieved certain results in terms of catalyst grading, optimization of operating conditions, and kinetic simulation.9,11,12,18−22 This prompted us to tentatively propose to hydrotreat HTCT to produce clean fuel oil. Based on the hydrogenation test data, the HDS reaction mechanism was investigated, and nonlinear regression methods were used to obtain optimal kinetic parameters. The kinetic and steady-state isothermal three-phase TBR models of HDS reaction for HTCT were established. They were used to predicting the pressure and concentration changes of various compounds (reactants and products) along the catalyst bed and investigate the effect of reaction conditions on the effectiveness factor. Some interesting characteristics of the HTCT system were discussed and analyzed. All the modeling and simulation tasks in the paper were completed by using gPROMS software.
2. Experimental Work
2.1. Feed Stock
An HTCT sample from a coking plant in Shanxi was collected. The physical and chemical properties are listed in Table 1, which show that the HTCT has a high content of resin and asphaltene and low H/C atom ratio. It is rich in polycyclic aromatic hydrocarbons. Sulfur-containing heteroatoms are mainly concentrated in resin and asphaltene. The purpose of this work is to explore a process that can efficiently process HTCT (deep vacuum distillation by 60% volume) and to improve the utilization of HTCT.
Table 1. Physical and Chemical Properties of HTCT.
| property | unit | whole fraction HTCT | 60% distillation |
|---|---|---|---|
| carbon | wt % | 90.3 | 88.42 |
| density (293 K) | g/mL | 1.174 | 1.09 |
| hydrogen | wt % | 5.12 | 8.23 |
| sulfur | wt % | 0.64 | 0.46 |
| nitrogen | wt % | 0.92 | 0.68 |
| oxygen | wt % | 3.02 | 2.21 |
| viscosity (323 K) | mm2s–1 | 13.92 | 10.56 |
| atomic H/C ratio | 0.68 | 1.13 | |
| Conradson carbon residue | wt % | 8.76 | 6.24 |
| ash | wt % | 0.04 | 0.02 |
| Fe | μg/g | 25.56 | 22.12 |
| Ca | μg/g | 12.14 | 10.06 |
| Na | μg/g | 9.78 | 8.32 |
| Ni | μg/g | 0.42 | 0.26 |
| V | μg/g | 0.37 | 0.21 |
| SARA analysis | |||
| saturated hydrocarbon | wt % | 0 | 0 |
| aromatic hydrocarbon | wt % | 27.33 | 49.06 |
| resin | wt % | 35.27 | 23.13 |
| asphaltene | wt % | 37.46 | 27.81 |
| Range of boiling points | |||
| initial boiling point (IBP) | K | 444 | 402 |
| 30%/50% | K | 591/678 | 533/592 |
| 70%/90% | K | 770/838 | 633/728 |
| 95% final boiling point (FBP) | K | 857/ | 769/781 |
| Sulfur in SARA fractions | |||
| aromatic hydrocarbon | wt % | 0.33 | 0.25 |
| resin | wt % | 0.68 | 0.58 |
| asphaltene | wt % | 0.82 | 0.73 |
2.2. Catalyst Properties
The HDS catalyst used in this study is a commercially sample of NiMo/Al2O3-SiO2, which have the shape of tri-lobular with the following composition as follows: 21.76 wt % MoO3, 6.38 wt % NiO, and 2.58 wt % P2O5; its physicochemical properties have been reported in previous work.12,20,23 The catalyst was crushed and sieved to reach the required average particle size of 1.6 mm with the BET surface area of 217 m2/g and the pore volume of 0.45 cm3/g.
2.3. Pilot Plant
The pilot-scale hydrogenation reaction system is shown in Figure 1. The device consists of three parallel fixed-bed reactors (150 mL × 3) with an outer diameter of 45 mm, an inner diameter of 29 mm, and a static constant temperature zone of 300 mm. HTCT and hydrogen flow down and react in the reactor. Each reactor is provided with independent liquid, gas, and product receiving facilities. The reactor is wrapped in a common heating shell. The heating shell is divided into three areas, in turn from top to bottom: a preheating zone, heating zone, and post-heating zone. Each reactor is equipped with three thermocouples, which are contained in a thermocouple sleeve that is axially arranged along the inner centerline of the reactor tube. In each test run, the three reactors were filled with catalysts and operated under the same operating conditions to evaluate the repeatability of the test results. HDS experiments were performed under steady-state operation of the device. In the first reactor, 270 mL of porcelain balls, 100 mL of hydrogenation protection (HP) catalyst, and 178 mL of porcelain balls were charged from top to bottom. Then, in the other two reactors, 220 mL of porcelain balls, 150 mL of HDT catalyst, and 178 mL of porcelain balls were filled uniformly from top to bottom. The total amount of catalyst in the three reactors was 400 mL.
Figure 1.

Schematic diagram of the pilot scale plant reactor.
2.4. Pilot Plant Test Procedure
The catalyst was loaded into a reactor, which was assembled and connected to a test unit. First, the device was leak tested with nitrogen at a pressure higher than the target operating pressure of 16 MPa and again tested with 16 MPa of hydrogen. When the device was confirmed to be safe to operate, the hydrogen pressure was dropped to 8 MPa, and the hydrogen flow rate was maintained at 320 L/h. The reactor temperature was increased from the ambient temperature to 443 K at a rate of 10 K/h. A presulfurized oil composed of 2% CS2 and 98% (by volume) hydrogenated diesel was pumped into the reactor at a rate of 400 mL/h for presulfidation. Then, the reactor temperature was increased to 503 K, the operating conditions were maintained at 503 K for 4 h, and then the reactor temperature was increased to 543 and 633 K, respectively. At 543 and 633 K, the operating conditions were fixed at 6 and 8 h, respectively, and detecting the H2S concentration to ensure that the catalyst completely presulfided was performed.
In all cases, fresh hydrogen passes through the reactor at one time, the operating conditions are as follows: reaction temperatures of 648, 663, and 678 K; LHSVs of 0.25, 0.3, and 0.35 h–1; reaction pressures of 12, 14, and 16 MPa; and the hydrogen-to-oil ratio of 2000:1. Under each hydrogenation condition, product samples were collected every 4–8 h after a stabilization period of 4 h. The sulfur content in the product was determined by an infrared absorption method after induction furnace combustion (TSN-2000, Jiangsu Jiangfen Electric Analysis Instrument Co., Ltd.). The chemical composition of the feedstocks and the hydrogenation products were measured by gas chromatography–mass spectroscopy (GCMS-QP2010 Plus, Shimadzu).
3. Modeling Methodology
3.1. Hydrodesulfurization
In HTCT, sulfur and hydrocarbon molecules combine to form sulfur-containing compounds with different structures, such as benzothiophene, dibenzothiophene, etc. Sulfur exists in different three components, namely, aromatic hydrocarbons, resins, and asphaltenes. The desulfurization reactions of aromatic hydrocarbons, resin, and asphaltenes are more complicated, which include several consecutive and parallel reaction steps, including dehydrogenation, cracking, hydrogenation reaction, and then desulfurization. In practice, it is very difficult to separately model all the HDS reactions of sulfur-containing compounds. All sulfur compounds are usually normalized and considered as a single reaction in the study of desulfurization reaction kinetics.14,24,25 This paper assumes the following generalized desulfurization reactions
| 1 |
R-S is a sulfur-containing hydrocarbon, H2 is hydrogen, R-H is a sulfur-free hydrocarbon, and H2S is hydrogen sulfide. This reaction is considered to be the most basic, and the stoichiometric coefficient is shown in eq 1.
3.2. Simulation of Bench-Scale Unit
This article constructed a gas–liquid–solid three-phase plug flow reactor model based on a well-known foreign TBR model.14,26 The reaction was carried out in a trickle regime. This model was based on the two-phase membrane theory, which considered mass transfer at the gas–liquid and liquid–solid interfaces. Considering the effect of hydrogen sulfide on HDS, the Langmuir–Hinshelwood (LH)-type rate equation was used to describe the power-law-dependent HDS reaction of sulfur (m) and hydrogen (n).
Under normal operating conditions, the HDS reaction is irreversible.27 In addition, the pilot reactor is operated in the isothermal mode with a constant temperature along the length of the catalyst bed. Therefore, the differential equation of thermal equilibrium can be ignored. This paper combines the mass transfer equation, reaction kinetic equation, and empirical correlations to establish a HDS TBR model. Table 2 lists the main equations (mass transfer equation and reaction rate equation). The correlations14,28 (as shown in Table S1) were used to estimate the properties of gases and liquids, including solubility, diffusion coefficient, and mass transfer coefficient under process conditions. Table 3 shows the calculated mass-transfer coefficients with the pressure of 14 MPa, the temperature of 648 K, and the LHSV of 0.3 h–1. When establishing the gas–solid–liquid three-phase mass balance equation, to quickly and accurately calculate the results, it can be assumed that the one-dimensional, steady-state hydrogenation reactor operates at the following simplified conditions.
-
(1)
The velocity of gas and liquid passing through the reactor is constant.
-
(2)
No reaction in the gas phase.
-
(3)
The reaction pressure is constant.
-
(4)
It is surface reaction in mass transfer, the reaction only occurs on the catalyst surface.
-
(5)
No change in catalyst activity.
-
(6)
Due to the negligible evaporation of HTCT under HDS conditions, organic sulfur can be considered nonvolatile.
Table 2. Hydrogenation Reactor Model Equation and Boundary Conditions14,24,25,29.
| mass balance equation | formula |
|---|---|
| gaseous compounds (i = H2, H2S) |  |
| gaseous compounds in liquid phase (i = H2, H2S) |  |
| organic sulfur in liquid phase |  |
| consumption or production by chemical reaction for H2, H2S, and organic sulfur | kH2SaS(CH2 – CH2S) = ρBηHDSrHDSkH2SaS(CH2SL – CH2S) = – ρBηHDSrHDSksulSaS(Csul – CsulS) = ρBηHDSrHDS |
| boundary conditions | CH2L(z = 0) = CH2(initial) CH2SL(z = 0) = 0 Csul(z = 0) = CsulL(initial) PH2(z = 0) = PH2G(initial) PH2S(z = 0) = 0 |
| Chemical reaction rates equations | |
| HDS |  |
 | |
Table 3. Mass-Transfer Coefficients for Pilot Plant-Scale TBR.
| pressure (MPa) | 14 |
| reaction temperature (K) | 648 |
| LHSV (h–1) | 0.3 |
| H2/oil ratio (L/L) | 2000 |
| catalytic bed length (cm) | 50 |
| reactor diameter (cm) | 2.9 |
| liquid mass velocity (GL, g/cm2·s) | 3 × 10⁻² |
| superficial liquid velocity (uL, cm/s) | 4 × 10⁻³ |
| superficial gas velocity (ug, cm/s) | 8 |
| diffusivity of S compounds (DSl, cm2/s) | 3.8 × 10⁻⁴ |
| diffusivity of H2 (DH2l, cm2/s) | 3.21 × 10⁻⁴ |
| diffusivity of H2S (DH2Sl, cm2/s) | 2.66 × 10⁻⁴ |
| gas–liquid mass transfer for H2 (kH2lal, s–1) | 1.43 × 10⁻² |
| gas–liquid mass transfer for H2S (kH2lal, s–1) | 1.3 × 10⁻² |
| liquid–solid mass transfer for S (kSSaS, s–1) | 1.9 × 10⁻² |
| liquid–solid mass transfer for H2 (kH2SaS, s–1 | 1.69 × 10⁻² |
| liquid–solid mass transfer for H2S (kH2SSaS, s–1) | 1.49 × 10⁻² |
3.3. Characteristics of the Catalyst Bed
For the tri-lobular type catalyst, the catalyst surface area per unit volume bed can be estimated from eq 2(30)
| 2 |
| 3 |
The porosity of the catalyst bed also determines the contact between the bed and reaction medium. Porosity is estimated by eq 4(31)
| 4 |
3.4. Effectiveness Factor
Chemical reactions occur not only on the catalyst surface but also on the inner walls of the catalyst channels. Due to the complexity of the catalyst pores, there will be limitations to internal diffusion. The internal diffusion limitations are usually expressed in terms of the catalyst effectiveness factor. Due to the small size of the catalyst particles used in this study, the effectiveness factor of the HDS reaction of irregular catalysts can be calculated by the Thiele Modulus32,33
| 5 |
For n order irreversible HDS reaction, the Thiele Modulus can be described by eq 6(29,34)
| 6 |
The effective diffusion coefficient (Desul) is determined by the following equation33,35
| 7 |
Diffusion coefficient of sulfur in liquid phase DsulL and Knudsen diffusion are DK(30)
| 8 |
| 9 |
According to the experimental data of specific surface area (Sg), total pore volume (Vg), and catalyst density (ρp), the porosity (θ) and average pore diameter (rg) of the catalyst are calculated. In general, the value of the tortuosity factor is 2–7. Usually, it is assumed to be 4 according the literature reports11,25,31,34
| 10 |
| 11 |
| 12 |
| 13 |
| 14 |
| 15 |
| 16 |
| 17 |
| 18 |
| 19 |
4. Results and Discussions
4.1. HDS Chemical Reaction
The HDS of sulfur-containing compounds in real feedstock is far more complicated than the HDS of pure substances. Over the years, a large number of studies have been undertaken with model sulfur compounds.36−38 These studies provide interesting insights into the kinetics/mechanisms of desulfurization. Herein, based on model sulfur compounds research, this section will briefly discuss the possible reaction pathway of real HTCT feedstock HDS. The possible HDS reaction pathways for HTCT can be deduced based on the main sulfur-containing compounds, chemical composition of feedstocks, and products (as shown in Tables S2 and S3), which can be quantitatively identified by gas chromatography–mass spectroscopy. The products were obtained from hydrotreating the feedstocks at a reaction pressure of 16 MPa, a temperature of 663 K, an LHSV of 0.25 h–1, and a hydrogen-to-oil ratio of 2000: 1. It can be observed that benzothiophene, dibenzothiophene, and benzo[b]naphtho[2,3-d]thiophene are the main types of sulfur compounds in HTCT. They accounted for 41.7, 38.36, and 13.8% of the total sulfur, respectively, while other sulfur-containing compounds such as phenaleno[1,9-bc]thiophene, 3-methylbenzothiophene, and 1-methyldibenzothiophene were present in relatively smaller concentrations. On the basis of model sulfur compound studies, it is now established that desulfurization in HTCT performs desulfurization by direct hydrogenolysis (DDS) or hydrogenation (HYD). In the direct hydrogenolysis pathway, only a single-hydrogenolysis step occurs in the removal of sulfur. On the other hand, the hydrogenation pathway involves the hydrogenation of the aromatic ring of the sulfur compounds before the hydrogenolysis step.36−38
Generally, hydrogenation of benzothiophene will produce styrene, ethylbenzene, and ethylcyclohexane.39 However, styrene was not detected in the products, and the products contain ethylbenzene and ethylcyclohexane, which account for 1.943 and 1.942%, respectively. According to the product distribution, it can be inferred that desulfurization of benzothiophene mainly takes place through two pathways38 (as shown in Figure 2). The first is the DDS pathway. The C–S bond in benzothiophene may directly hydrolyze and desulfurize to form ethylbenzene, and then it may further hydrogenate to produce other products, such as ethylcyclohexane; the second is the HYD pathway where the aromatic ring in benzothiophene may be first hydrogenated to generate a partial hydrogenation or perhydrogen products and followed by the hydrogenolysis of the C–S bond to generate ethylcyclohexane.
Figure 2.

Possible reaction pathways for benzothiophene.
Large amounts of cyclohexylbenzene (CHB) and dicyclohexyl (DCH) were detected in the products, which account for 1.16 and 3.08%, respectively. Therefore, dibenzothiophene (DBT) HDS can be considered to react through two routes (as shown in Figure 3), one is the DDS route, and BP (biphenyl) is produced by the hydrogenolysis of the C–S bond; the other one is the HYD pathway in which the aromatic ring of the DBT compound is preferentially hydrogenated to the 4H-intermediate and then desulfurized to CHB by the C–S bond hydrogenolysis.40 The HDS of DBT is generally carried out through the DDS route. Due to the high hydrogenation activity of the Ni-Mo catalyst, there is almost no biphenyl (BP) in the products, meaning that the conversion of BP to CHB is usually fast. These results are in agreement with the results published in the literature.41
Figure 3.

Possible reaction pathways for dibenzothiophene.
Benzonaphthothiophene is the heaviest organic sulfur compound investigated. The hydrogenation of benzonaphthothiophene can form two types of saturated intermediates as follows: (1) a sulfur compound containing a saturated ring adjacent to a sulfur atom and (2) a sulfur compound containing a saturated ring far from the sulfur atom. The hydrogenolysis of the former compound is significantly higher because of the higher electron density on the sulfur atom of the compound.42 2-Phenyltetralin and 6-phenyltetralin were detected in the products, which account for 0.12 and 0.09%, respectively. Hence, as shown in Figure 4, the reaction rate of hydrogenolysis of sulfur compounds is rapid.38 Benzo[b]naphthalene[2,3-d]-thiophene can be considered to be DDS to obtain 2-phenylnaphthalene and then hydrogenated again to obtain 2-phenyltetralin and 6-phenyltetralin.43 On the other hand, two intermediates are formed by HYD, followed by further hydrogenolysis to obtain 2-phenyltetralin and 6-phenyltetralin.
Figure 4.

Possible reaction pathways for benzonaphthothiophene.
Compared with low-boiling-point petroleum distillates and light coal tars, deep vacuum distillation HTCT contains a small amount of macromolecular compounds (such as benzonaphthothiophene and phenaleno[1,9-bc]thiophene) and hard-to-remove sulfur compounds (such as 3-methylbenzothiophene and 1-methyldibenzothiophene), which have several side alkyl carbon chains attached to them, these molecules have considerable steric hindrance for sulfur removal.42,44 Although the above studies provide interesting information on the HDS reaction pathway for HTCT, there are still some hard-to-remove macromolecular compounds that are not detected, resulting in the HDS information that is quite incomplete. From the product viewpoint, under this hydrotreating process condition, sulfur-containing compounds with a content of more than 0.025% no longer exist. It can be considered that most of the sulfur compounds are removed. Therefore, the content of hard-to-remove sulfur species in these feedstocks can be used to represent the properties of the feedstocks to some certain extent.
4.2. Parameter Estimation
Optimization techniques were used for parameter estimation to minimize the sum of squared differences between experimental and calculated values.45 Among them, nonlinear (NLN) optimization was the most popular method, which was widely used to estimate the best value of chemical process kinetic parameters. For hydroprocessing, the Levenberg–Marquardt and SQP methods are particularly suitable.26,46,47 Using the three-phase TBR model established in this article, based on the squared error (SSE) minimization as the objective function (eq 20), the optimal value kinetic parameters (pre-exponential K0, reaction order n, pressure index m, LHSV index α, and activation energy EA) were estimated from experimental data.
| 20 |
(Csul, i)exp and (Csul, i)cal are respectively experimental and calculated concentration values of sulfur compounds, respectively.
Table 4 presents the experimental and model prediction data of HTCT desulfurization. It can be seen that the absolute errors between the predicted and experimental values of the HDS are within 5%, indicating that the model has high prediction accuracy. During the experimental verification work under the conditions, the absolute error can also be controlled within 5%. Therefore, the pilot reactor model was proved to be reliable.
Table 4. Experimental and Predicted Data.
| LHSV (h–1) | pressure (MPa) | temperature (K) | inlet Wisul (μg/g) | experiment outlet Wesul (μg/g) | conversion (%) | simulation outlet Wssul (μg/g) | conversion (%) | absolute error (%) (Wssul – Wesul) / Wesul |
|---|---|---|---|---|---|---|---|---|
| 0.25 | 12 | 648 | 4600 | 129.08 | 97.19 | 131.30 | 97.15 | 1.72 |
| 0.3 | 12 | 648 | 4600 | 385.56 | 91.62 | 389.62 | 91.53 | 1.05 |
| 0.35 | 12 | 648 | 4600 | 939.32 | 79.58 | 936.37 | 79.64 | 0.31 |
| 0.25 | 12 | 663 | 4600 | 105.58 | 97.70 | 49.70 | 98.92 | 3.27 |
| 0.3 | 12 | 663 | 4600 | 305.82 | 93.35 | 307.36 | 93.32 | 0.51 |
| 0.35 | 12 | 663 | 4600 | 584.05 | 87.30 | 563.24 | 87.76 | 3.56 |
| 0.25 | 12 | 678 | 4600 | 86.75 | 98.11 | 90.84 | 98.03 | 4.71 |
| 0.3 | 12 | 678 | 4600 | 173.88 | 96.22 | 164.40 | 96.43 | 5.45 |
| 0.35 | 12 | 678 | 4600 | 346.88 | 92.46 | 346.39 | 92.47 | 0.14 |
| 0.25 | 14 | 648 | 4600 | 59.82 | 98.70 | 56.86 | 98.76 | 4.95 |
| 0.3 | 14 | 648 | 4600 | 112.75 | 97.55 | 110.10 | 97.61 | 2.35 |
| 0.35 | 14 | 648 | 4600 | 186.35 | 95.95 | 179.11 | 96.11 | 3.88 |
| 0.25 | 14 | 663 | 4600 | 37.32 | 99.19 | 35.59 | 99.23 | 4.64 |
| 0.3 | 14 | 663 | 4600 | 104.53 | 97.73 | 102.73 | 97.77 | 1.73 |
| 0.35 | 14 | 663 | 4600 | 150.26 | 96.73 | 155.51 | 96.62 | 3.49 |
| 0.25 | 14 | 678 | 4600 | 20.55 | 99.55 | 19.63 | 99.57 | 4.48 |
| 0.3 | 14 | 678 | 4600 | 81.82 | 98.22 | 85.29 | 98.15 | 4.24 |
| 0.35 | 14 | 678 | 4600 | 107.73 | 97.66 | 104.70 | 97.72 | 2.81 |
| 0.25 | 16 | 648 | 4600 | 51.11 | 98.89 | 51.65 | 98.88 | 1.05 |
| 0.3 | 16 | 648 | 4600 | 60.08 | 98.69 | 62.07 | 98.65 | 3.31 |
| 0.35 | 16 | 648 | 4600 | 62.04 | 98.65 | 64.45 | 98.60 | 3.88 |
| 0.25 | 16 | 663 | 4600 | 24.06 | 99.48 | 23.62 | 99.49 | 1.84 |
| 0.3 | 16 | 663 | 4600 | 31.03 | 99.33 | 32.54 | 99.29 | 4.86 |
| 0.35 | 16 | 663 | 4600 | 61.32 | 98.67 | 63.63 | 98.62 | 3.76 |
| 0.25 | 16 | 678 | 4600 | 14.13 | 99.69 | 14.83 | 99.68 | 4.96 |
| 0.3 | 16 | 678 | 4600 | 29.54 | 99.36 | 29.51 | 99.36 | 0.12 |
| 0.35 | 16 | 678 | 4600 | 58.02 | 98.74 | 55.93 | 98.78 | 3.60 |
| Model prediction | ||||||||
| 0.28 | 12 | 678 | 4600 | 92.68 | 97.99 | 94.48 | 97.95 | 1.94 |
| 0.28 | 13 | 671 | 4600 | 64.16 | 98.61 | 67.28 | 98.54 | 4.87 |
| 0.32 | 14 | 663 | 4600 | 117.46 | 97.45 | 115.72 | 97.48 | 1.48 |
| 0.35 | 15 | 656 | 4600 | 57.43 | 98.75 | 57.52 | 98.75 | 0.16 |
HDS reactivity depends on the types of sulfur compounds, especially on the most refractory ones. The same types of sulfur-containing compounds (such as benzothiophene, dibenzothiophene, and their alkyl derivatives) follow different HDS pathways. In practical operation, it was difficult to precisely determine the exact mass and quantity of each molecule, which is the obstacle for studying the intrinsic activity of HTCT. Thus, the catalyst activity can be quantified by the determined apparent kinetic parameters (reaction order and activation energy). This method was simple and useful due to its simplicity, which can be widely used in the selection and optimization of HTCT catalysts. Table 5 shows the estimated kinetic parameters.
Table 5. Estimated Kinetic Parameter.
| Ko | EA | α | m | n |
|---|---|---|---|---|
| 93,958 | 26,842 | –1.12 | 0.86 | 1.65 |
Many literatures have reported the HDS reaction process of different distillates. The sulfur order of the HDS reaction follows the first-order to second-order rules.26,49 The value of the reaction order for hydrogen is between zero and one.50,51 Hence, the reaction orders (n and m) obtained in this article is in the range in these literatures reported.
The sulfur-containing compounds of HTCT were mainly distributed in aromatics and polar substances, mainly, benzothiophenes, dibenzothiophenes, benzonaphthothiophenes, and unknown pentacyclic sulfur aromatic compounds, etc. Of which dibenzothiophene, naphthobenzothiophene, and unknown sulfur-containing were hard to remove.52,53 Studies show that the value of the HDS reaction order n depends on the type and distribution of sulfur compounds in the feedstock.54 Sulfur in HTCT has a variety of physicochemical and reaction characteristics in different chemical environments. Although different reactions have different reaction rate coefficients, the reaction order is a reflection of the sum of the contributions of the reactivity of each sulfur compound, which can reflect the overall reaction activity of the mixture. As can be seen from Table 6, although the sulfur content in this article is low, the HDS reaction order (n) is larger than those of crude oil, vacuum gas oil, and residual oil, which can be attributed to the large diversity and different concentrations of sulfur compounds in the raw materials and led to a large difference in reactivity.
Table 6. Comparison of Activation Energy and Reaction Order of HDS Reaction of Different Raw Materials and Reaction Conditions.
| literature | feed | sulfur content (%) | catalyst | activation energy (kJ/mol) | reaction order | reaction conditions |
|---|---|---|---|---|---|---|
| the present work | HTCT | 0.46 | Mo-Ni | 26.84 | 1.65 | 648–678 K,12–16 MPa, 0.25–0.35 h–1 |
| Feng et al.12 | LTCT | 0.36 | Mo-Ni | 94.97 | 1.5 | 613–673 K, 10–14 MPa, 0.2–0.4 h–1 |
| Niu et al.10 | LTCT | 0.64 | Co-Mo | 58.65 | 1.23 | 613–653 K,11–15 MPa, 0.2–0.4 h–1 |
| Murali et al.17 | diesel | 1.06 | Co-Mo | 17.18 | 1.64 | 633–673 K,6.8–9.4 MPa, 1.61 h–1 |
| Alvarez et al.26 | AR | 5.74 | 104.04 | 1.17 | 653–693 K, 9.8 MPa, 0.25–1.0 h–1 | |
| Jarullah et al.29 | Iraqi crude oil | 2.0 | Co-Mo | 50.264 | 1.15 | 698–723 K,15 MPa |
| Korsten et al.14 | VGO | 2.0 | Mo-Ni | 72.5 | 1 | 643 K, 10 MPa, 0.85 h–1 |
| Papayannakos et al.48 | Heavy oil | 5.3 | Co-Mo | 36.1 | 2.5 | 598–673 K, 3–10 MPa |
The reaction order (n) obtained in this research is higher than that of LTCT mainly because HTCT contains different types and concentrations of refractory compounds, has a relatively wide range of sulfur compounds, and has a high average boiling point and molecular weight, which agrees very well with those reported in the literature.55
Obviously, there is no relationship between the activation energy and reaction order. The activation energy of the hydroprocessing reaction is affected by factors such as the catalyst type, raw material reactivity, reactor structure, and operating conditions.56 Due to different raw materials, reaction conditions, and catalysts, the nature and reactivity of different types of sulfurs in different raw materials may lead to different rate-limiting steps and adsorption energy. The adsorption energy is affected by temperature and affects the reaction rate, thereby an influence on activation energy.57 The EA obtained in the literature is significantly higher than that obtained in this research. There are two reasons that account for it: on the one hand, due to its raw material being residue, which contains a large amount of asphaltene components with a large molecular weight. Moreover, some sulfur-containing compounds are wrapped in asphaltene molecules, which are extremely difficult to remove by hydrogenation; on the other hand, to achieve a high removal rate for deeply removing the sulfur compounds of the HTCT in this article (as shown in Table 4), harsh reaction conditions (higher reaction temperature and pressure, and lower LHSV) are needed, which are the main reason for the lower activation energy.
4.3. HDS Simulation of HTCT TBR
The reactor model established previously can be used to simulate the concentration distribution of reactants (hydrogen, sulfur compounds) and hydrogenation products (hydrogen sulfide) under various operating conditions, which are determined by the balance between reaction rate and mass transfer. The profiles were generated at a reaction pressure of 14 MPa, a temperature of 648 K, an LHSV of 0.3 h–1, and a hydrogen-to-oil ratio of 2000:1.
It is noted from Figure 5 that there was a certain concentration gradient of H2 in both liquid and solid phases. The concentration difference between the two phases increases initially and then decreases, and the hydrogen concentration in the liquid phase was always higher than that of the solid phase. The concentration in the two phases decreases rapidly along the length of the reactor to reach a certain value and then gradually increases and stabilizes. This phenomenon is caused by the differences in gas–liquid and solid–liquid interface mass transfer rates and reaction kinetics. At the upper catalyst layer (Z = 1–3 cm), due to the high sulfur concentration in the liquid phase, the chemical reaction rate is higher than the gas–liquid and liquid–solid phase mass transfer rate. A large amount of hydrogen on the catalyst surface is consumed, resulting in the concentration of H2 decreases sharply in both the liquid and solid phases. As the concentration difference increases, the driving force for mass transfer between the liquid and solid phases increases, so the mass transfer at the liquid–solid interface plays a dominant role, leading to the increment of the hydrogen concentration in the liquid and solid phases and then the concentration difference gradually decreased. The partial pressure of H2 gradually decreases down through the reactor, but not the much, it can be considered that the pressure has not changed.
Figure 5.

Concentration profiles of hydrogen down through the reactor.
Figure 6 shows that there is also a certain H2S concentration gradient in both liquid and solid phases. The concentration trend of H2S in two phases has the opposite behavior to that of H2, which was also confirmed by many reports in the literature.24,28 At the initial section of the reactor, the chemical reaction rate is higher than the mass transfer rate between the two phases; a large amount of hydrogen sulfide is generated and accumulated on the surface of the catalyst particles, resulting in a sharp increase in the H2S concentration in both phases. As the reactants move to a deeper bed, the reaction rate decreases with the decreased sulfur concentration in the liquid phase, and then the concentration difference between the two phases increases, the mass transfer of the solid–liquid is significant; thus, the H2S concentration falls up in both the solid and liquid phases. Due to the continuous accumulation of H2S in the gas phase, its partial pressure gradually increases down through the reactor.
Figure 6.

Concentration profiles of hydrogen sulfide down through the reactor.
As can be seen from Figure 7, the concentration of sulfur in the liquid phase and the solid phases gradually decreases along the length of the reactor, and there is a certain concentration difference, which gradually decreases. This is mainly because the sulfur concentration in the feedstock decreases along the length of the catalyst bed. At the initial section of the reactor, the sulfur in the liquid phase gradually enters to the solid surface in the form of diffusion to ensure the continuity of the reaction so that sulfur in the solid phase reacts to form a certain concentration gradient. However, through the hydrogenation of HTCT, physical and chemical properties (such as density, viscosity, mass rate, and heteroatom content) of the reactants change a lot, and the oil gradually becomes lighter, which strengthens the mass transfer rate of the liquid–solid and causes the sulfur concentration in the two phases to be approaching.
Figure 7.

Concentration profiles of sulfur down through the reactor.
4.4. Effect of Process Conditions on HDS
It can be found from Figure 8 that at the same bed position, the concentration of sulfur decreases, and hydrogen sulfide increases with the increased temperature in the liquid phase. Due to the diffusion coefficients, gas–liquid, solid–liquid mass transfer coefficients, the solubility, viscosity of the components, and density of hydrogen and hydrogen sulfide are all functions of temperature. Increasing the temperature will improve the diffusion of components, accelerating the mass transfer of gas–liquid and solid–liquid, just as decreasing the viscosity will help to increase the desulfurization reaction rate. In addition, increasing the temperature is conducive to the moderate catalytic cracking of large molecular compounds (resin, asphaltene) converted to small molecules in HTCT. In the early stage of the reaction (Z = 1–5 cm), due to the high sulfur concentration in the liquid phase, mass transfer in the liquid–solid phase plays a dominant role; the effect of temperature on sulfur conversion are not obvious. With the progress of the reaction, the sulfur concentration gradually decreased in the liquid phase, the temperature plays a leading role on the removal of sulfur (Z = 5–25 cm), and then it gradually disappeared mainly because there were still some refractory components near the reactor exit, such as dibenzothiophene and naphthobenzothiophene derivatives, which are difficult to remove.
Figure 8.
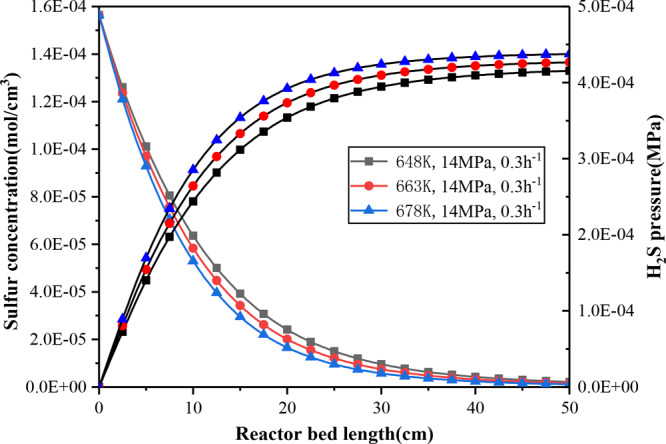
Sulfur concentration and hydrogen sulfide partial variation pressure at different temperatures down through the bed.
As can be seen from Figure 9, compared with temperature, the effect of pressure on the desulfurization conversion rate is not obvious. As the pressure increases, the concentration of sulfur in the liquid phase get reduced, which indicates that the conversion rate of sulfur increases. A power-law kinetic equation with a hydrogen pressure index of 0.86 is used to describe the kinetics of the HDS reaction; this means that the hydrogen pressure is positively to the reaction rate. The effect of pressure on the removal rate decreases with increasing pressure; it is attributed to the increased viscosity of the feed and the decreased diffusion coefficient and mass transfer coefficient as the pressure increases. The effect of pressure on the removal rate is not obvious (Z<5 cm) mainly because the increase in the reaction rate is offset by the side effect caused by the increase in pressure. With the progress of the reaction, the effect of pressure on the removal rate increased significantly. When Z > 30 cm, the effect of increasing pressure on the conversion rate is gradually eliminated mainly because the sulfur compounds remaining in the liquid phase are difficult to be removed at the end section of the reactor. The reaction pressure has a more significant effect on the H2S partial pressure, especially at (Z = 10–30 cm). However, when Z > 25 cm, the amount of H2S produced by the reaction begins to get reduced, while the H2S dissolved in the liquid phase gradually increases, and then the H2Spartial pressure increases slowly.
Figure 9.

Sulfur concentration and hydrogen sulfide partial pressure variation with pressure down through the bed.
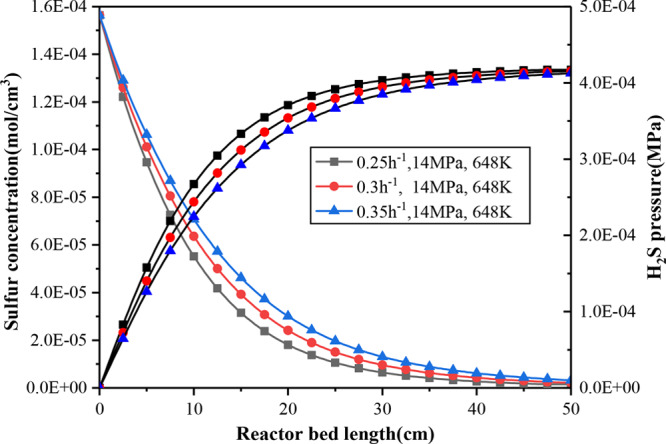
It can be observed from Figure 10 that the LHSV has a greater effect on the conversion of sulfur compared to temperature and pressure. Decreasing the LHSV is equivalent to reducing the liquid flow rate, which means that the residence time of the liquid on the catalyst surface increases; then the catalyst wetting efficiency increases, and the reactants can quickly enter the inner surface of the catalyst, which is conducive to the reaction rate leading to a higher conversion rate.29 LHSV has obvious influence on desulfurization on HDS in the range (Z = 1–20 cm). To achieve the same desulfurization efficiency, the required catalyst bed length is shorter at the lower LHSV.
Figure 10.
Sulfur concentration and hydrogen sulfide partial pressure variation with LHSV down through the bed.
4.5. HDS Effectiveness Factor
The internal diffusion of the catalyst particles mainly depends on the voids of the particles and the molecular size of the reactants. To compare the effects of different conditions on internal diffusion, the variation of the effectiveness factor with LHSV at different reaction temperatures and pressures are shown in Figure 11. The increase of temperature and LHSV and the decrease of pressure will reduce the effectiveness factor. The temperature has the greatest effect on the effectiveness factor, followed by the LHSV and the pressure. Under this condition, the HDS effectiveness factor is 0.11–0.26. Although the value is within the reported range (0.0057–1),29 it is still smaller than the others, as shown in Table 7. This is mainly attributed to the high reaction temperature, which has also been reported by Chang et al.58 in literature. It is not difficult to find that the effectiveness factor is still small even though the size of the catalyst is only 1.6mm, which is inconsistent with Marroquín’s report34 that the small size of the catalyst can limit internal diffusion and help improve the effectiveness factor. It may be due to the fact that when HDS of the HTCT in a small pilot device, although the catalyst contacts with the HTCT, a thick liquid film is formed on the surface, and all surfaces are uncompletely wetted, which means that most of the reaction occurs near the outer surface of the wet catalyst; the internal surface utilization of the catalyst is very low.59 The external wetting efficiency has a great influence on the effectiveness factor.
Figure 11.

Catalyst effectiveness vs LHSV at different pressure and temperature values.
Table 7. Desulfurization Effectiveness Factor under Different Catalyst Sizes and Reaction Conditions.
| reference | feed | catalyst | shape | equivalent diameter (mm) | effectiveness factor |
|---|---|---|---|---|---|
| present work | HTCT | Mo-Ni | tri-lobular | 1.6 | 0.11–0.26 |
| Feng et al.12 | LTCT | Mo-Ni | tri-lobular | 1.8–2.0 | 0.53–0.75 |
| Garroquín et al.34 | SRGO | Mo-Ni | tri-lobular | 2.5 | 0.40–0.55 |
| Novaes et al.35 | diesel | Mo-Ni | cylindrical | 1.7 | 0.20–0.64 |
| Jarullah et al.29 | Iraqi crude oil | Co-Mo | cylindrical | 1.8 | 0.47–0.64 |
It is generally believed that the internal diffusion coefficient of the components in the catalyst is positively related to the temperature; that is to say, an increase in reaction temperature causes an increment in effectiveness factor, but it is actually observed that the effectiveness factor decreases with increased temperature; these results were in agreement with the behavior published in the literature.12,35 There are two reasons that can be accounted for it. On the one hand, the Thiele Modulus increases with increased temperature; thus, the effectiveness factor decreases with the increased Thiele Modulus. On the other hand, the effectiveness factor mainly depends on the relative rates of the internal mass transfer and reaction. As the temperature increases, the reaction rate increases faster than the mass transfer rate, which means that the effect of temperature on the reaction rate coefficient is greater than diffusion.60 It can be also observed that the decrease of LHSV and the increase of reaction pressure can improve the effectiveness factor, but it is not large enough, which indicates that the dependence of internal diffusion on LHSV and pressure is not large enough. High LHSV means a large flow rate, resulting in a large number of reactants deposited on the catalyst surface, which increases the diffusion constraint. At different LHSV and pressures, small changes in the value of the effectiveness factor can be attributed to external diffusion.
5. Conclusions
Hydrotreating of HTCT to produce clean fuel oil has not been widely reported in the literature; thus, HDS will be a huge challenge work. This exploratory work performed a hydrogenation test on wide distillates (deep vacuum distillation 60% by volume) of HTCT in a TBR, deduced the possible HDS reaction pathways of the main sulfur-containing compounds in HTCT, and established a three-phase heterogeneous model to simulate HDS reactions. The model was proved to be reliable after experimental verification.
Under certain conditions, the sulfur conversion rate can reach 99%, indicating that the hydrogenation process can achieve the conversion of most sulfur compounds in resin and asphaltene macromolecules. LHSV has the greatest effect on the conversion of sulfur, followed by temperature and pressure.
The reaction order obtained in this research is higher than that of crude oil and M/LTCT, indicating that many types of sulfur compounds with wide distribution and high activity existed in the HTCT. Operating conditions such as higher reaction temperature, pressure, and LHSV can account for the lower activation energy.
Due to the different mass transfer properties at the gas–liquid and liquid–solid interfaces, the concentration of H2S on both the solid and liquid phases initially increases and then decreases, and the concentration of hydrogen have the opposite phenomenon. The partial pressure of H2S increases gradually along the length of the reactor. The concentration of sulfur compounds on both solid and liquid phases decreases along the length of the reactor.
Compared with pressure and LHSV, temperature has the most significant effect on the effectiveness factor. The effectiveness factor in the HDS reaction is only 0.11–0.26, which is generally smaller than that of crude oil and M/LTCT.
Acknowledgments
The financial supports of this work are provided by the National Natural Science Foundation of China (21978237), the Technology Innovation Leading Program of Shaanxi (program no. 2019CGHJ-11), the key Research and Development Program of Shaanxi (program no. 2018ZDXM-GY-161), the Key Scientific Research Plan (Key Laboratory) of Shaanxi Provincial Department of Education (program no. 17JS146).
Glossary
Nomenclature
- HTCT
high temperature coal tar
- MTCT
medium temperature coal tar
- LTCT
low temperature coal tar
- HP
hydroprotecting
- HDT
hydrotreatment
- HDS
hydrodesulfurization
- SRGO
straight run gas oil
- TBR
trickle bed reactor
- AR
atmospheric residue
- VGO
vacuum gas oil
- LHSV
liquid hourly space velocity (h–1)
- m
reaction order for hydrogen
- n
reaction order for sulfur
- KHDS
reaction rate coefficient for HDS
- rHDS
reaction rate for HDS per catalyst unit mass (mol g–1·s–1)
- K0
pre-exponential factor for HDS
- EA
activation energy (J/mol)
- P
reactor total pressure (MPa)
- T
temperature (k)
- ug
superficial gas velocity (cm s–1)
- kiL
mass transfer coefficient of gas–liquid for i compound (cm s–1)
- aL
specific surface area of gas–liquid interface (cm–1)
- PiG
partial pressure for i compound (MPa)
- hi
Henry’s coefficient for i compounds (MPa cm3 mol–1)
- ul
superficial liquid velocity (cm s–1)
- kiS
liquid–solid mass transfer coefficient for i compound (cm s–1)
- aS
specific surface area of liquid–solid interface (cm–1)
- CiL
concentration of i compound in the liquid phase (mol cm–3)
- CiS
concentration of i compound in the solid phase (mol cm–3)
- GL
liquid mass velocity (g cm–2 s–1)
- DK
Knudsen diffusivity (cm2 s–1)
- Dsull
molecular diffusivity for sulfur in the liquid (cm2 s–1)
- DH2l
molecular diffusivity for H2 in the liquid (cm2 s–1)
- DH2Sl
molecular diffusivity for H2S in the liquid (cm2 s–1)
- ds
equivalent diameter of spherical catalyst particle (cm)
- Mw
molecular weight of the feedstock (g·mol–1)
- Z
catalyst bed length (cm)
- Vp
total geometric volume of catalyst (cm3)
- Sp
total geometric external area of catalyst (cm2)
- Lp
particle size (cm)
- dp
particle diameter (cm)
- L
particle length (cm)
- rc
radius of cylinder (cm)
- A1
the lateral area of the geometric shape between lobes (cm2)
- A2
the common area between each cylinder (cm2)
- N
the number of lobes
Greek Symbols
- α
LHSV index
- ηHDS
catalyst effectiveness factor for HDS
- ρB
bulk density of the catalyst particles (g cm–3)
- ρL
oil density (g cm–3)
- ρG
gas density (g cm–3)
- μL
liquid viscosity (mPa·s)
- ε
void fraction of catalyst bed
Subscripts
- sul
sulfur
- H2
hydrogen
- H2S
hydrogen sulfide
Superscripts
- g
gas phase
- L
liquid phase
- S
solid phase
Supporting Information Available
The Supporting Information is available free of charge at https://pubs.acs.org/doi/10.1021/acsomega.0c00683.
Table S1, the empirical correlations used for estimating the properties of gases and liquids; Table S2, chemical composition of feedstock; and Table S3, chemical composition of products (PDF)
The authors declare no competing financial interest.
Supplementary Material
References
- Han L.; Zhang R.; Bi J. Experimental investigation of high-temperature coal tar upgrading in supercritical water. Fuel Process. Technol. 2009, 90, 292–300. 10.1016/j.fuproc.2008.09.012. [DOI] [Google Scholar]
- Kan T.; Wang H.; He H.; Li C.; Zhang S. Experimental study on two-stage catalytic hydroprocessing of middle-temperature coal tar to clean liquid fuels. Fuel 2011, 90, 3404–3409. 10.1016/j.fuel.2011.06.012. [DOI] [Google Scholar]
- Yan J.; Caishan L.; Aihua L.; Jianwen D. Production of gasoline and diesel oil by hydrogenation of high temperature coal tar. Petrochem. Technol. 2006, 35, 33–26. [Google Scholar]
- Zhao G.-f.; Yao C.-l.; Quan H. The research of anthracene oil hydro- upgrading. Contemp. Chem. Ind. 2008, 37, 341–343. [Google Scholar]
- Xu J.; Fang X.; Guan M.; Yao C. Producing clean fuel oil from anthracene oil with two stage hydrogenation. Chem. Ind. Eng. Prog. 2014, 33, 64–69. [Google Scholar]
- Abu I. I.; Smith K. J. HDN and HDS of model compounds and light gas oil derived from Athabasca bitumen using supported metal phosphide catalysts. Appl. Catal., A Gen. 2007, 328, 58–67. 10.1016/j.apcata.2007.05.018. [DOI] [Google Scholar]
- Dai F.; Zhang Y.; Xia E.; Zhang Z.; Zhang Z.; Li C. Modeling of fixed bed reactor for coal tar hydrogenation via the kinetic lumping approach. Carbon Resour. Convers. 2018, 1, 279–283. 10.1016/j.crcon.2018.11.002. [DOI] [Google Scholar]
- Dai F.; Gong M.; Li C.; Li Z.; Zhang S. New kinetic model of coal tar hydrogenation process via carbon number component approach. Appl. Energy 2015, 137, 265–272. 10.1016/j.apenergy.2014.10.009. [DOI] [Google Scholar]
- Zhu Y.; Zhang Y.; Dan Y.; Yuan Y.; Zhang L.; Li W.; Li D. Optimization of reaction variables and macrokinetics for the hydrodeoxygenation of full range low temperature coal tar. React. Kinet., Mech. Catal. 2015, 116, 433–450. 10.1007/s11144-015-0900-x. [DOI] [Google Scholar]
- Niu M.; Zheng H.; Sun X.; Zhang S.; Li D.; Qiao J.; Li W. Kinetic Model for Low-Temperature Coal Tar Hydrorefining. Energy Fuels 2017, 31, 5441–5447. 10.1021/acs.energyfuels.6b03109. [DOI] [Google Scholar]
- Feng X.; Shen Z.; Li D.; Liu X.; Fan X.; Zheng H.; Dan Y.; Li W. Kinetic parameter estimation and simulation of trickle-bed reactor for hydrodenitrogenation of whole-fraction low-temperature coal tar. Energy Sources, Part A 2018, 41, 802–810. 10.1080/15567036.2018.1520360. [DOI] [Google Scholar]
- Feng X.; Li D.; Chen J.; Niu M.; Liu X.; Chan L. L. T.; Li W. Kinetic parameter estimation and simulation of trickle-bed reactor for hydrodesulfurization of whole fraction low-temperature coal tar. Fuel 2018, 230, 113–125. 10.1016/j.fuel.2018.05.023. [DOI] [Google Scholar]
- Furimsky E. Selection of catalysts and reactors for hydroprocessing. Appl. Catal., A Gen. 1998, 171, 177–206. 10.1016/S0926-860X(98)00086-6. [DOI] [Google Scholar]
- Korsten H.; Hoffmann U. Three-phase reactor model for hydrotreating in pilot trickle-bed reactors. AIChE J. 1996, 42, 1350–1360. 10.1002/aic.690420515. [DOI] [Google Scholar]
- Jarullah A. T.; Mujtaba I. M.; Wood A. S. Kinetic model development and simulation of simultaneous hydrodenitrogenation and hydrodemetallization of crude oil in trickle bed reactor. Fuel 2011, 90, 2165–2181. 10.1016/j.fuel.2011.01.025. [DOI] [Google Scholar]
- Jiménez F.; Kafarov V.; Nuñez M. Modeling of industrial reactor for hydrotreating of vacuum gas oils: Simultaneous hydrodesulfurization, hydrodenitrogenation and hydrodearomatization reactions. Chem. Eng. J. 2007, 134, 200–208. 10.1016/j.cej.2007.03.080. [DOI] [Google Scholar]
- Murali C.; Voolapalli R. K.; Ravichander N.; Gokak D. T.; Choudary N. V. Trickle bed reactor model to simulate the performance of commercial diesel hydrotreating unit. Fuel 2007, 86, 1176–1184. 10.1016/j.fuel.2006.09.019. [DOI] [Google Scholar]
- Li D.; Cui W.; Zhang X.; Meng Q.; Zhou Q.; Ma B.; Niu M.; Li W. Production of Clean Fuels by Catalytic Hydrotreating a Low Temperature Coal Tar Distillate in a Pilot-Scale Reactor. Energy Fuels 2017, 31, 11495–11508. 10.1021/acs.energyfuels.7b01971. [DOI] [Google Scholar]
- Li D.; Li W. H.; Liu Q. C.; Fan Z.; Li H.; Ma W.; Yan S. H. Optimization of Processing Parameters and Macrokinetics for Hydrodesulfurization of Coal Tar. Energy Sources, Part A 2015, 37, 2591–2600. 10.1080/15567036.2011.649336. [DOI] [Google Scholar]
- Li D.; Niu M.; Yang Z.; Wang S.; Fan Z.; Feng X.; Li W. Effect of phosphorus modification on the coal tar hydrogenation activity of the Ni–Mo/γ-Al2O3 catalyst. React. Kinet., Mech. Catal. 2018, 125, 271–286. 10.1007/s11144-018-1418-9. [DOI] [Google Scholar]
- Yuan Y.; Li D.; Zhang L.; Zhu Y.; Wang L.; Li W. Development, Status, and Prospects of Coal Tar Hydrogenation Technology. Energy Technol. 2016, 4, 1338–1348. 10.1002/ente.201600184. [DOI] [Google Scholar]
- Pei L.; Li D.; Liu X.; Cui W.; Shao R.; Xue F.; Li W. Investigation on Asphaltenes Structures during Low Temperature Coal Tar Hydrotreatment under Various Reaction Temperatures. Energy Fuels 2017, 31, 4705–4713. 10.1021/acs.energyfuels.6b03180. [DOI] [Google Scholar]
- Li D.; Li Z.; Li W.; Liu Q.; Feng Z.; Fan Z. Hydrotreating of low temperature coal tar to produce clean liquid fuels. J. Anal. Appl. Pyrolysis 2013, 100, 245–252. 10.1016/j.jaap.2013.01.007. [DOI] [Google Scholar]
- Bhaskar M.; Valavarasu G.; Meenakshisundaram A.; Balaraman K. S. Application of a three phase heterogeneous model to analyse the performance of a pilot plant trickle bed reactor. Pet. Sci. Technol. 2002, 20, 251–268. 10.1081/LFT-120002098. [DOI] [Google Scholar]
- Chowdhury R.; Pedernera E.; Reimert R. Trickle-bed reactor model for desulfurization and dearomatization of diesel. AIChE J. 2002, 48, 126–135. 10.1002/aic.690480113. [DOI] [Google Scholar]
- Alvarez A.; Ancheyta J. Modeling residue hydroprocessing in a multi-fixed-bed reactor system. Appl. Catal., A Gen. 2008, 351, 148–158. 10.1016/j.apcata.2008.09.010. [DOI] [Google Scholar]
- Ma X.; Sakanishi K.; Isoda T.; Mochida I. Hydrodesulfurization Reactivities of Narrow-Cut Fractions in a Gas Oil. Ind. Eng. Chem. Res. 1995, 34, 748–754. 10.1021/ie00042a006. [DOI] [Google Scholar]
- Mederos F. S.; Ancheyta J. Mathematical modeling and simulation of hydrotreating reactors: Cocurrent versus countercurrent operations. Appl. Catal., A Gen. 2007, 332, 8–21. 10.1016/j.apcata.2007.07.028. [DOI] [Google Scholar]
- Jarullah A. T.; Mujtaba I. M.; Wood A. S. Kinetic parameter estimation and simulation of trickle-bed reactor for hydrodesulfurization of crude oil. Chem. Eng. Sci. 2011, 66, 859–871. 10.1016/j.ces.2010.11.016. [DOI] [Google Scholar]
- Duduković M.; Larachi F.; Mills P. L. Multiphase Catalytic Reactors: A Perspective on Current Knowledge and Future Trends. Catal. Rev. 2002, 44, 123–246. 10.1081/CR-120001460. [DOI] [Google Scholar]
- Macías M. J.; Ancheyta J. Simulation of an isothermal hydrodesulfurization small reactor with different catalyst particle shapes. Catal. Today 2004, 98, 243–252. 10.1016/j.cattod.2004.07.038. [DOI] [Google Scholar]
- Reid R. C.; Prausnitz J. M.; Poling B. E.. The Properties of Gases and Liquids. 4nd ed.; McGraw-Hill: NewYork, 1987. [Google Scholar]
- Froment G. F.; Bischoff K.B.; J D. W.. Chemical reactor analysis and design. 3nd ed.; Wiley: New York, 1981. [Google Scholar]
- Marroquín G.; Ancheyta J.; Esteban C. A batch reactor study to determine effectiveness factors of commercial HDS catalyst. Catal. Today 2005, 104, 70–75. 10.1016/j.cattod.2005.03.026. [DOI] [Google Scholar]
- Novaes L. d. R.; de Resende N. S.; Salim V. M. M.; Secchi A. R. Modeling, simulation and kinetic parameter estimation for diesel hydrotreating. Fuel 2017, 209, 184–193. 10.1016/j.fuel.2017.07.092. [DOI] [Google Scholar]
- Vasudevan P. T.; Fierro J. L. G. A review of deep hydrodesulfurization catalysis. Catal. Rev. 1996, 38, 161–188. 10.1080/01614949608006457. [DOI] [Google Scholar]
- Startsev A. N. The mechanism of HDS catalysis. Catal. Rev. 1995, 37, 353–423. 10.1080/01614949508006446. [DOI] [Google Scholar]
- Girgis M. J.; Gates B. C. Reactivities, reaction networks, and kinetics in high-pressure catalytic hydroprocessing. Ind. Eng. Chem. Res. 1991, 30, 2021–2058. 10.1021/ie00057a001. [DOI] [Google Scholar]
- van Parijs I. A.; Froment G. F. Kinetics of hydrodesulfurization on a CoMo/γ-Al2O3 catalyst. 1. Kinetics of the hydrogenolysis of benzothiophene. Ind. Eng. Chem. Prod. Res. Dev. 1986, 25, 431–436. 10.1021/i300023a011. [DOI] [Google Scholar]
- Farag H.; Whitehurst D. D.; Sakanishi K.; Mochida I. Carbon versus alumina as a support for Co–Mo catalysts reactivity towards HDS of dibenzothiophenes and diesel fuel. Catal. Today 1999, 50, 9–17. 10.1016/S0920-5861(98)00476-3. [DOI] [Google Scholar]
- Kim H.; Lee J. J.; Moon S. H. Hydrodesulfurization of dibenzothiophene compounds using fluorinated NiMo/Al2O3 catalysts. Appl. Catal., B 2003, 44, 287–299. 10.1016/S0926-3373(03)00077-8. [DOI] [Google Scholar]
- Choudhary T. V. Structure–Reactivity–Mechanistic Considerations in Heavy Oil Desulfurization. Ind. Eng. Chem. Res. 2007, 46, 8363–8370. 10.1021/ie061617d. [DOI] [Google Scholar]
- Sapre A. V.; Broderick D. H.; Fraenkel D.; Gates B. C.; Nag N. K. Hydrodesulfurization of benzo[b]naphtho[2,3-d]thiophene catalyzed by sulfided CoO-MoO3/γ-Al2O3: The reaction network. AIChE J. 1980, 26, 690–694. 10.1002/aic.690260426. [DOI] [Google Scholar]
- Choudhary T. V.; Malandra J.; Green J.; Parrott S.; Johnson B. Towards Clean Fuels: Molecular-Level Sulfur Reactivity in Heavy Oils. Angew. Chem. 2006, 45, 3299–3303. 10.1002/anie.200503660. [DOI] [PubMed] [Google Scholar]
- Régnier N.; Defaye G.; Caralp L.; Vidal C. Software sensor based control of exothermic batch reactors. Chem. Eng. Sci. 1996, 51, 5125–5136. 10.1016/S0009-2509(96)00329-6. [DOI] [Google Scholar]
- Reséndiz E.; Ancheyta J.; Rosales-Quintero A.; Marroquín G. Estimation of activation energies during hydrodesulfurization of middle distillates. Fuel 2007, 86, 1247–1253. 10.1016/j.fuel.2006.09.023. [DOI] [Google Scholar]
- Sánchez S.; Ancheyta J. Effect of pressure on the kinetics of moderate hydrocracking of Maya crude oil. Energy Fuels 2007, 21, 653–661. 10.1021/ef060525y. [DOI] [Google Scholar]
- Nickos P.; John M. Kinetics of catalytic hydrodesulfurization of a petroleum residue in a batch-recycle trickle bed reactor. Chem. Eng. Sci. 1984, 39, 1051–1061. 10.1016/0009-2509(84)87014-1. [DOI] [Google Scholar]
- Rodríguez M. A.; Ancheyta J. Modeling of hydrodesulfurization (HDS), hydrodenitrogenation (HDN), and the hydrogenation of aromatics (HDA) in a vacuum gas oil hydrotreater. Energy Fuels 2004, 18, 789–794. 10.1021/ef030172s. [DOI] [Google Scholar]
- Bhaskar M.; Valavarasu G.; Sairam B.; Balaraman K. S.; Balu K. Three-phase reactor model to simulate the performance of pilot-plant and industrial trickle-bed reactors sustaining hydrotreating reactions. Ind. Eng. Chem. Res. 2004, 43, 6654–6669. 10.1021/ie049642b. [DOI] [Google Scholar]
- Cheng Z.-M.; Fang X.-C.; Zeng R.-H.; Han B.-P.; Huang L.; Yuan W.-K. Deep removal of sulfur and aromatics from diesel through two-stage concurrently and countercurrently operated fixed-bed reactors. Chem. Eng. Sci. 2004, 59, 5465–5472. 10.1016/j.ces.2004.09.036. [DOI] [Google Scholar]
- Yang Y.; Leng Z.-G.; Yang Y.-T.; Cao F.-H. Analysis of Sulfuric Compounds in Coal Tar Mixtures. J. Chem. Eng. Chin. Univ. 2015, 29, 1025–1031. [Google Scholar]
- Zhu J.-L.; Fan X.; Wei X.-Y.; Wang S.-Z.; Zhu T.-G.; Zhou C.-C.; Zhao Y.-P.; Wang R.-Y.; Lu Y.; Chen L.; You C.-Y. Molecular characterization of heteroatomic compounds in a high-temperature coal tar using three mass spectrometers. Fuel Process. Technol. 2015, 138, 65–73. 10.1016/j.fuproc.2015.04.020. [DOI] [Google Scholar]
- Tsamatsoulis D.; Papayannakos N. Investigation of intrinsic hydrodesulphurization kinetics of a VGO in a trickle bed reactor with backmixing effects. Chem. Eng. Sci. 1998, 53, 3449–3458. 10.1016/S0009-2509(98)00144-4. [DOI] [Google Scholar]
- Ancheyta J.; Angeles M. J.; Macías M. J.; Marroquín G.; Morales R. Changes in apparent reaction order and activation energy in the hydrodesulfurization of real feedstocks. Energy Fuels 2002, 16, 189–193. 10.1021/ef0101917. [DOI] [Google Scholar]
- Bahzad D.; Al-Fadhli J.; Al-Dhafeeri A.; Abdal A. Assessment of Selected Apparent Kinetic Parameters of the HDM and HDS Reactions of Two Kuwaiti Residual Oils, Using Two Types of Commercial ARDS Catalysts. Energy Fuels 2010, 24, 1495–1501. 10.1021/ef9012104. [DOI] [Google Scholar]
- Marafi A.; Al-Bazzaz H.; Al-Marri M.; Maruyama F.; Absi-Halabi M.; Stanislaus A. Residual-oil hydrotreating kinetics for graded catalyst systems: Effect of original and treated feedstocks. Energy Fuels 2003, 17, 1191–1197. 10.1021/ef020282j. [DOI] [Google Scholar]
- Chang J.; Liu J.; Li D. Kinetics of resid hydrotreating reactions. Catal. Today 1998, 43, 233–239. 10.1016/S0920-5861(98)00152-7. [DOI] [Google Scholar]
- Mills P. L.; Duduković M. P. A Dual-Series Solution for the Effectiveness Factor of Partially Wetted Catalysts in Trickle-Bed Reactors. Ind. Eng. Chem. Fundam. 1979, 18, 139–149. 10.1021/i160070a009. [DOI] [Google Scholar]
- Shichi A.; Satsuma A.; Iwase M.; Shimizu K.-I.; Komai S.-I.; Hattori T. Catalyst effectiveness factor of cobalt-exchanged mordenites for the selective catalytic reduction of NO with hydrocarbons. Appl. Catal., B 1998, 17, 107–113. 10.1016/S0926-3373(98)00003-4. [DOI] [Google Scholar]
Associated Data
This section collects any data citations, data availability statements, or supplementary materials included in this article.