

Abstract

The Re(I) dimer complex, [fac(CO)3(phen)Re1-N(py)COORe2(phen)fac(CO)3]+ (py = pyridine; phen = 1,10-phenanthroline), contains two different Re(I) centers 9.3 Å apart, one with a nitrogen donor and the other with an acetate donor from the bridging isonicotinate ligand. The complexes were characterized by 1H NMR, UV–vis, fluorescence, and IR spectroscopy, elemental analysis, and single-crystal X-ray diffraction. The absorption and emission properties of the dimer dominated by charge transfer transitions are analyzed with respect to those of the monomers, [fac(CO)3(phen)Re-N(pyCOOCH3)]+ and [fac(CO)3(phen)ReOOCCH3]. Spectral comparison of these three complexes results in the unexpected finding that the dimer emission (575 nm) occurs near that of the nicotinate-containing monomer (580 nm) rather than near the lower energy-emitting state (650 nm) of the acetate-containing monomer. Density functional theory (DFT) calculations elucidate this unusual emission behavior. The geometries of the dimer and two monomers are optimized in the singlet ground and lowest-energy triplet excited states (LLTS’s) to interpret absorption and emission behaviors, respectively. The singlet excited states calculated using time-dependent DFT correlate well with the absorption spectra in the lowest-energy and other major electronic transitions. The energy gaps and low-lying singlet excited states of the dimer are close to those of the acetate-containing monomer. The lowest-energy Franck–Condon triplet excited state of the dimer arising from electronic transitions localized on the acetate moiety is unstable. The next higher Franck–Condon triplet excited state arises from long-range charge transfer transition, and its energy is close to that of the nicotinate-containing monomer. Optimization of the dimer LLTS yields a stable state based on a long-range charge transfer transition involving occupied orbitals partially localized on the bridging nicotinate moiety. The LLTS energies of the dimer and nicotinate-containing monomer are in very good agreement as are the emission energies of these complexes. The correlated spectroscopic and computational results corroborate to the understanding of charge transfer states and transitions toward the development of photosensitive compounds for photoelectrochemical solar energy conversion cells.
Introduction
The photochemical and photophysical nature of the rhenium(I) tricarbonyl diimine bidentate complexes has been extensively studied and reviewed.1−5 The emission process is primarily associated with relaxation from a triplet metal-to-ligand-charge-transfer (3MLCT) excited state, although multistate luminescence has also been reported.3,6 The excited-state lifetimes, luminescence energies, and quantum yields can be modulated to a considerable extent by varying the structure of the bidentate diimine and monodentate ancillary ligands. It is evident that Re(I) tricarbonyl complexes with a pyridine ancillary ligand containing the diimine ligand 1,10-phenanthroline have longer emission lifetimes and higher emission quantum yields than those of the respective 2,2′-bipyridine analogues due to the more extensive π system of the former.7 The tunable excited-state properties make Re(I) tricarbonyl diimine complexes attractive to researchers in areas of catalytic reduction of CO2 to CO,8−13 fluorophores for biological applications,14,15 light-emitting diodes,16,17 and photoelectrochemical cells for the conversion of solar energy to electricty.17,18 The effectiveness of photovoltaic energy conversion is dependent on the large spatial separation of the chromophores that is necessary to decrease recombination and the accessibility of the transport state, expressed as the energy of the transport orbital.19−21 Applications in bulk heterojunction solar cells and optical light-emitting devices have become particularly attractive recently due to the efficiency of light-harvesting from the emitting triplet state of the Re(I) tricarbonyl moiety.16,22
Rhenium(I) tricarbonyl diimine dimers containing symmetrical bridging ligands, such as 4,4′-bipyridine and 1,2-bis(4-pyridyl)-ethylene, also exhibit emission from the 3MLCT state.23,24 The lifetime and quantum yield of the 4,4′-bipyridine-bridged dimer are approximately half as large as those of the respective monomer [Re(CO)3(4,4′-bipyridine)(ph2phen)]+ where ph2phen is 4,7-diphenyl-1,10-phenanthroline.23 A multidentate bridging ligand coordinated to two Re(CO)3Cl moieties yields a redox-active catalytic dimer synthesized by Siewert and co-workers.25 A series of rhenium(I) tricarbonyl dimers containing chromophoric diazine and ancillary anionic bridging ligands have been reported to exhibit a broad luminescence modulation range.26,27 A trinuclear Re(CO)3 diimine complex containing a multidentate pyridyl-triazine ligand that provides equivalent Re(I) centers has also been reported to emit from a 3MLCT state.28
Density functional theory (DFT) is a powerful and effective tool for the investigation and interpretation of the geometry and electronic structure of rhenium(I) complexes26,29,30 and polyrhenium clusters.31 Frontier molecular orbital energies and energy gaps between the highest occupied molecular orbital (HOMO) and lowest unoccupied molecular orbital (LUMO) computed using DFT exhibit impressive correlations with experimental absorption spectra and redox potentials from cyclic voltammetry.32−34 Analysis of the molecular orbital spatial distributions facilitates the assignment of absorption and emission spectra and interpretation of charge transfer processes.26,32 The time-dependent density functional theory (TD-DFT) yields excited states for vertical electronic transitions that correlate well with absorption spectra. Both DFT and TD-DFT applied in tandem with the polarizable continuum model (PCM) or the conductor-like polarizable continuum model (CPCM) of solvation account properly for solvation effects.32,35−38
Here, we report the synthesis and spectroscopic characterization as well as the crystal, molecular, and electronic structures of the Re(I) dimer complex, {[Re(phen)(CO)3]2(isonic)}(CF3SO3), 1, where phen = 1,10-phenanthroline and isonic = isonicotinic (or para-nicotinic) acid. The distinct coordination environments of the dimer Re(I) centers are investigated with respect to the model monomeric complexes Re(phen)(CO)3(4-COOCH3-py)](CF3SO3), 2, and Re(phen)-(CO)3(OAc), 3, where py = pyridine and OAc = acetate.
Results
Synthesis
The starting material of the Re(CO)3(phen)Cl complex was synthesized by treating stoichiometric amounts of Re(CO)5Cl with a 1,10-phenanthroline ligand in ethanol at reflux conditions. Further, treatment of Re(CO)3(phen)Cl with AgCF3SO3 followed by addition of isonicotinic acid yielded the bridged complex 1. Model monomers 2 and 3 were synthesized by a similar procedure for 1 by changing isonicotinic acid to methyl isonicotinate and acetate ion, respectively. The identities of the bidentate ligands and Re(I) complexes were confirmed by 1H NMR spectroscopy, elemental analysis, and X-ray structure determinations indicating that the ligands and complexes were pure and could be studied for their photophysical properties. The series of Re(I) complexes were also characterized by infrared spectroscopy, which shows two stretches present in the carbonyl region (1900 to 2100 cm–1). ORTEP diagrams with thermal ellipsoids drawn at the 50% probability level for the three complexes are shown in Figure 1. The synthesis procedure and X-ray structure information of complexes 1–3 are presented in the Supporting Information, Sections S1 and S2, respectively.
Figure 1.
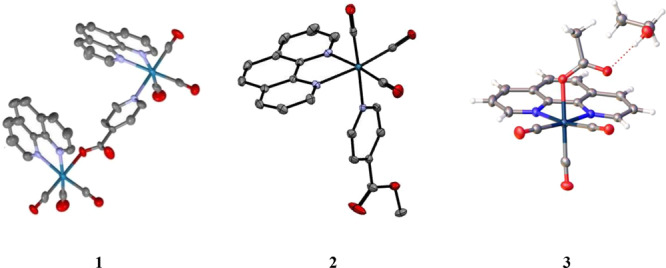
ORTEP diagrams at 50% probability for (1) [fac(CO)3(phen)Re-N(py)COORe(phen)fac(CO)3]+,39 (2) [fac(CO)3(phen)Re-N(pyCOOCH3]+,40 and (3) fac(CO)3(phen)Re-OOCCH3.41 [Permission granted by the Cambridge Crystallographic Data Center.]
Experimental UV–Visible Absorption and Emission Spectra
The electronic absorption spectra of Re(I) complexes 1–3 were determined in acetonitrile at room temperature, and the energy maxima are listed in Table 1. They all show two to three major transitions in acetonitrile. The low-energy transitions located at the 360 to 380 nm region are assigned as metal-to-ligand charge transfer (MLCT) and the more intense, higher-energy transitions located at energies of <300 nm to intraligand π → π* transition.42 These assignments based on spectroscopic determinations are in agreement with the TD-DFT-based assignments presented below. Absorption coefficients for the complexes range from 3800 to 4400 M–1 cm–1 for the MLCT maxima and from 4866 to 6511 M–1 cm–1 in the π to π* region. Figure 2a shows the spectral comparison of complexes 1, 2, and 3. The spectra for 1 and 2 are nearly identical in the MLCT region, but complex 2 showed a strong π → π* intensity peak at 270 nm compared to a less intense absorbance for complex 1. Among the three complexes, the low energy absorption maxima in electronvolts follow the spectrochemical series 1 > 2 > 3.
Table 1. Experimental Electronic Absorption and Emission Energies (in eV and Those in Parentheses in nm), Molar Absorptivity Coefficients (in M–1 cm–1), Excited-State Lifetimes (in ns), and Quantum Yields of [fac(CO)3(Phen)Re-N(py)COORe(phen)fac(CO)3]+ (1), [fac(CO)3(Phen)Re-N(pyCOOCH3]+ (2), and fac(CO)3(Phen)Re-OOCCH3 (3) in Acetonitrile Solvent at Room Temperature for Absorption and at 77 K for Emission (MLCT = Metal-to-Ligand Charge Transfer).
| complex | λabs | ε | type | λema | τa | φx | type |
|---|---|---|---|---|---|---|---|
| 1 | 3.40 (364)b | 3.84 × 10³ | MLCT | 2.15 (575) | 141 | 0.04 | 3MLCT |
| 3.78 (328)b | 5.92 × 10³ | MLCT | |||||
| 4.55 (272) | 7.02 × 10³ | π–π* | |||||
| 2 | 3.36 (368)b | 4.45 × 10³ | MLCT | 2.13 (580) | 450 | 0.12 | 3MLCT |
| 3.82 (324)b | 9.85 × 10³ | MLCT | |||||
| 4.33 (286) | 1.12 × 10⁴ | π–π* | |||||
| 3 | 3.26 (380) | 3.86 × 10³ | MLCT | 1.91 (650) | 86 | 0.11 | 3MLCT |
| 3.80 (326)b | 3.56 × 10³ | MLCT | |||||
| 4.33 (286) | 6.43 × 10³. | π–π* |
λex at MLCT maxima.
Shoulder with energy that cannot be fully resolved.
Figure 2.

Experimental (a) absorption and (b) emission spectra of −[fac(CO)3(phen)Re-N(py)COORe(phen)fac(CO)3]+(1), −[fac(CO)3(phen)Re-N(pyCOOCH3]+(2), and −fac(CO)3(phen)Re-OOCCH3(3) in acetonitrile solvent at room temperature for absorption and at 77 K for emission.
The emission maxima for the three complexes are listed in Table 1 along with the respective emission quantum yields and emission lifetimes. The emission quantum yields were obtained in acetonitrile at room temperature conditions. The standard reference used for this experiment was ruthenium(II) tris-bipyridine hexafluorophosphate,43 Ru(bpy)3(PF6)2. All data were calculated using eq 1 where φx is the experimental emission quantum yield of the sample, Astd and Ax are absorbance of the standard and the sample, and Istd and Ix are the emission intensities of the standard and the sample, respectively, while φstd is the reported emission quantum yield of the standard (φ[Ru(bpy)2]2+ = 0.042) in acetonitrile.
| 1 |
Figure 2b shows the normalized emission spectra of complexes 1, 2, and 3. The Re(I) dimer and derivatives of the pyridine-coordinated Re(I)-phen complexes show similar emission maxima near 575 nm, but the OAc-coordinated Re(I)-phen complex (fac(CO)3(phen)Re-OOCCH3) exhibits a red shift to 650 nm.
The emission quantum yields of complexes 1, 2, and 3 range from 4 to 12% (Table 1). The excited-state emission lifetimes of the complexes decrease in the sequence 442 > 141 > 86 ns for 2 > 1 > 3, respectively, following the same trend as that of the emission quantum yield.
Geometry Optimization
Selected bond distances and angles determined using XRD for single crystals are compared to optimized structures using the B3PBE/TZVP-QZV-P/CPCM method in the SGS and LLTS in Table 2. The Re–N bond lengths optimized using the B3PBE functional are longer than the experimentally determined values by 0.02–0.03 Å, which is an improvement compared to nearly 0.05 Å using the B3LYP functional.32,42 The calculated SGS and experimental geometry parameters are considered to be in good agreement, as noted previously for the B3PBE density functional,42 supporting the appropriateness of the theoretical approach for further electronic state calculations. The LLTS geometries differ from those of SGS mainly in the Re2-phen moiety of the dimer and Re-phen of the monomers due to increased spin density distribution, as discussed below. The Re–Re distance is shorter by 0.03 Å in the LLTS than in the SGS. The Re–N and Re–C(CO) bond lengths of the complexes optimized using the CAM-B3LYP functional are longer than the respective B3PBE values by 0.01 Å (Supporting Information, Tables S3-S6 and Figures S2 and S3).
Table 2. Selected Bond Lengths (Å), Bond Angles (°), and Torsion Angles (°) of Complexes 1–3a.
| complex | geometry | XRD | B3PBE (SGS) | B3PBE (LLTS) |
|---|---|---|---|---|
| 1 | bond lengths | |||
| Re1-O(OOC) | 2.160(8) | 2.15 | 2.15 | |
| Re1-N(phen) | 2.160(11), 2.173(10) | 2.20 | 2.20 | |
| Re1-C(COAx) | 1.946(17) | 1.91 | 1.91 | |
| Re1-C(COPl) | 1.919(15) | 1.92 | 1.92 | |
| Re2-N(py) | 2.219(8) | 2.24 | 2.21 | |
| Re2-C2(COAx) | 1.950(12) | 1.92 | 1.97 | |
| Re2-C1(COPl) | 1.936(14), 1.926(14) | 1.92 | 1.94, 2.00 | |
| Re2-N(phen) | 2.180(10), 2.181(10) | 2.20 | 2.06, 2.18 | |
| Re1-Re2 distance | 9.26 | 9.33 | 9.30 | |
| angles | ||||
| N-Re1-N(phen) | 76.3(4) | 75.1 | 75.1 | |
| C(COAx)-Re1-O(OOC) | 179.4(6) | 174.2 | 174.2 | |
| N-Re2-N(phen) | 75.5(4) | 75.1 | 77.2 | |
| C(COAx)-Re2-N(py) | 176.3(5) | 178.3 | 177.4 | |
| N(phen)-Re1-O(OOC) | 79.2(3), 83.0(4) | 80.0, 83.2 | 80.0, 83.2 | |
| N(phen)-R2-N(py) | 82.3(4), 86.1(3) | 85.2, 85.3 | 84.8, 89.7 | |
| torsion angles | ||||
| Re1-N(phen)-C(COPl)-C(COPl) | 179.4(11), 178.5(10) | 178.1 | 178.7 | |
| Re2-N(phen)-C(COPl)-C(COPl) | 177.2(11), 177.6(9) | 178.3 | 179.5 | |
| 2 | bond lengths | |||
| Re-N(py) | 2.2207(19) | 2.24 | 2.22 | |
| Re-N(phen) | 2.1809(19), 2.1769(19) | 2.20 | 2.06, 2.18 | |
| Re-C(COAx) | 1.913(2) | 1.92 | 1.96 | |
| Re-C(COPl) | 1.920(3), 1.935(3) | 1.92 | 1.94, 2.00 | |
| angles | ||||
| N-Re-N(phen) | 76.08(7) | 75.2 | 77.2 | |
| C(COAx)-Re-N(py) | 177.22(8) | 178.4 | 177.9 | |
| torsion angle | ||||
| Re-N(phen)-C(COPl)-C(COPl) | 178.00 | 178.9 | 178.0 | |
| 3 | bond lengths | |||
| Re-O(OOC) | 2.1342(17) | 2.13 | 2.03 | |
| Re-N(phen) | 2.175(2), 2.1685(19) | 2.20 | 2.10, 2.17 | |
| Re-C(COAx) | 1.908(3) | 1.91 | 1.98 | |
| Re-C(COPl) | 1.924(3), 1.912(3) | 1.92 | 1.94, 1.99 | |
| angles | ||||
| N-Re-N(phen) | 75.60(7) | 75.0 | 77.3 | |
| C(COAx)-Re-O(OOC) | 176.51(16) | 173.3 | 171.9 | |
| torsion | ||||
| Re-N(phen)-C(COPl)-C(COPl) | 177.9 | 177.4 | 177.9 |
In complex 1, the Re atom coordinated to O(OOC) is labeled as Re1 and the Re atom coordinated to N(py) is labeled as Re2. (SGS = singlet ground state; LLTS = lowest-lying triplet state; phen = 1,10-phenanthroline; py = pyridine; COAx = CO perpendicular to phen; COPl = CO co-planar with phen.)
Singlet Excited Electronic States
The Franck–Condon singlet excited states (SES) of the complexes were calculated relative to the fully optimized SGS using the B3PBE/TD-DFT/CPCM method in acetonitrile solvent. Selected SES’s with an oscillator strength higher than 0.045 at energies close to the spectroscopic peaks (Table 1) along with assignments of the major contributing electronic transitions are listed in Table 3. All SES’s with oscillator strengths higher than 0.045 are listed in the Supporting Information,Table S2. The excited-state types are assigned based on the molecular orbital spatial distributions presented in Figure 3 for HOMO–5 to LUMO+5 and in the Supporting Information,Figure S1. The normalized percent contributions of the major electronic transitions contributing to the SES are given in parentheses next to the main transition contributing to the respective excited state. The lower-energy excited states are mainly associated with charge transfer transitions involving, to a variable extent, ligands and the Re centers and assigned as metal-and-ligand-to-ligand charge transfer (MLLCT). Higher-energy states have mainly a ligand character, and those with large oscillator strengths exhibit an extensive π–π* character localized on the CO and phenanthroline moiety with the latter being the largest chromophore. The excited states of complex 1 containing two Re centers and the bridging chromophore isonicotinate have substantial contributions from low-lying occupied and high-lying virtual molecular orbitals.
Table 3. Selected Singlet Excited States (SES) (in eV and in Parentheses in Nm) with Oscillator Strength (f) Higher than 0.045 of Complexes 1–3 in Acetonitrilea.
| complex | SES | f | type | transition, ψo → ψv |
|---|---|---|---|---|
| 1 | 3.24 (383) | 0.049 | MLLCTRe2-CO→phen(Re2), π–π*CO,phen(R2) | H–3 → L (58%) |
| MMLCTRe1-OOC→Re2-py | H–1 → L (26%) | |||
| 3.55 (349) | 0.057 | MLLCTRe1-OOC→NA | H–1 → L+4 (82%) | |
| 3.84 (323) | 0.121 | MLLCTCO-Re2-py→NA, π–π*NA | H–3 → L+4 (91%) | |
| 4.53 (274) | 0.083 | MLLCTCO-Re2 → phen(Re2), π–π*phen(Re2) | H–4 → L+5 (49%) | |
| π–π*phen, d-dRe2 | H–10 → L (17%) | |||
| 4.61 (269) | 0.153 | π–π*CO(Re2), d–dRe2 | H–4 → L+9 (23%) | |
| π–π*phen(Re2), LLCTphen(Re2) → CO(Re2) | H–10 → L (23%) | |||
| 2 | 3.49 (355) | 0.110 | MLLCTCO-Re-phen→NA | H → L+1 (90%) |
| 3.67 (338) | 0.053 | LLCTphen → NA | H–3 → L+1 (90%) | |
| 4.53 (273) | 0.131 | LLCTCO → phen, d–d | H–1 → L+2 (30%) | |
| LLCTphen → NA | H–4 → L+1 (28%) | |||
| π–π*phen | H–4 → L (18%) | |||
| 3 | 3.11 (399) | 0.069 | MLLCTCO-Re-OOC→phen | H → L+1 (70%) |
| 4.43 (280) | 0.048 | MLLCTCO-Re-OOC→phen | H–1 → L+2 (92%) | |
| 4.52 (274) | 0.134 | MLLCTCO-Re→phen | H–6 → L (51%) | |
| π–π*phen | H–5 → L (32%) |
The transition types are assigned based on the occupied and the virtual molecular orbitals ψo and ψv (shown in Figure 3 and Figure S1, respectively), defining the transition with normalized percent contributions listed in parentheses. Subscripts denote the main contributing moiety. (MMLCT = metal-to-metal-and-ligand charge transfer; MLLCT = metal-and-ligand-to-ligand charge transfer; LLCT = ligand-to-ligand charge transfer; and LMCT = ligand-to-metal charge transfer.)
Figure 3.

Energies of the frontier molecular orbitals of complexes 1, 2, and 3 in black, blue and magenta, respectively, in acetonitrile solvent. The molecular orbital spatial distributions are plotted with the isovalue of 0.03 au. Red and green isosurface colors denote + and – nodes, respectively. The lowest energy transition type and HOMO–LUMO energy gap (in eV) are given next to the arrows pointing the HOMO to LUMO excitation. The arrows ↑↓ denote the HOMO occupied by two spin-paired electrons. Magenta and blue dashed lines highlight the similarity of the spatial distributions of the dimer HOMO and LUMO with those of complexes 3 and 2, respectively. (MLLCT = metal-and-ligand-to-ligand charge transfer.)
The atomic charges of the Re atoms and ligands calculated using the Mulliken population analysis method44 are listed in Table 4 for complexes 1–3 in the SGS and LLTS optimized in acetonitrile solvent. In complexes 1–3, the bridging isonicotinate and acetate ligands are negatively charged (electron-rich) and the isonicotinate methyl ester is positively charged. Also, the Re atom coordinated to pyridine has nearly zero charge, and the Re atom coordinated to carboxylate is positively charged. In the dimer, the SGS to LLTS transition causes electron density transfer from the Re2 tricarbonyl moiety to the phenanthroline ligand at Re2, as evidenced from the Re2(CO)3 charge becoming more positive and the phenanthroline charge becoming less positive. In complexes 1 and 2, the SGS to LLTS transitions involve mainly electron transfer from the Re(CO)3 moiety to the phenanthroline ligand.
Table 4. Mulliken Charges of Re and Ligands of Complexes 1–3 in the Singlet Ground State (SGS) and Lowest-Lying Triplet State (LLTS) Optimized in Acetonitrile Solvent.
| complex | state | Q (Re) | Q (L) | Q (phen) | Q (CO) |
|---|---|---|---|---|---|
| 1 | SGS | 0.12a, 0.00b | –0.38 | 0.57a, 0.62b | –0.02a, 0.09b |
| LLTS | 0.11a, 0.24b | –0.34 | 0.57a, 0.17b | –0.02a, 0.26b | |
| 2 | SGS | –0.01 | 0.28 | 0.62 | 0.11 |
| LLTS | 0.22 | 0.32 | 0.19 | 0.27 | |
| 3 | SGS | 0.11 | –0.62 | 0.55 | –0.04 |
| LLTS | 0.38 | –0.46 | –0.12 | 0.20 |
Re1 coordinated to O(OOC).
Re2 coordinated to N(py).
The electronic character of the LLTS is assigned based on the spatial distributions of the spin density45 presented in Figure 4. According to Kasha’s rule,46 the LTTS would be the emitting state. Electron spin densities in these lowest-energy emitting states of complexes 1–3 are localized mainly on the Re-phen moieties, leading to the 3MLCT assignment. The dimer LLTS is mainly localized on Re2(CO)3phen with a minor localization at the Re1 moiety. These spatial distributions are also expressed as integrated spin densities and listed along with the LLTS energies in Table 5. The LLTS’s of complexes 1 and 2 are close in energy and spatial distribution. The LLTS of complex 3 has substantially lower energy and spin density at the phenanthroline ligand than the rest. The two lowest-lying triplet excited states T1(1) and T2(1) of the dimer and the lowest-lying triplet excited states T1(2) and T1(3) of complexes 2 and 3 calculated using TD-DFT at the SGS geometry are listed in Table 6. These Franck–Condon triplet excited states are multiplicity-forbidden and have oscillator strengths of zero.
Figure 4.

Electron spin density distributions around the complexes plotted at the isovalue of 0.003 e Å–3 for the LLTS of isolated complexes 1–3 in acetonitrile solvent. The α and β spin densities are shown as yellow and green color meshes, respectively.
Table 5. Energy (in eV and That in Parentheses in nm), Assignment, and Spin Density (ρs, in |e|) of the Lowest-Lying Triplet States (LLTS’s) of Isolated Complexes 1–3 in Acetonitrile Solventa.
| complex | LLTS | type | ρs (Re) | ρs (L) | ρs (phen) | ρs (CO) |
|---|---|---|---|---|---|---|
| 1 | 2.63 (472) | 3MLCTRe2phen | 0.01b, 0.60c | 0.02 | 0.00b, 1.27c | 0.00b, 0.10c |
| 2 | 2.65 (469) | 3MLCTRephen | 0.58 | 0.02 | 1.30 | 0.10 |
| 3 | 2.30 (538) | 3MLCTRephen | 0.71 | 0.11 | 1.04 | 0.14 |
The LLTS type is assigned based on the distribution of the two unpaired electrons among the Re atom and the 1,10-phenanthroline (phen), CO, and the ligand L denoting nicotinic acid and its model compounds. The spatial spin density distributions are presented graphically in Figure 4.
Re1 coordinated to O(OOC).
Re2 coordinated to N(py).
Table 6. Franck–Condon Triplet Excited States (TN) (in eV and Those in Parentheses in nm) with Oscillator Strengths (f) of Isolated Complexes 1–3 in Acetonitrile Solvent Calculated at the SGS Geometrya.
| state | TES | f | type | transition, ψo → ψv |
|---|---|---|---|---|
| T1(1) | 2.64 (470) | 0.000 | MLLCTRe1-OOC→phen(Re1) | H → L+1 (49%) |
| MLLCTphen-OOC-Re1→phen(Re1), π–π*phen(Re1) | H–6 → L+3 (18%) | |||
| MLLCTRe1-OOC→phen(Re1)-py-CO(Re2) | H–1 → L+3 (11%) | |||
| T2(1) | 2.71 (457) | 0.000 | MLCTRe2→phen, π–π*phen | H–8 → L+2 (32%) |
| MMLCTCO-Re2→phen(Re2) | H–4 → L (31%) | |||
| MLLCTCO-Re2-NA→phen(Re2) | H–3 → L+2 (22%) | |||
| T1(2) | 2.72 (456) | 0.000 | MLCTRe→phen, π–π*phen | H–3 → L+2 (32%) |
| MLLCTCO-Re→phen | H–1 → L (30%) | |||
| MLLCTCO-Re→phen | H → L+2 (23%) | |||
| T1(3) | 2.57 (483) | 0.000 | MLLCTCO-Re-OOC→phen | H → L (74%) |
The transition types are assigned based on the occupied and virtual molecular orbitals ψo and ψv, respectively, defining the transition with normalized percent contributions listed in parentheses. The diagrams of the occupied and virtual molecular orbitals are shown in Figure 3 and in the Supporting Information, Figure S1. Subscripts denote the main contributing moiety. (MMLCT = metal-to-metal-and-ligand charge transfer; MLLCT = metal-and-ligand-to-ligand charge transfer.)
The CAM-B3LYP results overestimate the SES energies by approximately 0.5 eV relative to both B3PBE SES’s and absorption spectra. The LLTS energies calculated using CAM-B3LYP are higher than the respective B3PBE LLTS and experimental emission energies by 0.02–0.04 and 0.4–0.5 eV, respectively. The spatial distributions of the molecular orbitals computed using the B3PBE and CAM-B3LYP functionals are similar. The CAM-B3LYP results are presented in the Supporting Information, Tables S3–S6 and Figures S2 and S3.
Discussion
The isonicotinate-bridged rhenium(I) tricarbonyl complex, [fac(CO)3(phen)Re2-N(4-COOCH3-py)COORe1(phen)fac(CO)3]+, has been linked together by way of a pyridine linkage to one rhenium center and an acetate linkage to the other one. In addition, the monomers [fac(CO)3(phen)Re-N(4-COOCH3-py)]+ and [Re(phen)(CO)3(OAc)] are individually coordinated with Re by the N atom of pyridine and the O atom of acetyl monomeric ligands. The dimer complex 1 consists of two components represented by complexes 2 and 3 but exhibits emission properties similar to those of complex 2. The monomers 2 and 3 emit energy in acetonitrile at 580 and 650 nm, respectively. Rather than emitting at the lower energy exhibited by the acetate-bonded monomer 3, the dimer emits at the higher energy of 575 nm exhibited by the pyridine-bonded monomer 2. To determine the reason for this unexpected and unusual behavior, computational studies were employed.
In Figure 3, the HOMO and LUMO of the dimer are localized on the Re1(COAx)(phen)(COO) and Re2(COEq)(phen)N(py) moieties, respectively, indicating that the HOMO to LUMO transition would be a charge transfer over a distance of approximately 9.3 Å. Visual comparison of the HOMOs and LUMOs of complexes 1–3 highlights that the HOMOs of complexes 1 and 3 and the LUMOs of complexes 1 and 2 are localized on analogous moieties and close in energy. These similarities are highlighted with dashed magenta and blue lines for the HOMOs and the LUMOs, respectively. The dimer HOMO–LUMO energy gap is very close to that of complex 3, highlighting the contribution of the carboxylate moiety to both the HOMO and lowest-energy electronic transition. The HOMO and HOMO–1 orbitals of complexes 1–3 are localized on the Re-CO moiety and close in energy. Among the lower-lying HOMOs, we point out the HOMO–3 of the dimer and HOMO–5 of complex 2 that are localized on the nicotinate ligand and HOMO–3 of complex 3 localized on the acetate moiety. The dimer LUMO to LUMO+5 exhibit alternating localization at the Re1-phen and Re2-phen moieties with the notable exception of LUMO+4 that is localized on the bridging isonicotinate ligand and would facilitate the Re–Re charge transfer. In terms of its localization, the dimer LUMO+4 is similar to the LUMO+1, LUMO+4, and LUMO+5 of complex 2. The LUMO+2 and LUMO+3 of complex 2 are localized on the Re-phen moiety. In complex 3, the LUMO to LUMO+2 and LUMO+4 are mainly localized on the phenanthroline ligand with a partial Re character, and the LUMO+3 and LUMO+5 are localized on the Re-tricarbonyl moiety.
Absorption
The energy and oscillator strength of the calculated SES are presented in an overlay with the experimental absorption spectra in acetonitrile solvent in Figure 5. This correlation is also evident from comparison of the absorption spectra peak energies listed in Table 1 and the SES listed in Table 3. The oscillator strength, indicated by the height of the drop line, is proportional to the molar absorption coefficient.47 The SES’s are listed in Table 3 and assigned based on the molecular orbital distributions presented in Figure 3 and the Supporting Information, Figure S1.
Figure 5.

Experimental absorption spectra overlaid with singlet excited states (SES) of complexes 1–3 in acetonitrile solvent at room temperature. The SES oscillator strength is denoted as f on the right-hand-side axes labels.
For the dimer, it is important to note that the Re–Re charge transfer SES’s have particularly low oscillator strengths. Only the SES at 3.24 eV with a contribution from a Re–Re transition (HOMO-1 to LUMO) has notable oscillator strength. The MLLCT SES at 3.84 eV that has the highest oscillator strength among the charge transfer SES with a metal character (HOMO–3 to LUMO+4) involves transition to LUMO+4 localized on the bridging ligand. Although with lower oscillator strength, the dimer SES at 3.55 eV also involves transition to LUMO+4. Rhenium-nicotinate SES’s are also dominant in complex 2 at 3.49 eV (HOMO to LUMO+1) and 3.60 eV (HOMO–1 to LUMO+1). In complex 2, the lowest-energy SES at 3.26 eV is based on the HOMO to LUMO transition. In complex 3, the low-energy MLLCT SES’s are based on transitions involving the acetate moiety, and the high-energy states have a π–π* character in the CO and 1,10-phenanthroline moieties. The lowest-energy SES’s of the dimer are close to those of complex 3 and lower than those of complex 2 in correlation with the energy gaps highlighted in Figure 3.
Emission
The energies of the Franck–Condon triplet excited states calculated at the SGS geometry as well as the SGS’s and LLTS’s of complexes 1–3 are presented in Figure 6 along with the major contributing electronic transitions (Table 6). The Franck–Condon triplet excited states T1(1) and T2(1) of the dimer are aligned with T1(3) and T1(2), respectively, in terms of both energy and the localization of the molecular orbitals contributing to the electronic transitions. The T1(1) state at 2.64 eV arises predominantly from electronic transition localized mainly on the Re1-acetate moiety that is represented by complex 3 with a T1(3) energy of 2.57 eV. The T2(1) state at 2.71 eV arises from two major transitions (Table 6) localized mainly on the Re2-nicotinate moiety that is represented by complex 2 with a T1(2) energy of 2.72 eV.
Figure 6.

Calculated singlet ground state (SGS), vertical triplet excited state (TN), and lowest-lying triplet state (LLTS) energies of complexes 1–3 in acetonitrile solvent (left). Spatial distributions of the molecular orbitals contributing to the TN transitions plotted at the isovalue of 0.03 au (right). Red and green isosurface colors denote + and – nodes, respectively (EEm = experimental emission energy).
Upon geometry optimization, the dimer LLTS converges on the Re2-nicotinate-localized state (Figure 4) that is close in both energy and character to the LLTS of complex 2. The LLTS of complexes 1 and 2 undergo comparable energy stabilization of 0.7–0.8 eV relative to the respective T2(1) and T1(2) states, as highlighted with dotted lines in Figure 6 and listed in Tables 5 and 6. The dimer T1(1) state at 2.64 eV that is localized on the Re1-acetate moiety represented by complex 3 is unstable, and it is neither the LLTS nor an emitting state. Complex 3 undergoes a more substantial stabilization (highlighted with a dotted line) of 0.26 eV upon LLTS geometry optimization relative to the T1(3) state (Tables 5 and 6). The experimental emission energies (Table 1) are shown in Figure 6 to highlight that these are consistently lower than those of the LLTS by 0.40–0.45 eV.
In the emitting LLTS of the dimer, the Re1–Re2 distance is shortened to 9.30 Å (Table 2) and the electron spin density is localized on the Re2-(phen) moiety (Figure 4). The unusual emission behavior of the dimer arises from the presence of two Re(I) coordination sites that support long-distance charge transfer and charge separation as well as the presence of the bridging isonicotinate ligand. The geometry optimization results clearly show that the LLTS energies of the dimer and complex 2 are not only closely aligned and but also higher than those of the LLTS of complex 3. The emitting state of the dimer is stabilized effectively by the bridging or transport orbitals HOMO–8 and HOMO–3 (Figure 6) that are partially localized on the nicotinate moiety between the Re1 and Re2 centers. Understanding the unusual emission behavior of this dimer would be useful for the design of improved photosensitive dyes as part of thin-film photoelectrochemical solar cells.
Conclusions
In conclusion, we have described the synthesis of a rhenium(I) dimer and its model monomers in which the dimer, [fac(CO)3(phen)Re-N(py)COORe(phen)fac(CO)3]+, consists of two components, [fac(CO)3(phen)Re-N(py)]+ and [CH3COORe(phen)fac(CO)3], but exhibits absorption and emission properties different from those of the model monomers. The pyridine- and acetate-containing monomers emit at 580 and 650 nm, respectively, in acetonitrile. Rather than emitting at a lower energy exhibited by the acetate-bonded monomer, the dimer emits at a higher energy (570 nm) exhibited by the nitrogen-bonded component. Computational studies employed to determine the reason for this unexpected and unusual behavior indicate that the emitting state of the dimer complex 1 is stabilized as the LLTS at an energy close to that of complex 2 due to its long-distance charge transfer character. The excited state of the dimer that is localized on the Re1-acetate moiety represented by the model complex 3 is unstable and not emitting. The large distance between the Re-chromophores, the participation of molecular orbitals localized on the bridging ligand, and the high contribution of long-range charge transfer transitions provide spatioenergetic separation of the two chromophores in the dimer and the respective SGS and LLTS.
The computational studies also yield optimized geometries and SES’s in agreement with the crystal structure determinations and absorption spectra, respectively. In addition, the molecular orbitals, spin densities, and charges corroborate to providing a detailed interpretation of the absorption and emission properties of the dimer complex 1 with respect to the model complexes 2 and 3. The correlated computational and experimental results provide insights into the unusual emission behavior of the dimer and mechanism of stabilization of the emitting state at high energy. These insights are valuable for improving the design of photosensitive dyes, which are important components of photoelectrochemical solar cells. The complex emission behavior of the dimer would be attractive for a complete active space self-consistent field (CASSCF) study that would account for spin–orbit coupling.
Experimental Section
Materials
Rhenium(I) pentacarbonyl chloride, silver trifluoromethanesulfonate, and IR-grade potassium bromide were purchased from Aldrich. Diethyl ether, HPLC-grade methanol, and optima-grade acetonitrile were purchased from Fisher Scientific. Absolute ethanol was obtained from AAPER. The solvents, methanol, hexanes, and acetonitrile were obtained from Fisher. The compound 1,10-phenanthroline (phen) was obtained from GFS. Deuterated solvents, CDCl3, CD3OD, and (CD3)2S=O, were obtained from Cambridge Isotopes. Diethyl ether, HPLC-grade methanol, methylene chloride, hexanes, and optima-grade acetonitrile for UV–visible spectral determinations were purchased from Fisher Scientific. Acetonitrile was used as solvent for absorption and emission studies. Electrochemical grade tetrabutylammonium hexafluorophosphate was purchased from Southwestern Analytical. A ferrocene standard used in electrochemical studies was purchased from Aldrich. Dried acetonitrile used as a electrochemical background was contained in a Sure/Seal bottle and was purchased from Aldrich.
Instrumentation and Physical Measurements
The IR spectra were acquired using a Nicolet Avatar 360 FT-IR spectrophotometer. Proton NMR spectra were obtained using a Varian Inova 400 FT-NMR spectrometer. Elemental (C, H, and N) analysis was performed by Columbia Analytical Services, Tucson, Arizona.
An EG&G PAR Model 263A potentiostat/galvanostat was used to obtain the cyclic and differential-pulse voltammograms. The measurements were carried out in a typical H-cell using a platinum-disc working electrode, platinum-wire counter electrode, and Ag/AgNO3 reference electrode in dichloromethane. The supporting electrolyte used was 0.1 M tetrabutylammonium hexafluorophosphate (TBAPF6). Ferrocene was added as the reference. Absorption profile and extinction studies were carried out using a Shimadzu UV-2550 spectrophotometer. All solution samples were prepared using spectral grade acetonitrile or freshly distilled butyronitrile.
Emission spectra, excitation spectra, and emission lifetimes were obtained using a FL3-2iHR Nanolog spectrometer from Horiba Jobin Yvon Technologies. Solutions with an absorbance of ∼0.1 at the λmax of each complex in butyronitrile were placed in Pyrex tubes (5 mm in o.d. and 3 mm in i.d.) and degassed by freeze–pump–thaw. After the final degassing, the glassy samples were placed in a Dewar located in the cavity of the spectrometer and maintained at 77 K during measurements. Emission spectra were collected at the λmax of the MLCT bands; excitation spectra were obtained at the emission maximum for each compound. A NanoLED-460 pulsed diode light source was used in all lifetime decay determinations. In this case, the excitation wavelength used was set to 457 nm, the absorption maximum for the NanoLED-460 light source. Emission curve fitting was performed using the Origin Pro 8 program via non-linear curve-fitting modes.
Computational Technique
The combination of Becke’s three-parameter hybrid functional, a non-local exchange term of Becke, and the local correlation term of Vosko, Wilk, and Nusair (VWN)48 (as in B3LYP) with the non-local correlation of Perdew, Burke, and Ernzerhof (PBE)49 (as in PBE0) implemented in the Gaussian 16 computational software suite50 was employed and referred in the text as B3PBE. This functional was found to produce optimized metal–ligand distances and singlet excited states in good agreement with PBE0 and B3LYP functionals, respectively, as well as with experimental X-ray diffraction and absorption spectra.51 The long-range-corrected version of B3LYP implemented in the CAM-B3LYP functional was also employed.52
The geometry optimization was conducted using the conductor-like polarizable continuum model (CPCM) for solvation in acetonitrile solvent.53,54 The electronic singlet ground state (SGS) and lowest-lying triplet state (LLTS) for each complex were fully optimized using restricted singlet and unrestricted triplet B3PBE’s, respectively. After each geometry optimization, the second-order force constant matrix was calculated to confirm that the optimized geometry was the true minimum on the potential energy surface. The initial structures were taken from the X-ray diffraction structure determinations.
For excited-state calculations, the tandem of the non-equilibrium TD-DFT55,56 and CPCM methods was employed as implemented in Gaussian 16 software.50 Eighty singlet excited-states were computed for the dimer complex and 40 for each of the monomer complexes in acetonitrile solvent based on the respective optimized SGS geometries in acetonitrile solvent. Also, 10 triplet excited states were computed for each complex based on the respective optimized SGS geometries in acetonitrile solvent. The excited states were calculated using a linear response form and a self-consistent reaction field around the solute employed by the tandem TD-DFT and CPCM approach.57,58 The excited-state energies calculated using TD-DFT/CPCM were known to exhibit a linear correlation with experimental UV–vis spectra as we32,51,59 and others have shown.60−62
The all-electron triple-ζ def2-TZVP basis set was applied for H, C, N, and O atoms.63,64 This basis set performs better than most of the 6-311G series basis sets.65 The quadruple-ζ QZV effective core potential and quadruple-ζ QZVP (def2-QZVP) basis set were used for the Re atom core and valence shells, respectively.63,64 This combination of basis sets was referred in the text as TZVP-QZV-P. GaussView 6.0 visualization software was used to generate the molecular orbital and spin density isosurfaces.66
Preparation of Compounds
{[Re(phen)(CO)3]2(isonic)}(CF3SO3) (1)
Re(phen)(CO)3Cl (0.12 g, 0.25 mmol) was added to a clean 100 mL round-bottom flask containing AgCF3SO3 (0.05 g, 0.19 mmol), a stir bar, and 50 mL of absolute ethanol. This solution was allowed to reflux for 6 h at room temperature. At the end of the reflux, the round-bottom flask was removed from the condenser, and the solution was vacuum-filtered to remove the silver chloride. The yellow filtrate was transferred to a clean 100 mL round-bottom flask containing a stir bar and isonicotinic acid (0.072 g, 0.58 mmol). This mixture was allowed to reflux overnight under nitrogen gas. At the end of the reflux, the round-bottom flask was removed from the condenser and placed on a rotary evaporator to remove some of the solvent. A glass stopper was placed on the flask, which was then stored in the freezer overnight. It was then removed from the freezer and allowed to reach room temperature at which point yellow crystals started to form. These crystals were isolated and stored for characterization.
Color: light yellow, 82.0% anal. calcd for Re2C37H20N5O11SF3·3H2O: C, 36.24; H, 2.12; N, 5.71. Found: C, 36.89; H, 2.13; N, 5.79. IR (KBr pellet, cm–1): (CO) 2028 sh, 1915 sh; 1H NMR (DMSO, 300 MHz): (phen) δ ppm 8.03 (q, 2H, J = 5.1 Hz), 8.15 (q, 2H, J = 5.1 Hz), 8.22 (s, 2H), 8.25 (s, 2H), 8.93 (td, 4H J = 6.6, 1.5 Hz), 9.38 (dd, 2H J = 5.1, 1.8 Hz), 9.58 (dd, 2H, J = 5.1, 1.2 Hz); py, 6.79 (d, 2H, J = 6.6 Hz), 8.18 (d, 2H, J = 6.6 Hz).
Preparation of [Re(phen)(CO)3(4-COOCH3-py)](PF6) (2)
To a clean 100 mL round-bottom flask equipped with a stir bar, Re(phen)(CO)3Cl (0.25 g, 0.50 mmol) and AgCF3SO3 (0.13 g, 0.50 mmol) were added along with 20 mL of ethanol. This solution was allowed to reflux for 12 h under nitrogen gas. After refluxing for roughly 2 h, a gray AgCl precipitate was present. At the end of the reflux, the round-bottom flask was removed from the condenser, and the solution was vacuum-filtered to remove the silver chloride. The yellow filtered solution was transferred to a clean 100 mL round-bottom flask with a stir bar and methyl isonicotinate (100 μL, 1.6 equiv). This solution was allowed to reflux overnight under nitrogen gas. The solution remained yellow during reflux. To the reflux solution cooled to room temperature, a solution of NH4PF6 in water was added, and the mixture was stirred at room temperature for 5–10 min. At the end of 5–10 min, the flask was placed on a rotary evaporator, and the solution was condensed to 2 mL and placed in the freezer overnight. The product formed was vacuum filtered and stored for characterization.
Color: light yellow, 78.0%. anal. calcd for ReC23H15O8N3F3S: C, 36.07; H, 2.05; N, 5.74. Found: C, 35.89; H, 2.14; N, 5.6; IR (KBr pellet, cm–1): (CO) 2018 sh, 1932 sh, 1732. 1H NMR (DMSO, 400 MHz): (phen) δ ppm 8.30 (dd, 2H, J = 8.8, 5.2 Hz), 8.65 (s, 2H), 9.08 (dd, 2H, J = 6.4, 1.6 Hz), 9.72 (dd, 2H, J = 6.4, 1.6 Hz), py, 7.62 (d, 2H, J = 6.4 Hz), 8.65 (d, 2H, J = 6.4 Hz), 3.76 (s, 3H, CH3).
Re(phen)(CO)3(OAc) (3)
To a clean 100 mL round-bottom flask containing 20 mL of ethanol and a stir bar, Re(phen)(CO)3Cl (0.20 g, 0.41 mmol) and AgCF3SO3 (0.105 g, 0.41 mmol) were added. This solution was allowed to reflux for 8 h under nitrogen gas. After refluxing for roughly 2 h, a gray AgCl precipitate was present. At the end of the reflux, the round-bottom flask was removed from the condenser, and the solution was vacuum-filtered to remove the silver chloride. The yellow filtrate was transferred to a clean 100 mL round-bottom flask with a stir bar and tetrabutylammonium acetate (0.094 g, 0.31). The solution was allowed to reflux overnight under nitrogen gas. At the end of the reflux, the round-bottom flask was removed from the condenser and placed on a rotary evaporator to remove the solvent. The remaining residue was purified on a silica gel chromatography column (5:95 CH3OH:CH2Cl2) affording a yellow solid.
Color: light yellow, 84.0% anal. calcd for ReC17H11O5N2: C, 40.07; H, 2.16; N, 5.50 Found: C, 40.00; H, 2.15; N, 5.51. IR (KBr pellet, cm–1): (CO) 2018 sh, 1932 sh, 1732; 1H NMR (DMSO): (phen) δ ppm 7.85 (q, 2H, J = 2.8 Hz), 8.00 (s, 2H), 8.27 (s, 2H), 8.52 (dd, 1H, J = 6.4 1.6 Hz), 9.53 (dd, 1H, J = 5.2, 2.0 Hz), CH3 1.44 (s, 3H).
Acknowledgments
We thank the Wichita State University Office of Research Administration, Kansas, NSF EPSCoR, and the Department of Energy for support. S.R.S. acknowledges the support of the Program for Energy Research and Development of the Government of Canada. S.R.S. thanks Dr. John M. Villegas for the helpful comments on the presentation of the results. The computations are performed at the Compute/Calcul Canada and Western Canada Research Grid WestGrid high-performance computing facilities. S.R.S. holds an adjunct professor appointment at the Department of Chemical and Materials Engineering, University of Alberta, Edmonton, Alberta, Canada.
Supporting Information Available
The Supporting Information is available free of charge at https://pubs.acs.org/doi/10.1021/acsomega.0c00704.
Synthesis, X-ray crystal structures, excited states, and molecular orbitals (PDF)
Author Contributions
# S.R.S. and V.K. contributed equally to this work.
The authors declare no competing financial interest.
Supplementary Material
References
- Wrighton M.; David L. M. Nature of the lowest excited state in tricarbonylchloro-1,10-phenanthrolinerhenium(I) and related complexes. J. Am. Chem. Soc. 1974, 96, 998–1003. 10.1021/ja00811a008. [DOI] [Google Scholar]
- Giordano P. J.; Fredericks S. M.; Wrighton M. S.; Morse D. L. Simultaneous Multiple Emissions from Fac-XRe(CO)3(3-Benzoylpyridine)2: N-Π* Intraligand and Charge-Transfer Emission at Low Temperature. J. Am. Chem. Soc. 1978, 100, 2257–2259. 10.1021/ja00475a061. [DOI] [Google Scholar]
- Fredericks S. M.; Luong J. C.; Wrighton M. S. Multiple Emissions from Rhenium(I) Complexes: Intraligand and Charge-Transfer Emission from Substituted Metal Carbonyl Cations. J. Am. Chem. Soc. 1979, 101, 7415–7417. 10.1021/ja00518a054. [DOI] [Google Scholar]
- Lees A. J. Luminescence Properties of Organometallic Complexes. Chem. Rev. 1987, 87, 711–743. 10.1021/cr00080a003. [DOI] [Google Scholar]
- Kirgan R. A.; Patrick Sullivan B.; Rillema D. P.. Photochemistry and Photophysics of Coordination Compounds: Rhenium. In Topics in Current Chemistry; Balzani V.; Campagna S. (Eds.); Vol. 281, Springer: New York, 2007, 45–100. [Google Scholar]
- Morimoto T.; Ito M.; Koike K.; Kojima T.; Ozeki T.; Ishitani O. Dual Emission from Rhenium(I) Complexes Induced by an Interligand Aromatic Interaction. Chem. - A Eur. J. 2012, 18, 3292–3304. 10.1002/chem.201102698. [DOI] [PubMed] [Google Scholar]
- Hostachy S.; Policar C.; Delsuc N. Re(I) Carbonyl Complexes: Multimodal Platforms for Inorganic Chemical Biology. Coord. Chem. Rev. 2017, 351, 172–188. 10.1016/j.ccr.2017.05.004. [DOI] [Google Scholar]
- Lehn J.-M.; Ziessel R. Photochemical Generation of Carbon Monoxide and Hydrogen by Reduction of Carbon Dioxide and Water under Visible Light Irradiation. Proc. Natl. Acad. Sci. U. S. A. 1982, 79, 701–704. 10.1073/pnas.79.2.701. [DOI] [PMC free article] [PubMed] [Google Scholar]
- Kumar B.; Smieja J. M.; Kubiak C. P. Photoreduction of CO2 on P-Type Silicon Using Re(Bipy-Bu t)(CO)3Cl: Photovoltages Exceeding 600 MV for the Selective Reduction of CO2 to CO. J. Phys. Chem. C 2010, 114, 14220–14223. 10.1021/jp105171b. [DOI] [Google Scholar]
- Kumar B.; Smieja J. M.; Sasayama A. F.; Kubiak C. P. Tunable, Light-Assisted Co-Generation of CO and H2 from CO2 and H2O by Re(Bipy-Tbu)(CO)3Cl and p-Si in Non-Aqueous Medium. Chem. Commun. 2012, 48, 272–274. 10.1039/C1CC16024A. [DOI] [PubMed] [Google Scholar]
- Bruckmeier C.; Lehenmeier M. W.; Reithmeier R.; Rieger B.; Herranz J.; Kavakli C. Binuclear Rhenium(I) Complexes for the Photocatalytic Reduction of CO2. Dalt. Trans. 2012, 41, 5026–5037. 10.1039/c2dt30273j. [DOI] [PubMed] [Google Scholar]
- Portenkirchner E.; Oppelt K.; Ulbricht C.; Egbe D. A. M.; Neugebauer H.; Knör G.; Sariciftci N. S. Electrocatalytic and Photocatalytic Reduction of Carbon Dioxide to Carbon Monoxide Using the Alkynyl-Substituted Rhenium(I) Complex (5,5′- Bisphenylethynyl-2,2′-Bipyridyl)Re(CO)3Cl. J. Organomet. Chem. 2012, 716, 19–25. 10.1016/j.jorganchem.2012.05.021. [DOI] [Google Scholar]
- Sahara G.; Ishitani O. Efficient Photocatalysts for CO2 Reduction. Inorg. Chem. 2015, 54, 5096–5104. 10.1021/ic502675a. [DOI] [PubMed] [Google Scholar]
- Amoroso A. J.; Coogan M. P.; Dunne J. E.; Fernández-Moreira V.; Hess J. B.; Hayes A. J.; Lloyd D.; Millet C.; Pope S. J. A.; Williams C. Rhenium Fac Tricarbonyl Bisimine Complexes: Biologically Useful Fluorochromes for Cell Imaging Applications. Chem. Commun. 2007, 29, 3066–3068. 10.1039/B706657K. [DOI] [PubMed] [Google Scholar]
- Cao Q.; Creely C. M.; Davies E. S.; Dyer J.; Easun T. L.; Grills D. C.; McGovern D. A.; McMaster J.; Pitchford J.; Smith J. A.; et al. Excited State Dependent Electron Transfer of a Rhenium-Dipyridophenazine Complex Intercalated between the Base Pairs of DNA: A Time-Resolved UV-Visible and IR Absorption Investigation into the Photophysics of Fac-[Re(CO)3(F2dppz)(Py)]+ Bound to Either [poly(dA-dT)]2 or [poly(dG-dC)]2. Photochem. Photobiol. Sci. 2011, 10, 1355–1364. 10.1039/C1PP05050H. [DOI] [PubMed] [Google Scholar]
- Zhao G.-W.; Zhao J.-H.; Hu Y.-X.; Zhang D.-Y.; Li X. Recent Advances of Neutral Rhenium(I) Tricarbonyl Complexes for Application in Organic Light-Emitting Diodes. Synth. Met. 2016, 212, 131–141. 10.1016/j.synthmet.2015.12.014. [DOI] [Google Scholar]
- Argazzi R.; Murakami Iha N. Y.; Zabri H.; Odobel F.; Bignozzi C. A. Design of Molecular Dyes for Application in Photoelectrochemical and Electrochromic Devices Based on Nanocrystalline Metal Oxide Semiconductors. Coord. Chem. Rev. 2004, 248, 1299–1316. 10.1016/j.ccr.2004.03.026. [DOI] [Google Scholar]
- Wrighton M. S.; Geoffroy G. L.. Organometallic Photochemistry; Academic Press: New York, 1979. [Google Scholar]
- Balzani V.; Juris A.; Venturi M.; Campagna S.; Serroni S. Luminescent and Redox-Active Polynuclear Transition Metal Complexes. Chem. Rev. 1996, 96, 759–834. 10.1021/cr941154y. [DOI] [PubMed] [Google Scholar]
- Meyer G. J. Molecular Approaches to Solar Energy Conversion with Coordination Compounds Anchored to Semiconductor Surfaces. Inorg. Chem. 2005, 44, 6852–6864. 10.1021/ic0505908. [DOI] [PubMed] [Google Scholar]
- Stoyanov S. R.; Titov A. V.; Král P. Transition Metal and Nitrogen Doped Carbon Nanostructures. Coord. Chem. Rev. 2009, 253, 2852–2871. 10.1016/j.ccr.2009.03.011. [DOI] [Google Scholar]
- Wright I. A. Phosphorescent Molecular Metal Complexes in Heterojunction Solar Cells. Polyhedron 2018, 140, 84–98. 10.1016/j.poly.2017.11.050. [DOI] [Google Scholar]
- Glazer E. C.; Magde D.; Tor Y. Dual Emission from a Family of Conjugated Dinuclear RuII Complexes. J. Am. Chem. Soc. 2005, 127, 4190–4192. 10.1021/ja0440304. [DOI] [PubMed] [Google Scholar]
- Sun S.-S.; Tran D. T.; Zavalij P. Y.; Oliver S. R. J.; Lees A. J. A Dinuclear Rhenium Complex, {[(C18 H24 N2 )Re(CO)3 ]2(μ-C12H12N2)}(PF6)2 2CH2Cl2. Acta Crystallogr. Sect. E Struct. Reports Online 2003, 59, m134–m136. 10.1107/S1600536803004094. [DOI] [Google Scholar]
- Wilting A.; Stolper T.; Mata R. A.; Siewert I. Dinuclear Rhenium Complex with a Proton Responsive Ligand as a Redox Catalyst for the Electrochemical CO2 Reduction. Inorg. Chem. 2017, 56, 4176–4185. 10.1021/acs.inorgchem.7b00178. [DOI] [PubMed] [Google Scholar]
- Panigati M.; Mauro M.; Donghi D.; Mercandelli P.; Mussini P.; De Cola L.; D’Alfonso G. Luminescent Dinuclear Rhenium(I) Complexes Containing Bridging 1,2-Diazine Ligands: Photophysical Properties and Application. Coord. Chem. Rev. 2012, 256, 1621–1643. 10.1016/j.ccr.2012.03.006. [DOI] [Google Scholar]
- Veronese L.; Procopio E. Q.; De Rossi F.; Brown T. M.; Mercandelli P.; Mussini P.; D’Alfonso G.; Panigati M. New Dinuclear Hydrido-Carbonyl Rhenium Complexes Designed as Photosensitizers in Dye-Sensitized Solar Cells. New J. Chem. 2016, 40, 2910–2919. 10.1039/C5NJ03000E. [DOI] [Google Scholar]
- Hung C.-Y.; Singh A. S.; Chen C.-W.; Wen Y.-S.; Sun S.-S. Colorimetric and Luminescent Sensing of F- Anion through Strong Anion-π Interaction inside the π-Acidic Cavity of a Pyridyl-Triazine Bridged Trinuclear Re(I)-Tricarbonyl Diimine Complex. Chem. Commun. 2009, 12, 1511–1513. 10.1039/B820234F. [DOI] [PubMed] [Google Scholar]
- Lundin N. J.; Walsh P. J.; Howell S. L.; McGarvey J. J.; Blackman A. G.; Gordo K. C. Complexes of Functionalized Dipyrido[3,2-a:2′,3′-c]-Phenazine: A Synthetic, Spectroscopic, Structural, and Density Functional Theory Study. Inorg. Chem. 2005, 44, 3551–3560. 10.1021/ic050179k. [DOI] [PubMed] [Google Scholar]
- Huertos M. A.; Pérez J.; Riera L.; Díaz J.; López R. From Bis(N-Alkylimidazole) to Bis(NH-NHC) in Rhenium Carbonyl Complexes. Angew. Chemie - Int. Ed. 2010, 44, 6409–3560. 10.1021/ic050179k. [DOI] [PubMed] [Google Scholar]
- Gayfulin Y. M.; Smolentsev A. I.; Kozlova S. G.; Yanshole V. V.; Mironov Y. V. Synthesis, Structure and DFT Calculations of the First Bioctahedral Chalcohalide Rhenium Cluster Complex (Et4N)4(Me2NH2)2[Re12CS17Br6]. Polyhedron 2014, 68, 334–339. 10.1016/j.poly.2013.11.014. [DOI] [Google Scholar]
- Stoyanov S. R.; Villegas J. M.; Cruz A. J.; Lockyear L. L.; Reibenspies J. H.; Rillema D. P. Computational and Spectroscopic Studies of Re(I) Bipyridyl Complexes Containing 2,6-Dimethylphenylisocyanide (CNx) Ligand. J. Chem. Theory Comput. 2005, 1, 95–106. 10.1021/ct049956g. [DOI] [PubMed] [Google Scholar]
- Villegas J. M.; Stoyanov S. R.; Huang W.; Rillema D. P. Photophysical, Spectroscopic, and Computational Studies of a Series of Re(I) Tricarbonyl Complexes Containing 2,6-Dimethylphenylisocyanide and 5- and 6-Derivatized Phenanthroline Ligands. Inorg. Chem. 2005, 44, 2297–2309. 10.1021/ic048786f. [DOI] [PubMed] [Google Scholar]
- Villegas J. M.; Stoyanov S. R.; Huang W.; Rillema D. P. A Spectroscopic and Computational Study on the Effects of Methyl and Phenyl Substituted Phenanthroline Ligands on the Electronic Structure of Re(1)Tricarbonyl Complexes Containing 2,6-dimethylphenylisocyanide. Dalt. Trans. 2005, 1042–1051. 10.1039/b415079a. [DOI] [PubMed] [Google Scholar]
- Li X.; Liu X.; Wu Z.; Zhang H. DFT/TDDFT Studies on the Electronic Structures and Spectral Properties of Rhenium(I) Pyridinybenzoimidazole Complexes. J. Phys. Chem. A 2008, 112, 11190–11197. 10.1021/jp805758n. [DOI] [PubMed] [Google Scholar]
- Kim T. Y.; Elliott A. B. S.; Shaffer K. J.; John McAdam C.; Gordon K. C.; Crowley J. D. Rhenium(I) Complexes of Readily Functionalized Bidentate Pyridyl-1,2,3-Triazole “Click” Ligands: A Systematic Synthetic, Spectroscopic and Computational Study. Polyhedron 2013, 52, 1391–1398. 10.1016/j.poly.2012.05.003. [DOI] [Google Scholar]
- Cannizzo A.; Blanco-Rodríguez A. M.; El Nahhas A.; Şebera J.; Záliş S.; Vlçek A. Jr.; Chergui M. Femtosecond Fluorescence and Intersystem Crossing in Rhenium(I) Carbonyl-Bipyridine Complexes. J. Am. Chem. Soc. 2008, 130, 8967–8974. 10.1021/ja710763w. [DOI] [PubMed] [Google Scholar]
- Gabrielsson A.; Busby M.; Matousek P.; Towrie M.; Hevia E.; Cuesta L.; Perez J.; Záliş S.; Vlçek A. Electronic Structure and Excited States of Rhenium(I) Amido and Phosphido Carbonyl-Bipyridine Complexes Studied by Picosecond Time-Resolved IR Spectroscopy and DFT Calculations. Inorg. Chem. 2006, 45, 9789–9797. 10.1021/ic0614768. [DOI] [PubMed] [Google Scholar]
- Rillema P.; Eichhorn D.; Yoder J.; Bullinger J. Rhenium tricarbonyl 1,10-phenanthroline-isonicotinate-rhenium tricarbonyl 1,10-phenanthroline (trifluoromethyl sulfonate). CSD Communications 2019, 1916078. 10.5517/ccdc.csd.cc229tz6b. [DOI] [Google Scholar]
- Rillema D. P.; Moore C.; KomReddy V. Rhenium tricarbonyl 1,10-phenanthroline methylisocyanate (PF6). CSD Communications 2019, 1916069. 10.5517/ccdc.csd.cc229tpxc. [DOI] [Google Scholar]
- Rillema D. P.; Moore C.; KomReddy V. Rhenium tricarbonyl 1,10-phenanthroline acetate. CSD Communications 2019, 1963586. [Google Scholar]; http://www.ccdc.cam.ac.uk/services/structures?pid=ccdc:1963586
- Lin R.; Fu Y.; Brock C. P.; Guarr T. F. Structural, Spectroscopic, and Electrochemical Investigation of Luminescent Bimetallic Complexes of Rhenium(I). Inorg. Chem. 1992, 31, 4346–4353. 10.1021/ic00047a023. [DOI] [Google Scholar]
- Cook M. J.; Lewis A. P.; McAuliffe G. S. G.; Skarda V.; Thompson A. J.; Glasper J. L.; Robbins D. J. Luminescent metal complexes. Part 1. Tris-chelates of substituted 2,2′-bipyridyls with ruthenium (II) as dyes for luminescent solar collectors. J. Chem. Soc., Perkin Trans. 2 1984, 1293. 10.1039/P29840001293. [DOI] [Google Scholar]
- Mulliken R. S. Electronic Population Analysis on LCAO-MO Molecular Wave Functions. I. J. Chem. Phys. 1955, 23, 1833–1840. 10.1063/1.1740588. [DOI] [Google Scholar]
- Escudero D.; Thiel W. Exploring the Triplet Excited State Potential Energy Surfaces of a Cyclometalated Pt(II) Complex: Is There Non-Kasha Emissive Behavior?. Inorg. Chem. 2014, 53, 11015–11019. 10.1021/ic501430x. [DOI] [PubMed] [Google Scholar]
- Kasha M. Characterization of Electronic Transitions in Complex Molecules. Discuss. Faraday Soc. 1950, 9, 14–19. 10.1039/df9500900014. [DOI] [Google Scholar]
- Stoyanov S. R.; Villegas J. M.; Rillema D. P. Spectroscopic Properties of [Pt2(μ-P2O 5H2)4]:4- A Time-Dependent Density Functional Theory and Conductor-like Polarizable Continuum Model Investigation. J. Phys. Chem. B 2004, 108, 12175–12180. 10.1021/jp048360m. [DOI] [Google Scholar]
- Vosko S. H.; Wilk L.; Nusair M. Accurate Spin-Dependent Electron Liquid Correlation Energies for Local Spin Density Calculations: A Critical Analysis. Can. J. Phys. 1980, 58, 1200–1211. 10.1139/p80-159. [DOI] [Google Scholar]
- Perdew J. P.; Burke K.; Ernzerhof M. Generalized Gradient Approximation Made Simple. Phys. Rev. Lett. 1996, 77, 3865–3868. 10.1103/PhysRevLett.77.3865. [DOI] [PubMed] [Google Scholar]
- Frisch M. J.; Trucks G. W.; Schlegel H. B.; Scuseria G. E.; Robb M. A.; Cheeseman J. R.; Scalmani G.; Barone V.; Petersson G. A.; Nakatsuji H.; Li X.; Caricato M.; Marenich A. V.; Bloino J.; Janesko B. G.; Gomperts R.; Mennucci B.; Hratch D. J.. Gaussian 16, Revision B.01; Gaussian, Inc: Wallingford, CT, 2006. [Google Scholar]
- Rillema D. P.; Stoyanov S. R.; Cruz A. J.; Nguyen H.; Moore C.; Huang W.; Siam K.; Jehan A.; Komreddy V. HOMO-LUMO Energy Gap Control in Platinum(II) Biphenyl Complexes Containing 2,2′-Bipyridine Ligands. Dalt. Trans. 2015, 44, 17075–17090. 10.1039/C5DT01891A. [DOI] [PubMed] [Google Scholar]
- Yanai T.; Tew D.; Handy N. A new hybrid exchange-correlation functional using the Coulomb-attenuating method (CAM-B3LYP). Chem. Phys. Lett. 2004, 393, 51–57. 10.1016/j.cplett.2004.06.011. [DOI] [Google Scholar]
- Cossi M.; Rega N.; Scalmani G.; Barone V. Energies, Structures, and Electronic Properties of Molecules in Solution with the C-PCM Solvation Model. J. Comput. Chem. 2003, 24, 669–681. 10.1002/jcc.10189. [DOI] [PubMed] [Google Scholar]
- Barone V.; Cossi M. Quantum calculation of molecular energies and energy gradients in solution by a conductor solvent model. J. Phys. Chem. A 1998, 102, 1995–2001. 10.1021/jp9716997. [DOI] [Google Scholar]
- Stratmann R. E.; Scuseria G. E.; Frisch M. J. An Efficient Implementation of Time-Dependent Density-Functional Theory for the Calculation of Excitation Energies of Large Molecules. J. Chem. Phys. 1998, 109, 8218–8224. 10.1063/1.477483. [DOI] [Google Scholar]
- Bauernschmitt R.; Ahlrichs R. Treatment of Electronic Excitations within the Adiabatic Approximation of Time Dependent Density Functional Theory. Chem. Phys. Lett. 1996, 256, 454–464. 10.1016/0009-2614(96)00440-X. [DOI] [Google Scholar]
- Cammi R.; Mennucci B.; Tomasi J. Fast Evaluation of Geometries and Properties of Excited Molecules in Solution: A Tamm-Dancoff Model with Application to 4-Dimethylaminobenzonitrile. J. Phys. Chem. A 2000, 104, 5631–5637. 10.1021/jp000156l. [DOI] [Google Scholar]
- Cossi M.; Barone V. Time-Dependent Density Functional Theory for Molecules in Liquid Solutions. J. Chem. Phys. 2001, 115, 4708–4717. 10.1063/1.1394921. [DOI] [Google Scholar]
- Stoyanov S. R.; Yin C.-X.; Gray M. R.; Stryker J. M.; Gusarov S.; Kovalenko A. Computational and Experimental Study of the Structure, Binding Preferences, and Spectroscopy of Nickel(II) and Vanadyl Porphyrins in Petroleum. J. Phys. Chem. B 2010, 114, 2180–2188. 10.1021/jp908641t. [DOI] [PubMed] [Google Scholar]
- Nazeeruddin M. K.; De Angelis F.; Fantacci S.; Selloni A.; Viscardi G.; Liska P.; Ito S.; Takeru B.; Grätzel M. Combined Experimental and DFT-TDDFT Computational Study of Photoelectrochemical Cell Ruthenium Sensitizers. J. Am. Chem. Soc. 2005, 127, 16835–16847. 10.1021/ja052467l. [DOI] [PubMed] [Google Scholar]
- Pastore M.; De Angelis F.; Angeli C. Optical Absorption Spectrum of the N3 Solar Cell Sensitizer by Second-Order Multireference Perturbation Theory. Theor. Chem. Acc. 2016, 135, 108. 10.1007/s00214-016-1868-y. [DOI] [Google Scholar]
- Manna K.; Zhang T.; Greene F. X.; Lin W. Bipyridine- and Phenanthroline-Based Metal-Organic Frameworks for Highly Efficient and Tandem Catalytic Organic Transformations via Directed C-H Activation. J. Am. Chem. Soc. 2015, 137, 2665–2673. 10.1021/ja512478y. [DOI] [PubMed] [Google Scholar]
- Weigend F.; Ahlrichs R. Balanced Basis Sets of Split Valence, Triple Zeta Valence and Quadruple Zeta Valence Quality for H to Rn: Design and Assessment of Accuracy. Phys. Chem. Chem. Phys. 2005, 7, 3297–3305. 10.1039/B508541A. [DOI] [PubMed] [Google Scholar]
- Weigend F. Accurate Coulomb-Fitting Basis Sets for H to Rn. Phys. Chem. Chem. Phys. 2006, 8, 1057–1065. 10.1039/b515623h. [DOI] [PubMed] [Google Scholar]
- Xu X.; Truhlar D. G. Accuracy of Effective Core Potentials and Basis Sets for Density Functional Calculations , Including Relativistic Effects , As Illustrated by Calculations on Arsenic Compounds. J.Chem. Theory Comput. 2011, 7, 2766–2779. 10.1021/ct200234r. [DOI] [PubMed] [Google Scholar]
- Dennington R.; Keith T. A.; Millam J. M.. GaussView, Version 6; Semichem Inc.: Shawnee Mission, KS, 2016. [Google Scholar]
Associated Data
This section collects any data citations, data availability statements, or supplementary materials included in this article.