Abstract
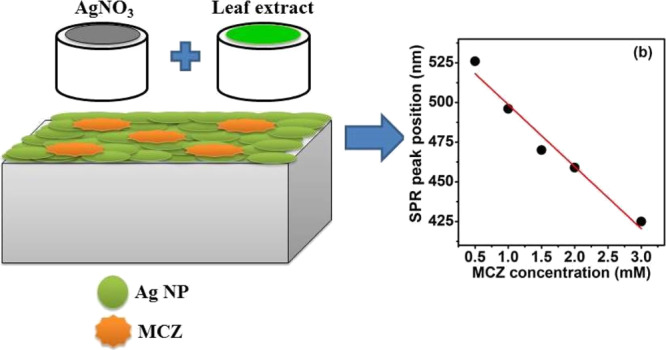
In this work, sensing and photocatalytic activities of green synthesized silver nanoparticles (Ag NPs) are investigated. Ag NPs have been synthesized by the reduction of silver nitrate (AgNO3) using different leaf extracts. An optimum surface plasmon resonance (SPR) behavior is obtained for neem leaf extracts because of the presence of a high concentration of diterpenoids, as evidenced from gas chromatography mass spectroscopy results. The underlying mechanism for the formation of Ag NPs is highlighted. The Ag NPs are in spherical shape and exhibit the hexagonal crystal phase and also show a good stability. The biosensing property of the Ag NPs is evaluated using mancozeb (MCZ) agro-fungicide, and the SPR peak position exhibited a linear response with MCZ concentration. The sensitivity is found to be 39.1 nm/mM. Further, the photocatalytic activity of Ag NPs is tested using 0.5 mM MCZ solution as a model under UV–visible illumination. It is observed that photocatalytic activity is caused by the formation of reactive oxygen species. Therefore, the green synthesized Ag NPs are potential candidates for biosensing and photocatalytic applications.
1. Introduction
Metal nanoparticles (MNPs) have always been a subject of great interest because of their high conductivity, large surface-to-volume ratio, plasmonic properties, and so forth.1−3 The tuning of the surface plasmon resonance (SPR) of MNPs is widely studied to explore its practical application in sensors, biodevices, data storage, spectroscopic techniques, catalysis, and so forth.4−7 SPR is the resonant oscillation of conduction electrons with respect to the positive ion core under appropriate light illumination, and it mainly depends on the shape, size of the MNPs, and the surrounding dielectric medium.8,9 SPR properties thus help us to amplify and manipulate the light at the nanoscale level and therefore increase the sensitivity and resolution of optical devices.9 Among various MNPs, silver (Ag) nanoparticles are widely studied because of their high conductivity, good light absorption, high sensitivity, resolution, antibacterial activity, and chemical stability.1−7 Ag NPs are attractive for biosensing applications because the SPR of Ag NPs is highly influenced by the surface-adsorbed molecules, and the wavelength of SPR can be tuned by the concentration of adsorbed molecules.8,9 Therefore, the sensing ability of Ag NPs using different analytes such as glucose, triacylglyceride, and so on has been explored.5,6,10,11 In our previous work, pulsed laser-deposited Ag NPs were investigated for glucose sensing and achieved a sensitivity of 14.8 nm/mM.6 Recently, MNPs are considered as a class of efficient photocatalysts because of their additional advantages compared to conventional semiconductor-based photocatalysts including the better affinity to many reactants and ability to utilize the full solar spectrum.12 In this context, Tamuly et al. investigated the photodegradation of methyl red dye using Ag NPs under UV light and found that the rate of degradation depends on the Ag NP concentration.13 Also, it is observed that MNPs influence the photocatalytic activity of semiconductors when they are integrated with MNPs.13 However, the underlying mechanism of photocatalytic activity of metal NPs is not well established yet. Thus, the studies on sensing and photocatalytic activity of MNPs are imperative in both fundamental and application point of view.
Ag NPs can be synthesized using different physical and chemical methods. However, the high cost of production and toxicity issues associated with the above techniques opened the gate to a very cost-effective, reliable, and eco-friendly green synthesis method.14−18 In this technique, the Ag NPs are prepared using the green leaf extract as a reducing and stabilizing agent.1,14−18 The leaf contains various biologically active constituents such as proteins and enzymes, which help in the reduction of silver ions into silver nanoparticles.1 Even though several studies have been reported on the green synthesis of Ag NPs using various leaves of guava, neem, aloe vera, lemon, hibiscus, tulasi, and so forth, most of these studies explored the antibacterial activity of Ag NPs.1,14−18 For instance, Verma and Mehata synthesized Ag NPs using neem leaf extract and studied the antibacterial activity against Escherichia coli bacteria.14 Shinde et al. made green synthesized Ag films with guava leaves as the reducing agent, and the antibacterial activity was evaluated using E. coli bacteria.18 But the sensing and photocatalytic activities of green synthesized Ag NPs using pesticide molecules are rarely studied.19,20
Therefore, in this work, we made an attempt to study the effect of different leaf extracts on the formation of Ag NPs and the underlying mechanism is explored. Further, mancozeb (MCZ), a well-known and widely used agricultural fungicide, has been chosen as a model for testing the sensing and photocatalytic abilities of the green synthesized NPs. The underlying mechanism of photocatalytic activity is proposed.
2. Results and Discussion
2.1. Effect of Different Leaf Extracts on the Formation of Ag NPs
Figure 1 shows the absorbance spectra of Ag NPs prepared using different leaf extract solutions. The presence of SPR peak in the visible region confirms the formation of Ag NPs.1−7 The free conduction electrons present in MNPs are responsible for the SPR absorption band as a result of their vibrations in resonance with incoming photons.8,9 The SPR bands of Ag NPs were around 446, 456, 443, and 347 nm for neem, aloe vera, Indian mint, and guava leaves, respectively. The absorbance spectra of Ag NPs prepared using aloe vera leaves exhibit an additional peak at around 370 nm, which can be attributed to the quadrupolar resonance in addition to the primary dipole resonance.6,9 The size of Ag NPs was determined using eq 1 and is tabulated in Table 1.1
| 1 |
where “D” is the diameter of the particle, “νf” is the Fermi velocity of electrons in bulk silver, and ΔE1/2 is the full width at half maximum of the SPR peak.
Figure 1.
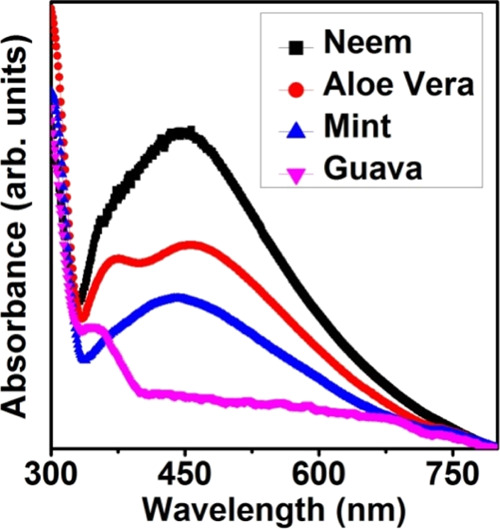
Absorbance spectra of Ag NPs prepared using different leaf extract solutions.
Table 1. of SPR Band, Average Particle Size, and Shift in the FTIR Peak at 3300 cm–1 for Different Leaves.
| leaf extract | fwhm of SPR peak (nm) | particle size, D (nm) | shift in peak at 3300 cm–1 |
|---|---|---|---|
| neem | 264 | 25 | 5 |
| aloe vera | 319 | 31 | 2 |
| Indian mint | 279 | 27 | 1 |
| guava | 62 | 6 | 0 |
The FTIR spectra of different leaf extracts and Ag NPs synthesized using the leaf extracts are shown in Figure 2. The FTIR spectra consist of three bands around 1630, 2110, and 3300 cm–1. The band at 1630 cm–1 ascribed to the stretching mode of amide C=O and the band around 2110 cm–1 (enlarged view shown in Figure S1) corresponding to the C≡C stretching mode in alkynes.1,14,15,21 These bonds aroused because of the presence of various phytochemicals such as terpenoids and flavonoids in the leaf extract.21 The band around 3300 cm–1 indicates the presence of N–H/O–H stretching modes.1,14,15,21 The FTIR band around 3300 cm–1 is found to be shifted with different leaf extracts. A shift is observed for the peak at 3300 cm–1 of the pure leaf extracts when compared with that of the Ag NPs solution prepared from the respective leaf extracts. The difference in this peak of pure leaf extracts and Ag NPs made using the respective leaf extract is tabulated in Table 1 and is found to be maximum for neem extract. These −OH groups are mainly responsible for the reduction of Ag+ ions to Ag NPs, and the variation in their peak positions represents the higher reductability and stability of prepared Ag NPs.16
Figure 2.
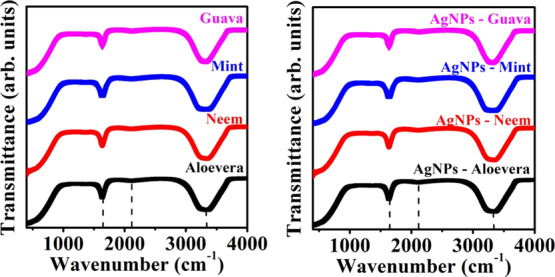
FTIR spectra of pure leaf extracts and Ag NPs prepared using different leaf extracts.
Various phytochemicals present in the leaf extracts were confirmed and quantified using gas chromatography mass spectroscopy (GCMS) results and are given in Tables S1–S4 in the Supporting Information. The neem leaf extract consists of 17 phytochemical constituents, of which 3,7,11,15-tetramethyl-2-hexadecen-1-ol (Phytol) exhibited a major content of 44.65%. Phytol is a diterpenoid with two terpene units attached with hydroxyl groups and is also a major constituent of chlorophyll. The diterpenoids has a higher reducibility and thus Ag+ ions get easily reduced into Ag0 nanoparticles in the presence of neem leaf extract.1 The leaf extract of aloe vera is found to be consisting 29 phytochemical constituents and alpha-Tridecene makes the higher contribution of 10.50%. Mint leaf extract mostly consists of 2-P-Cymenol with 55.28% while guava leaf extract has caryophyllene as the major constituent with 34.89%. Thus, it is observed that the presence of diterpenoids in the neem leaf extract helps in the faster reduction of Ag+ ions. Usually, the surrounding organic molecules capped with Ag NPs and thus modify the plasmonic properties of Ag NPs as they become the surrounding environment around the NPs.9
The SPR peak of the green synthesized Ag NPs was tuned by varying the silver nitrate as well as leaf extract concentration, as shown in Figures S2 and S3. A high absorbance was observed for the Ag NPs prepared using 90 mL of 50 mM AgNO3 solution and 10 mL of 0.03 g/mL of leaf extract. The formation of Ag NPs consists of three steps such as ion reduction, clustering, and nanoparticle growth.1 When the precursor AgNO3 is dissolved in deionized water, it will dissociate into Ag+ and NO3– ions. Because the neem leaf has a higher amount of diterpenoids with hydroxyl radicals (Phytol), it will help in the reduction of Ag+ ions into Ag0 nanoparticles as well as act as a capping agent against agglomeration.1 The charge transfer between the phytochemicals present in the leaf extract and Ag+ ions leads to the formation of Ag NPs.1 Because the Ag NPs prepared using neem extract exhibited higher SPR than that prepared from other leaf extracts, the same have been used to investigate further studies.
2.2. Photoluminescence, X-ray Diffraction, Morphological, and Ageing Studies
The Ag NPs prepared with 50 mM of AgNO3 and 0.03 g/mL of neem leaf extract was further characterized using photoluminescence (PL), X-ray diffraction (XRD), scanning electron microscopy, and stability test. Figure 3a shows the PL spectrum of prepared Ag NPs recorded at a wavelength of 350 nm. The spectrum consists of two emission bands at 390 and 460 nm. The UV emission peak at 390 nm represents the radiative recombination of electrons and holes from the sp conduction band above the Fermi level to the d band.6,22 The interband transitions become more prominent in the case of MNPs than that in their bulk counterpart because of the reduced number of atoms.9 The emission at 460 nm can be attributed to the SPR of Ag NPs.6,9 The intensity ratio (I390/I460) is determined to be 1.41 and thus it is concluded that the as-synthesized Ag NPs exhibit a higher UV light absorption. The XRD pattern of Ag NPs, shown in Figure 3b, consists of reflections corresponding to the (004), (101), (103), (006), and (201) lattice planes (JCPDS 41-1402) confirming the formation of Ag NPs with a hexagonal crystal structure. This further established the formation of crystalline Ag NPs through the green synthesis method. The field emission scanning electron microscopy (FE-SEM) image of the Ag NPs, shown in Figure 3c, shows the formation of spherical nanoparticles with an average grain size of ≈30 nm. This is in good agreement with the literature that the shape of the green synthesized Ag NPs with different extracts are in spherical shape.17,18
Figure 3.
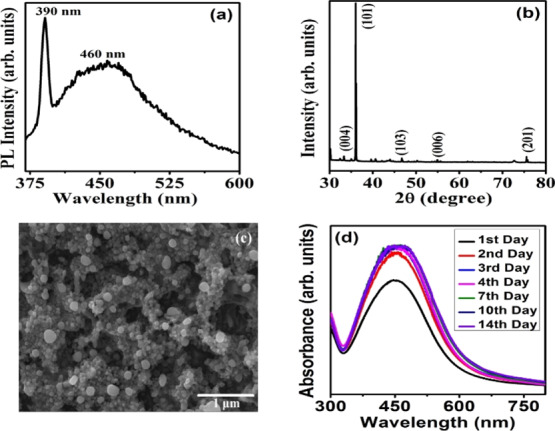
(a) PL spectrum, (b) XRD pattern, (c) FE-SEM image, and (d) ageing studies of green synthesized Ag NPs.
In order to study the stability of the green synthesized Ag NPs, the ageing effect was studied for 14 days, as shown in Figure 3d. It is observed that the SPR peak shifted from 448 to 461 nm, which is due to the increase in the particle size. The changes in the full width at half maximum (fwhm) and position of the SPR peak in each day are tabulated in Table 2. The fwhm value is observed to become constant as the number of days increases. The slight increase in the intensity and width of the SPR peak with an increase in the number of days is attributed to the growth process of Ag nanoparticles rather than its agglomeration or aggregation.1,8 The stability of Ag NPs prepared using Tulsi leaf extract is reported to show a stability up to 5 days only with a significant decrease in the absorbance value indicating agglomeration.1 This confirms the better stability of our green synthesized Ag NPs.
Table 2. Peak Position and fwhm of the SPR Band on Various Days.
| day | SPR peak position (nm) | fwhm (nm) |
|---|---|---|
| 1 | 448 | 180 |
| 2 | 452 | 200 |
| 3 | 453 | 208 |
| 4 | 453 | 212 |
| 7 | 456 | 218 |
| 10 | 458 | 219 |
| 14 | 461 | 219 |
2.3. Silver Nanoparticle-Based Biosensor for Pesticide Detection
To study the sensing ability of as-prepared Ag NPs, MCZ pesticide solution was selected as a template and the effect of different MCZ pesticide concentrations (CMCZ) on Ag NPs is examined (Figure 4a). The values of concentration used in the present article are similar to the values reported in the literature.19,20 Rohit et al studied the sensing ability of modified Ag NPs in environmental water and fruit juice samples by adding MCZ solution with a concentration of 1 mM.20 A blue shift in the SPR peak is observed with increase in the pesticide concentration and is plotted and shown in Figure 4b. The Ag NPs showed a linear response with increase in MCZ concentration. Furthermore, we clearly observed a decrease in the intensity as well as narrowing of the SPR peak up to 1 mM of MCZ concentration while both the intensity and fwhm of the SPR peak is found to increase with CMCZ > 1 mM.
Figure 4.
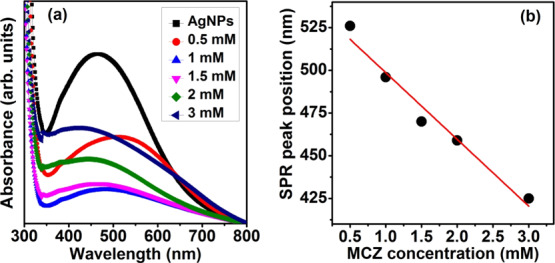
(a) Absorbance spectra of Ag NPs with various concentrations of MCZ solution (b) shift in the SPR peak as a function of MCZ pesticide concentration.
The shift in the SPR peak can be attributed to the particle size, shape, interparticle distance, agglomeration, and surrounding dielectric medium.8,9 In the present case, because the surrounding media (MCZ) can affect the resultant electric field at the MNP surface, a change in the MCZ concentration can induce variations in the amplitude, fwhm and position of the SPR peak of Ag NPs.9 The net electric field at the NP surface is the resultant sum of electric field due to the incident light and that due to the rest of NPs.9 The decrease in the amplitude and narrowing of the SPR peak up to CMCZ ≤ 1 mM can be attributed to the decrease in the plasmonic coupling of Ag NPs as a result of the interaction between Ag NPs and MCZ molecules.9 Furthermore, the electric field due to incident light will not be much affected at CMCZ ≤ 1 mM as the ratio of the number of NPs to the number of MCZ molecules will be higher.2 Thus, the interparticle interaction between Ag NPs will be diminished and resonant conditions will get modified.9 This causes an enhancement in the net restoring force and hence leads to a higher resonant frequency, which shifts the SPR band toward a lower wavelength region.9 A higher resonant frequency favors for a lesser amplitude of the SPR band according to the theory of forced oscillators.9 At CMCZ > 1 mM, the ratio between number of NPs and number of MCZ molecules becomes lower and thus the SPR signal from Ag NPs will get screened by the MCZ molecules.2 An increase in the MCZ concentration will result in an increase in its light absorption capacity, and hence, the absorbance is observed to be increased. This further confirms that the signal of the SPR band becomes less effective at higher CMCZ.
The sensitivity of the biosensor based on green synthesized Ag NPs can be defined as the ratio of the shift in the SPR peak (Δλ) with respect to the change in the pesticide concentration (ΔCMCZ). Mathematically, it is given by the equation10,11,23
| 2 |
The sensitivity of the Ag NPs can be determined from the slope of the plot between the SPR peak position and MCZ pesticide concentration (Figure 4b) and is found to be 39.1 nm/mM. The sensitivity of the green synthesized Ag NPs is compared with the reported studies in the literature as in Table 3. Hence, we elucidate that the as-synthesized Ag NPs show a very high sensitivity and thus can be employed in various cost-effective and eco-friendly sensor device applications.
Table 3. Comparison of Sensitivity with Reported Values in the Literature.
| type of sensor | synthesis method | analyte used | sensitivity (nm/mM) | reference |
|---|---|---|---|---|
| Ag NPs | chemical reduction | glucose solution (0–2.7 mM) | 7.4 | (5) |
| Ag NPs | pulsed laser deposition (PLD) | glucose solution (0–2.7 mM) | 14.8 | (6) |
| Au NPs | DC sputtering | glucose solution (0–5 % wt) | 0.46 | (10) |
| Ag NPs | chemical reduction | triacylglyceride (0–7 mM) | 28.5 | (11) |
| Ag NPs | green synthesis | mancozeb (0–3 mM) | 39.1 | present work |
2.4. Photocatalytic Activity of Ag NPs Using the MCZ Pesticide
The photocatalytic studies of 0.5 mM MCZ solution under UV–visible illumination has been studied using Ag NPs as the photocatalyst and is shown in Figure 5a. The 0.5 mM MCZ exhibited an absorbance peak at 300 nm (refer Figure S4) while pure Ag NP film showed peak at 290 nm. The peak at 290 nm can be attributed to the proteins capped around the Ag NPs, which acts as the stabilizing/capping agent.24 The UV absorption of protein can be employed for the easy detection of microscopic samples in a nondestructive manner. The changes in the fwhm of the peak at around 290 nm is noted with respect to the illumination time. The fwhm value of the peak at 290 nm was found to increase with illumination time as in Figure 5b and is attributed to the damage of MCZ molecules under UV–visible light illumination.25−28 The MCZ molecules are found to react with the proteins capping the Ag NPs under UV–visible illumination, which illustrates the photocatalytic activity of Ag NPs.
Figure 5.
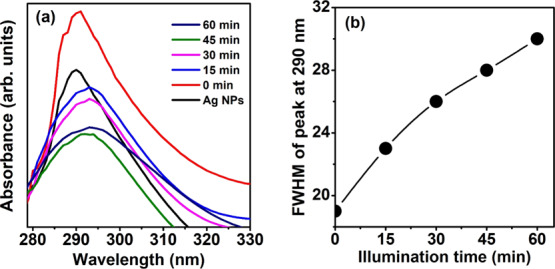
(a) Absorbance spectra of Ag NPs in the range 200–400 nm with illumination time (b) fwhm value of the peak at 290 nm as a function of illumination time.
The photocatalytic activity of Ag NPs under UV–visible illumination can be caused either by the release of Ag+ ions from Ag NPs or because of the production of reactive oxygen species (ROS).25 However, the generation of Ag+ ions from Ag NPs requires higher energetic UV radiation with photon energy greater than 7.5 eV. Because such deep UV photons cannot be produced by halogen lamp illumination and its presence in nature is very feeble because of the presence of the ozone layer, we can exclude the possibility of Ag+ production.25 Second, the formation of ROS species can also be responsible for its photocatalytic activity. The formation of ROS species indirectly established through the investigation of the effect of UV–visible light irradiation time on the SPR peak position of Ag NPs and Ag NPs coated with MCZ as shown in Figures S5 and S6 in the Supporting Information. It is observed that no change in SPR of pure Ag NPs. However, there is a change in the SPR position with irradiation time in case of NPs coated with MCZ. This is possible only when the surrounding medium changes, and it indirectly evidences the formation of ROS, which are responsible for damaging MCZ molecules and thus changing in the surrounding medium. The proposed mechanism is schematically shown in Figure 6. The electrons in the 4d states of Ag NPs are excited to high energy 5sp bands under UV–visible illumination.25,26 The energized photogenerated electrons react with the oxygen molecules present in the adsorbed organic molecules and form the oxygen radicals.26,27 The photo-induced holes left in the inner d bands of Ag NPs show a greater affinity toward the electrons captured from the MCZ molecules rather than that in the sp band.26 This facilitate the excited electrons to react with the oxygen molecule instead of radiative recombination. It is well-established that metal NPs enhance the formation of ROS. These ROS will damage the MCZ molecule and thus result in its aggregation.25−29 This is evident from the broadening of the absorbance peak at 290 nm under UV–visible light illumination. The curved nanoparticle surfaces of spherical Ag NPs can easily provide increased adsorption for foreign molecules and thus enhance its photocatalytic activity.28
Figure 6.
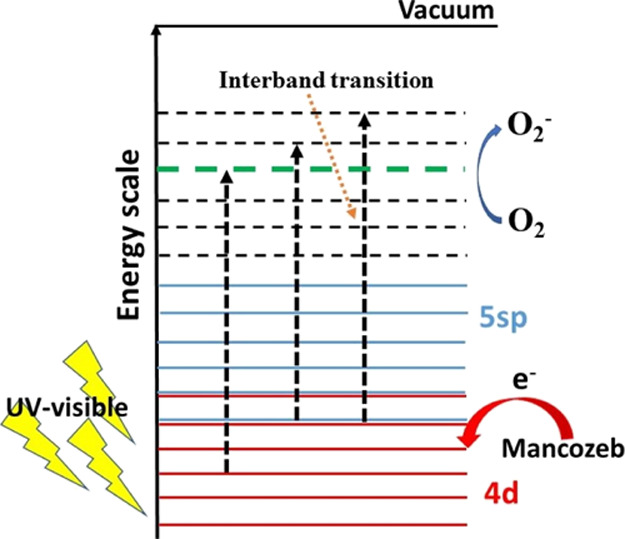
Band structure of green synthesized Ag NPs and its photocatalytic mechanism.
3. Conclusions
This work highlighted the green synthesis of Ag NPs using silver nitrate and different leaf extract solutions and the underlying mechanism in the formation of Ag NPs. A high SPR band was observed for Ag NPs synthesized using 90 mL of 50 mM AgNO3 solution and 10 mL of 0.03 g/mL of neem leaf extract solution. The Ag NPs exhibited a good stability. The XRD spectrum showed that the Ag NPs exist in the hexagonal crystal structure while SEM image confirmed the formation of spherical Ag nanoparticles. A higher ratio of interband transition to SPR emission as evident from the PL spectrum implies the higher UV light absorption of the Ag NPs. The biosensing characteristics of Ag NPs were evaluated using MCZ fungicide and exhibited a linear response with MCZ concentration. The sensitivity was determined to be 39.1 nm/mM. Also, the photocatalytic property of the Ag NPs was determined using 0.5 mM MCZ solution, and the broadening of the absorbance peak at 290 indicates the damage and aggregation of MCZ molecules.
4. Experimental Section
Silver nitrate (AgNO3) was used as the precursor and plant extract as the reducing/stabilizing agent to prepare the Ag NPs. The Experimental Section is further divided into different studies:
4.1. Growth and Optimization of Ag NPs
In order to study the effect of different plant extracts on the formation of Ag NPs, leaves of neem, aloe vera, Indian mint, and guava were selected based on their availability and medicinal importance. The leaves were washed with distilled water multiple times to remove the impurities and were then dried naturally. Then, 5 g of the leaves of each plant were cut into small pieces. The chopped leaves were added to 50 mL of distilled water taken in separate beakers. It was then heated at 75 °C for 15 min and allowed to cool naturally. The solution was stirred for about 24 h and was filtered out to obtain the leaf solution. On the other hand, 50 mM silver nitrate aqueous solution was prepared by adding 0.764 g of silver nitrate into 90 mL of distilled water, and then, the solution was stirred continuously for 15 min. Further, 10 mL of the freshly prepared leaf solution was added to as-prepared silver nitrate solution under vigorous stirring at room temperature for about 10 min. The colorless solution now turned into a yellow brownish solution. Finally, this solution mixture was placed under sunlight for 15 min for obtaining Ag NPs. The color change from yellow brown to dark drown, which is indicative of the formation of Ag NPs. Furthermore, the effect of silver nitrate solution concentration varying from 10 to 75 mM and neem leaf concentration varying from 0.02 to 0.2 g/mL is also investigated on the formation of AgNPs.
4.2. Characterization
The prepared Ag NPs were characterized by UV–Visible spectroscopy, Fourier transform infrared (FTIR) spectroscopy, XRD spectroscopy, and PL spectroscopy. The absorbance spectra of the samples were recorded using the Shimadzu UV-1800 spectrophotometer in the wavelength region 300–800 nm. The FTIR spectra were obtained using the PerkinElmer spectrum 2 spectrometer in the range 4000–400 cm–1. The phytochemical components present in the ethanol extract of plant leaves were identified using the Shimadzu QP2010S gas chromatography–mass spectrometer. The oven column temperature, injection temperature, and the column flow rate were set at 70, 260 °C, and 1 mL/min, respectively. The emission spectra of the samples were recorded using the Horiba flurolog 3 TCSPC fluorometer with an excitation wavelength of 350 nm. The XRD pattern of green synthesized Ag NPs was studied using the Malvern Pananalytical Empyrean in the range 30–80° with a step width of 0.02° using Cu Kα radiation of wavelength 0.154 nm. The morphology of the Ag NPs were recorded with the Tescan Mira 3 field emission electron scanning electron microscope.
4.3. Sensor Application
To study the sensing ability of green synthesized Ag NPs, a surface plasmon-based biosensor was designed by using Ag NPs as the sensing element and MCZ as a model. Because of the low solubility of MCZ in water, we have prepared the pesticide solution by using N–N dimethyl formamide as the solvent. 0.5, 1, 1.5, 2, 2.5, and 3 mM MCZ solutions were prepared by adding 0.008, 0.016, 0.024, 0.032, 0.041, and 0.049 g of pesticide, respectively, to 30 mL of N–N dimethyl formamide. The solution was then stirred for 30 min at room temperature for better homogeneity. Further, the pesticide solution was dropped on the Ag NPs film made on the glass substrate. The absorbance spectra of the films prepared using different MCZ concentrations were recorded using the Shimadzu UV-1800 spectrophotometer in the wavelength region 300–800 nm.
4.4. Photocatalytic Activity
The photocatalytic activity of Ag NP films coated were studied using 0.5 mM MCZ solution as a template under UV–visible illumination. The absorbance spectra at different illumination times were recorded using the JASCO V670 double beam UV–visible spectrometer in the wavelength range 200–400 nm.
Acknowledgments
This work was financially supported by DST-SERB, Govt. of India through grants ECR/2017/000068 (K.C.S.), ECR/2017/002537(K.K.), and EMR/2015/002388 (M.S.P.). The author K.V.A. acknowledges the DST, Govt. of India for the Inspire fellowship (IF170601). Authors acknowledge A. Sulthan Ibrahim (Technical Assistant, Dept. of Physics, Central University of Tamil Nadu) and Ajeesh Kumar S. (Technical Assistant, SPAP, M.G. University, Kerala).
Supporting Information Available
The Supporting Information is available free of charge at https://pubs.acs.org/doi/10.1021/acsomega.0c01136.
Plots of enlarged view of the FTIR peak at 2110 cm–1 of Ag NPs prepared using different leaf extracts; absorbance spectra of Ag NPs prepared using different AgNO3 concentrations; absorbance spectra of Ag NPs prepared using different leaf extract concentrations; absorbance spectra of 0.5 mM MCZ solution coated on a glass substrate; absorbance spectra of pure Ag NPs for different times under UV–visible illumination and absorbance spectra of MCZ-coated Ag NPs at different illumination times; and GCMS results (PDF)
The authors declare no competing financial interest.
Supplementary Material
References
- Jain S.; Mehata M. S. Medicinal plant leaf extract and pure flavonoid mediated green synthesis of silver nanoparticles and their enhanced antibacterial property. Sci. Rep. 2017, 7, 15867. 10.1038/s41598-017-15724-8. [DOI] [PMC free article] [PubMed] [Google Scholar]
- Prosposito P.; Mochi F.; Ciotta E.; Casalboni M.; De Matteis F.; Venditti I.; Fontana L.; Testa G.; Fratoddi I. Hydrophilic silver nanoparticles with tunable optical properties: application for the detection of heavy metals in water. Beilstein J. Nanotechnol. 2016, 7, 1654–1661. 10.3762/bjnano.7.157. [DOI] [PMC free article] [PubMed] [Google Scholar]
- Roy P.; Das B.; Mohanty A.; Mohapatra S. Green synthesis of silver nanoparticles using Azadirachta indica leaf extract and its antimicrobial study. Appl. Nanosci. 2017, 7, 843–850. 10.1007/s13204-017-0621-8. [DOI] [Google Scholar]
- Kamakshi K.; Silva J. P. B.; Sekhar K. C.; Marslin G.; Moreira J. A.; Conde O.; Almeida A.; Pereira M.; Gomes M. J. M. Influence of substrate temperature on the properties of pulsed laser deposited silver nanoparticle thin films and their application in SERS detection of bovine serum albumin. Appl. Phys. B 2016, 122, 108. 10.1007/s00340-016-6385-0. [DOI] [Google Scholar]
- Serra A.; Filippo E.; Re M.; Palmisano M.; Vittori-Antisari M.; Buccolieri A.; Manno D. Non-functionalized silver nanoparticles for a localized surface plasmon resonance-based glucose sensor. Nanotechnology 2009, 20, 165501–165508. 10.1088/0957-4484/20/16/165501. [DOI] [PubMed] [Google Scholar]
- Kamakshi K.; Silva J. P. B.; Sekhar K. C.; Agostinho Moreira J.; Almeida A.; Pereira M.; Gomes M. J. M. Substrate temperature effect on microstructure, optical, and glucose sensing characteristics of pulsed laser deposited silver nanoparticles. Plasmonics 2018, 13, 1235–1241. 10.1007/s11468-017-0625-y. [DOI] [Google Scholar]
- Kamakshi K.; Sekhar K. C.; Almeida A.; Agostinho Moreira J.; Gomes M. J. M. Tuning the surface plasmon resonance and surface-enhanced Raman scattering of pulsed laser deposited silver nanoparticle films by ambience and deposition temperature. J. Optics 2014, 16, 055002. 10.1088/2040-8978/16/5/055002. [DOI] [Google Scholar]
- Csáki A.; Stranik O.; Fritzsche W. Localized surface plasmon resonance based biosensing. Expert Rev. Mol. Diagn. 2018, 18, 279–296. 10.1080/14737159.2018.1440208. [DOI] [PubMed] [Google Scholar]
- Garcia M. A. Surface plasmons in metallic nanoparticles: fundamentals and applications. J. Phys. D: Appl. Phys. 2011, 44, 283001. 10.1088/0022-3727/44/28/283001. [DOI] [Google Scholar]
- Cao S.; Shao Y.; Wang Y.; Wu T.; Zhang L.; Huang Y.; Zhang F.; Liao C.; He J.; Wang Y. Highly sensitive surface plasmon resonance biosensor based on a low-index polymer optical fiber. Optic Express 2018, 26, 3988. 10.1364/OE.26.003988. [DOI] [PubMed] [Google Scholar]
- Baliyan A.; Usha S. P.; Gupta B. D.; Gupta R.; Sharmaa E. K. Localized surface plasmon resonance–based fiber-optic sensor for the detection of triacylglycerides using silver nanoparticles. J. Biomed. Opt. 2017, 22, 107001. 10.1117/1.JBO.22.10.107001. [DOI] [PubMed] [Google Scholar]
- Sarina S.; Waclawik E. R.; Zhu H. Photocatalysis on supported gold and silver nanoparticles under ultraviolet and visible light irradiation. Green Chem. 2013, 15, 1814–1833. 10.1039/C3GC40450A. [DOI] [Google Scholar]
- Tamuly C.; Hazarika M.; Bordoloi M.; Das M. R. Photocatalytic activity of Ag nanoparticles synthesized by using Piper pedicellatum C.DC fruits. Mater. Lett. 2013, 102–103, 1–4. 10.1016/j.matlet.2013.03.090. [DOI] [Google Scholar]
- Verma A.; Mehata M. S. Controllable synthesis of silver nanoparticles using Neem leaves and their antimicrobial activity. J. Radiat. Res. Appl. Sci. 2016, 9, 109–115. 10.1016/j.jrras.2015.11.001. [DOI] [Google Scholar]
- Ahmed S.; Saifullah; Ahmad M.; Swami B. L.; Ikram S. Green synthesis of silver nanoparticles using Azadirachta indica aqueous leaf extract. J. Radiat. Res. Appl. Sci. 2016, 9, 1–7. 10.1016/j.jrras.2015.06.006. [DOI] [Google Scholar]
- Venkatesham M.; Ayodhya D.; Madhusudhan A.; Veera Babu N.; Veerabhadram G. A novel green one-step synthesis of silver nanoparticles using chitosan: catalytic activity and antimicrobial studies. Appl. Nanosci. 2014, 4, 113–119. 10.1007/s13204-012-0180-y. [DOI] [Google Scholar]
- Tippayawat P.; Phromviyo N.; Boueroy P.; Chompoosor A. Green synthesis of silver nanoparticles in aloe vera plant extract prepared by a hydrothermal method and their synergistic antibacterial activity. PeerJ 2016, 4, e2589 10.7717/peerj.2589. [DOI] [PMC free article] [PubMed] [Google Scholar]
- Shinde N. M.; Lokhande A. C.; Lokhande C. D. A green synthesis method for large area silver thin film containing nanoparticles. J. Photochem. Photobiol., B 2014, 136, 19–25. 10.1016/j.jphotobiol.2014.04.011. [DOI] [PubMed] [Google Scholar]
- Zamora-Sequeira R.; Alvarado-Hidalgo F.; Robles-Chaves D.; Sáenz-Arce G.; Avendano-Soto E.; Sánchez-Kopper A.; Starbird-Perez R. Electrochemical characterization of mancozeb degradation for wastewater treatment using a sensor based on poly (3,4-ethylenedioxythiophene) (PEDOT) modified with carbon nanotubes and gold nanoparticles. Polymers 2019, 11, 1449. 10.3390/polym11091449. [DOI] [PMC free article] [PubMed] [Google Scholar]
- Rohit J. V.; Solanki J. N.; Kailasa S. K. Surface modification of silver nanoparticles with dopaminedithiocarbamate for selective colorimetric sensing of mancozeb in environmental samples. Sens. Actuators, B 2014, 200, 219–226. 10.1016/j.snb.2014.04.043. [DOI] [Google Scholar]
- Carmona E. R.; Benito N.; Plaza T.; Recio-Sánchez G. Green synthesis of silver nanoparticles by using leaf extracts from the endemic Buddleja globosa hope. Green Chem. Lett. Rev. 2017, 10, 250–256. 10.1080/17518253.2017.1360400. [DOI] [Google Scholar]
- Das R.; Nath S. S.; Chakdar D.; Gope G.; Bhattacharjee R. Synthesis of silver nanoparticles and their optical properties. J. Exp. Nanosci. 2010, 5, 357–362. 10.1080/17458080903583915. [DOI] [Google Scholar]
- Wang M.; Huo Y.; Jiang S.; Zhang C.; Yang C.; Ning T.; Liu X.; Li C.; Zhang W.; Man B. Theoretical design of a surface plasmon resonance sensor with high sensitivity and high resolution based on graphene–WS2 hybrid nanostructures and Au–Ag bimetallic film. RSC Adv. 2017, 7, 47177–47182. 10.1039/c7ra08380g. [DOI] [Google Scholar]
- Mishra A.; Singh P.; Sardar M. Peroxidase assisted biosynthesis of silver and gold nanoparticles: characterization and computational study. Adv. Mater. Lett. 2015, 6, 194–200. 10.5185/amlett.2015.5658. [DOI] [Google Scholar]
- Shi T.; Wei Q.; Wang Z.; Zhang G.; Sun X.; He Q.-Y. Photocatalytic protein damage by silver nanoparticles circumvents bacterial stress response and multi drug resistance. Mol. Biol. Physiol. 2019, 4, e00175 10.1128/mSphere.00175-19. [DOI] [PMC free article] [PubMed] [Google Scholar]
- Chen X.; Zheng Z.; Ke X.; Jaatinen E.; Xie T.; Wang D.; Guo C.; Zhao J.; Zhu H. Supported silver nanoparticles as photocatalysts under ultraviolet and visible light irradiation. Green Chem. 2010, 12, 414–419. 10.1039/b921696k. [DOI] [PubMed] [Google Scholar]
- Singh M. K.; Mehata M. S. Phase-dependent optical and photocatalytic performance of synthesized titanium dioxide (TiO2) nanoparticles. Optik 2019, 193, 163011. 10.1016/j.ijleo.2019.163011. [DOI] [Google Scholar]
- Kopp M.; Kollenda S.; Epple M. Nanoparticle–Protein interactions: Therapeutic approaches and supramolecular chemistry. Acc. Chem. Res. 2017, 50, 1383–1390. 10.1021/acs.accounts.7b00051. [DOI] [PubMed] [Google Scholar]
- Saptarshi S. R.; Duschl A.; Lopata A. L. Interaction of nanoparticles with proteins: relation to bio-reactivity of the nanoparticle. J. Nanobiotechnol. 2013, 11, 26. 10.1186/1477-3155-11-26. [DOI] [PMC free article] [PubMed] [Google Scholar]
Associated Data
This section collects any data citations, data availability statements, or supplementary materials included in this article.


