Abstract
Peroxynitrite (ONOO–) is a highly reactive nitrogen species with potent oxidant and nitrating properties. Its excessive generation can cause DNA and protein damage, thereby contributing to cell injury, and it is closely related to the development of many diseases. Thus, there is an urgent need for a reliable method to determine changes in the steady-state levels of ONOO– in vivo. Ratiometric imaging, due to its built-in self-calibration system, can reduce artifacts and enable reliable in vivo imaging. In this study, we designed and prepared near-infrared (NIR) biomass quantum dots (NI-BQDs) and covalently coupled them with the NIR dye Cyanine7 (Cy7) to construct an NIR dual-emission nanoprobe (NI-BQD-Cy7) for real-time tracing the generation of endogenous ONOO– in single living cells and in vivo by ratiometric fluorescence imaging. NI-BQD-Cy7 exhibited high detection sensitivity and selectivity for ONOO– in the mitochondria. Additionally, it can produce dual NIR fluorescence emission, thus allowing in situ ratiometric fluorescence imaging to real-time trace the generation and concentration changes of ONOO– in vivo. The application of the proposed NIR dual-emission nanoprobe can provide accurate information for the study of the biological function of ONOO– in single living cells and in vivo, and it is very useful to explain the mechanism of cell damage caused by ONOO–.
Introduction
Peroxynitrite (ONOO–) is an important reactive nitrogen species (RNS) in biological systems, which is formed from the rapid reaction of nitric oxide radical (NO•) and superoxide anion radical (O2–•) in vivo, and it is mainly produced in the mitochondria.1 Due to its strong oxidant and nucleophilic properties, ONOO– can react with various proteins that contain transition-metal centers or thiols, lipids, nucleic acids, etc., ultimately resulting in cell damage.2,3 The detection of ONOO– concentration in vivo can provide accurate biological information, which is quite useful to understand at the molecular level the mechanism of cell damage caused by ONOO–. In addition, long-term accumulation of cell damage is closely associated with the development of various diseases, including cardiovascular disease, neurodegenerative disease, metabolic disease, inflammation, and even cancer.4−7 Therefore, imaging and quantitative detection of ONOO– in single living cells and in vivo are helpful in the early diagnosis of ONOO–-related diseases.
Due to the important role of ONOO– in antibacterial activity, signal transduction, and various intracellular biochemical pathways involved in normal and pathological physiological processes, the development of fluorescent probes for the detection of ONOO– in various biological systems is a rapidly emerging area of great scientific and clinical interest. Indeed, some of these probes are currently being used in biomedical research.8−13 However, these fluorescent probes are all small organic fluorescent dyes, and their main deficiency is that the stability in cell and in vivo is not very good, thereby easily resulting in the photobleaching phenomenon. Most of these probes display open fluorescence signals on a single channel. Due to the effect of photobleaching, uneven load, or fluctuation of the intensity of the excited light, the application of this type of probe in biomedical research is limited. Fortunately, in stark contrast, the ratiometric fluorescent probe detected by two channels can solve these problems by self-calibration. Through the built-in calibration of the two emission bands, the adverse effects of probe concentration, probe environment, photobleaching, uneven load, and excitation intensity are eliminated, thereby providing an effective method for the accurate detection of biomolecules.14−16 In addition, considering the weak light damage, low background fluorescence, and high tissue penetration of near-infrared (NIR) fluorescent probe,17−23 it is desired to develop NIR dual-emission nanoprobes for ONOO– imaging in vivo. However, the design and preparation of this nanoprobe with NIR dual-emitting fluorescence for ratiometric fluorescent imaging of ONOO– in vivo is still a challenge.24,25
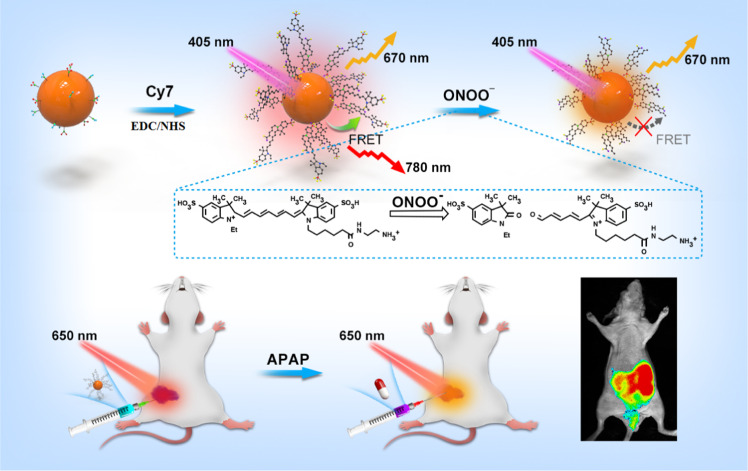
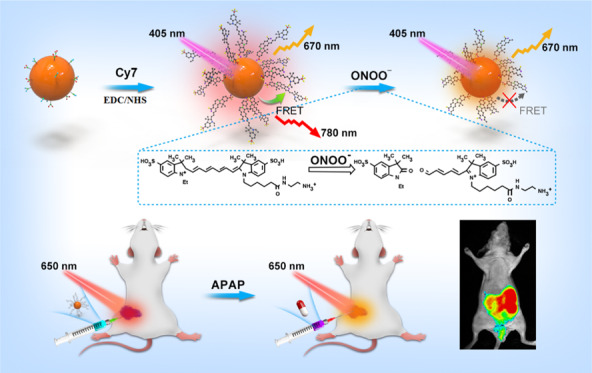
To achieve this challenge, we first prepared NIR fluorescent biomass quantum dots (NI-BQDs) from holly leaves and covalently coupled them with the NIR dye Cyanine7 (Cy7) to structure NIR dual-emission ratiometric fluorescent nanoprobe (NI-BQD-Cy7) with specific response to ONOO–. Due to the mitochondria-targeting group in the Cy7 molecule, NI-BQD-Cy7 can target the mitochondria inside the cells and the Cy7 in NI-BQD-Cy7 can also specifically recognize ONOO–.26 In addition, since the fluorescence emission spectrum of NI-BQDs overlaps the absorption spectrum of Cy7 molecule, they are donors and receptors for a pair of fluorescent resonance energy transfer (FRET). When the NI-BQD donor is covalently coupled with the Cy7 receptor, the fluorescence intensity of NI-BQDs decreases based on FRET, while the fluorescence intensity of Cy7 increases, so the new NI-BQD-Cy7 fluorescent nanoprobe has NIR dual-emission characteristics. When ONOO– is present in the system, the carbon–carbon double bond of the specific site of Cy7 in the probe molecule breaks and leads to a decrease of the fluorescence intensity of Cy7 and an increase of the fluorescence intensity of NI-BQDs. Therefore, the probe can be used as a ratiometric fluorescent nanoprobe for the detection of ONOO– in cells and in vivo, with high sensitivity and good selectivity. Since the dual-emission fluorescence wavelengths are in the NIR region, the NI-BQD-Cy7 nanoprobe can be used for in situ ratiometric fluorescence imaging to real-time trace the generation of endogenous ONOO– in single living cells and in vivo (Scheme 1).
Scheme 1. Schematic Representation for the Fabrication and Application of the NI-BQD-Cy7 NIR Dual-Emission Nanoprobe.
Results and Discussion
Characterization of NI-BQDs and NI-BQD-Cy7
The morphology, dispersion, and particle size of NI-BQDs were first characterized by transmission electron microscopy (TEM). The TEM image shown in Figure 1A reveals that NI-BQDs have good dispersion with a diameter of about 2 nm. The lattice constant of the high-resolution transmission electron microscopy (HRTEM) diagram of NI-BQDs is 0.22 μm, which corresponds to the crystal plane of graphene (100), indicating that the graphitization and crystallinity of NI-BQDs are relatively high. The crystal forms of NI-BQDs and NI-BQD-Cy7 were investigated by X-ray diffraction (XRD) analysis. The diffractograms displayed in Figure 1B show that there is an obvious wide diffraction peak at the position of 2θ = 23.43°, and the corresponding carbon structure mirror is (002). There are no characteristic diffraction peaks of other graphites in the XRD patterns. A comparison of the two diffractograms reveals that the XRD patterns of NI-BQDs and NI-BQDs-Cy7 are almost identical, indicating that the modification of Cy7 does not change the structure and morphology of NI-BQDs. The surface element composition of NI-BQDs was characterized by X-ray photoelectron spectroscopy (XPS). The XPS spectrum of NI-BQDs shown in Figure 1C reveals that it is mainly composed of C, N, and O, accounting for 57.31, 4.33, and 31.67%, respectively. A strong O 1s characteristic peak appeared at 532.7 eV, a second strong C 1s characteristic peak is present at 285.1 eV, and a weak N 1s characteristic peak is present at 399.1 eV. The high-resolution XPS spectra of C 1s, N 1s, and O 1s are displayed in Figure S1 (Supporting Information) that indicate the presence of C–H/C–C, C–N, C–O, and C=O bonds in the C 1s spectrum, the existence of pyrrolic-N and pyridine-N bonds in the N 1s spectrum, and the presence of O=C, O–H, O–C, and O=C–O bonds in the C 1s spectrum. The composition of functional groups on the surface of NI-BQDs was characterized by Fourier transform infrared (FTIR) spectroscopy. The FTIR spectra of Cy7, NI-BQDs, and NI-BQDs-Cy7 displayed in Figure 1D show a peak at 3410 cm–1 that corresponds to the stretching vibration peak of −O–H/N–H, and its intensity in NI-BQD-Cy7 (trace c) is clearly stronger than those in NI-BQDs (trace b) and Cy7 (trace a), indicating that Cy7 is covalently coupled with NI-BQDs through an amide bond, which is consistent with the experimental principle. The peak located at 2848 cm–1 corresponds to the telescopic vibration of C–H, and that at 1634 cm–1 corresponds to C=C and C=N bending vibration. Additionally, the peak at 1360–1020 cm–1 corresponds to C–O and C–N. The absorption of NI-BQD-Cy7 was significantly higher than that of NI-BQDs, and the wide peak around 1190 cm–1 is the characteristic absorption peak of the sulfonic group, which indicates that Cy7 was successfully conjugated to NI-BQDs. The surface charge of NI-BQDs and NI-BQD-Cy7 was further investigated, and the results showed that surfaces of both were positively charged in a pH 7.4 neutral environment (Figure S2, Supporting Information).
Figure 1.
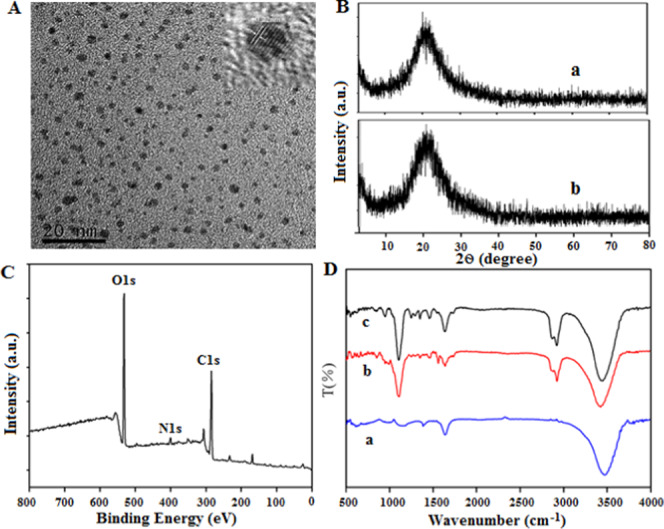
(A) TEM and HRTEM images of NI-BQDs. (B) XRD diffractogram of NI-BQDs (a) and NI-BQDs-Cy7 (b). (C) XPS spectrum of NI-BQDs. (D) FTIR spectra of Cy7 (a), NI-BQDs (b), and NI-BQD-Cy7 (c).
Optical Properties of NI-BQDs and NI-BQD-Cy7
To determine the optical properties of NI-BQDs and NI-BQD-Cy7, we first investigated their ultraviolet–visible (UV–vis) absorption spectra. The UV–vis spectra shown in Figure S3 in the Supporting Information reveal an obvious absorption peak at 279 nm, which is the formation of π–π* electron transition of C=O in NI-BQDs. The NI-BQDs-Cy7 has an obvious absorption peak at 750 nm, which is due to the characteristic absorption of the Cy7 molecule, further indicating that Cy7 had been successfully coupled on the surface of NI-BQDs. We studied the feasibility of FRET between NI-BQDs and Cy7, and the results revealed that the maximum excitation and emission wavelengths of NI-BQDs are at 405 and 678 nm, respectively. The maximum absorption wavelength of Cy7 is at 710 nm, and the absorption spectrum of Cy7 overlaps with the fluorescence emission spectrum of NI-BQDs, which indicates that they can be a pair of donors and receptors of FRET (Figure 2A). After the covalent coupling of NI-BQDs with Cy7, the fluorescence emission spectrum of NI-BQD-Cy7 exhibited emission peaks at 670 and 780 nm, and the fluorescence intensity of the peak at 670 nm gradually decreased with the increase of the Cy7 concentration, while the fluorescence intensity of the peak at 780 nm was gradually increased (Figure 2B). These results showed that the coupling of NI-BQDs with Cy7 was successful and a dual-emission NIR ratiometric fluorescent nanoprobe was formed by FRET interactions. The FRET efficiency can be measured and calculated by a reported method.27
Figure 2.
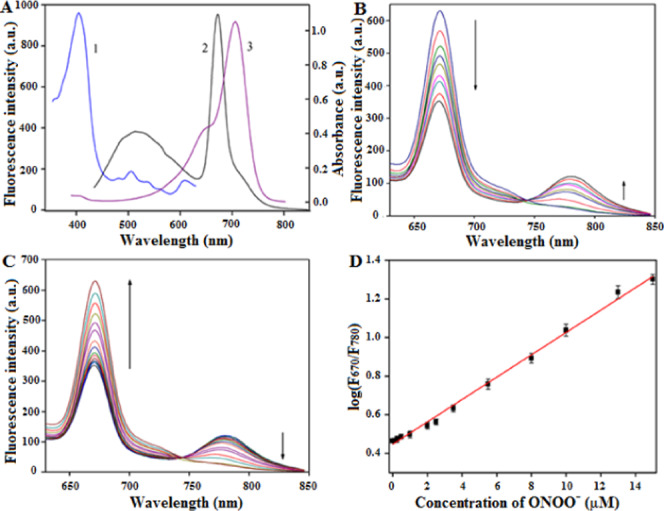
(A) Fluorescence excitation (1) and emission (2) spectra of NI-BQDs, and absorption spectra (3) of Cy7. (B) With the increase of the Cy7 concentration, the fluorescence intensity of NI-BQDs decreased, while the fluorescence intensity of Cy7 increased. (C) Fluorescence spectra of NI-BQD-Cy7 in the presence of different concentrations of ONOO– (0–15 μM). (D) Linear relationship between the logarithm value of the fluorescence intensity ratio (I670/I780) and the ONOO– concentration.
The stability of the obtained dual-emission NIR ratiometric fluorescent nanoprobe was investigated, and the results showed that the fluorescence intensity of the two emission peaks of the probe solution was kept unchanged for 48 h at room temperature (Figure S4, Supporting Information).
Cytotoxicity of NI-BQDs and NI-BQD-Cy7
To investigate the feasibility of the application of NI-BQDs and the NI-BQD-Cy7 nanoprobe in biological systems, we studied its cytotoxicity in vitro by methyl thiazolyl tetrazolium (MTT) assay in RAW264.7 cells. The results, which are shown in Figure S5 in the Supporting Information, reveal that at 40 μg/mL NI-BQDs-Cy7, the cell survival rate was about 99%, while at 200 μg/mL, the cell survival rate decreased from 99 to 83%, showing the good biocompatibility of the probe and indicating that it can be used for the imaging of ONOO– in living cells and in vivo.
Mitochondria Localization Study of NI-BQDs-Cy7 in Cells
Since endogenous ONOO– is produced in the mitochondria of living cells, it is necessary to confirm that the nanoprobe can effectively enter the cell mitochondria through a cell colocalization assay. Accordingly, RAW264.7 cells were incubated for 8 h with the NI-BQD-Cy7 nanoprobe, as well as lysosome, nucleus, and mitochondrial localization reagent, separately. Then, laser confocal imaging was performed. The results, which are shown in Figure 3, indicate that the NI-BQD-Cy7 nanoprobe has excellent mitochondria-targeting ability (colocalization coefficient is 0.89), while the colocalization coefficients for lysosome and nucleus are only 0.56 and 0.58, respectively.
Figure 3.
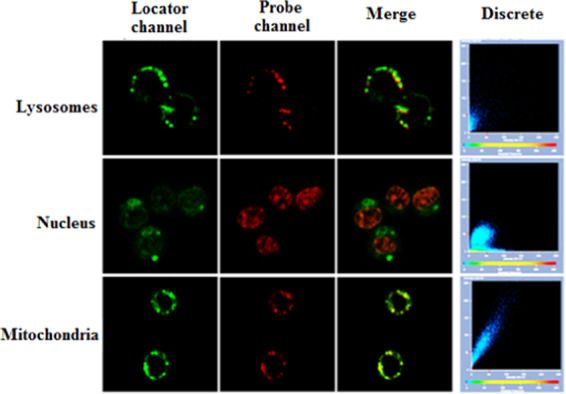
Colocalization imaging of suborganelle in RAW264.7 cells after co-incubation with NI-BQDs-Cy7 nanoprobe and localization reagents.
Response of the NI-BQD-Cy7 to ONOO–
The response of the nanoprobe to ONOO– was investigated by mixing a certain amount of the NI-BQD-Cy7 solution with various solutions containing different concentrations of ONOO–. The results shown in Figure 2C reveal that as the ONOO– concentration increases, the fluorescence intensity of the nanoprobe at 780 nm is gradually reduced, while the fluorescence intensity at 670 nm is gradually increased. Additionally, the results also show that there is a good linear relationship between the logarithm value of the fluorescence intensity ratio (I670/I780) and the ONOO– concentration in the range of 0.02–15 μM (Figure 2D) with a detection limit of 8.5 nM (S/N = 3), as indicated by the linear regression equation: log (I670/I780) = 0.05788CONOO– – 0.4474, R2 = 0.9959, which is comparable to the previously reported ONOO– ratiometric fluorescent probe.14,15 In addition, the response time of the NI-BQD-Cy7 nanoprobe toward ONOO– was also investigated via a kinetics method. After the addition of ONOO– to the NI-BQD-Cy7 nanoprobe solution for 4 min, the fluorescence intensity of NI-BQD increased to its maximum and that of Cy7 decreased to its minimum (Figure S6, Supporting Information).
Specificity of NI-BQD-Cy7 for the ONOO– Detection
The specificity of the NI-BQD-Cy7 nanoprobe for the ONOO– detection was also investigated by evaluating the response of the probe to ONOO– and comparing it with the response to the presence of other RNS as well as the presence of various reactive oxygen species (ROS). The results, which are presented in Figure S7 in the Supporting Information, show that, compared to the blank control group, the fluorescence intensity ratio (I670/I780) only increased in the presence of ONOO–, whereas in the presence of different bioactive molecules, including other RNS and ROS at the same concentration (15 μM), the fluorescence intensity ratio (I670/I780) almost did not change. These results demonstrate that the NI-BQD-Cy7 nanoprobe has high specificity for the detection of ONOO–.
Ratiometric Fluorescence Imaging of Exogenous ONOO– in Living Cells
A series of experiments were conducted to examine the imaging of exogenous ONOO– in the cells. RAW264.7 cells were seeded at the appropriate density in a 35 mm confocal imaging dish, and after incubation for 20 h, the NI-BQD-Cy7 nanoprobe was added and the incubation was continued for 6 h. 3-Morpholinosy-dnonimine (SIN-1), which induces the release of NO from cells, was used as the ONOO– donor, menadione sodium bisulfite (MSB) as the O2–• donor, NOC-18 as the NO donor, and the RAW264.7 cells were divided into six groups, namely, A, B, C, D, E, and F. Then, phosphate-buffered saline (PBS, pH 7.4) was added to group A, an SIN-1 solution at a final concentration of 100 μM was added to group B, an SIN-1 solution at a final concentration of 1 mM was added to group C, a mixed solution containing SIN-1 and tetracycline (inhibitor) at final concentrations of 1 mM and 100 μM, respectively, was added to group D, MSB was added at a final concentration of 100 μM to group E, and a 500 μM NOC-18 solution was added to group F. After incubation for 2 h, the cells were imaged using the dual-channel fluorescence imaging technique. The results shown in Figure S8 in the Supporting Information reveal that, compared to the control group A, after adding 100 μM SIN-1 to group B, the fluorescence at the 780 nm channel decreased and the fluorescence at the 670 nm channel increased, while in group C, after adding 1 mM SIN-1, the fluorescence at the 780 nm channel almost disappeared and the fluorescence at the 670 nm channel significantly increased. Additionally, the fluorescence intensities of the two channels in group D were almost identical to that in group A after adding 1 mM SIN-1 and 100 μM inhibitor, indicating that tetracycline completely inhibited the formation of ONOO–. In groups E and F, the fluorescence intensity of two channels was also identical to that in group A, as the O2–• or NO donor alone could not generate ONOO–. These findings show that the NI-BQD-Cy7 nanoprobe can specifically recognize ONOO– in living cells and thus can be used for ONOO– imaging.
Kinetic Range of NI-BQD-Cy7 Nanoprobe for the Detection of ONOO– in Living Cells
To investigate the kinetic range for ONOO– detection by the NI-BQD-Cy7 nanoprobe in living cells, RAW264.7 cells at the appropriate density were seeded in five 35 mm confocal imaging dishes and incubated for 20 h. Subsequently, 50 mL of the PBS solution containing 0, 0.1, 0.3, 0.6, and 1 mM SIN-1 was added, respectively, into the above five cell culture dishes, and after incubation for 2 h, each group of cells was subjected to dual-channel fluorescence imaging. The results shown in Figure 4A reveal that with the increase of SIN-1 concentration, the fluorescence intensity at the 780 nm channel gradually decreases and the fluorescence intensity at the 670 nm channel gradually increases (Figure 4B). The results also show that there is a good linear relationship between the logarithmic value of the fluorescence intensity ratio (F670/F780) of two channels and the concentration of SIN-1 in the range of 0–1000 μM (Figure 4C), as indicated by the linear regression equation: log(F670/F780) = 4.453 × 10⁻⁴CSIN-1 + 0.1765, R2 = 0.9964.
Figure 4.
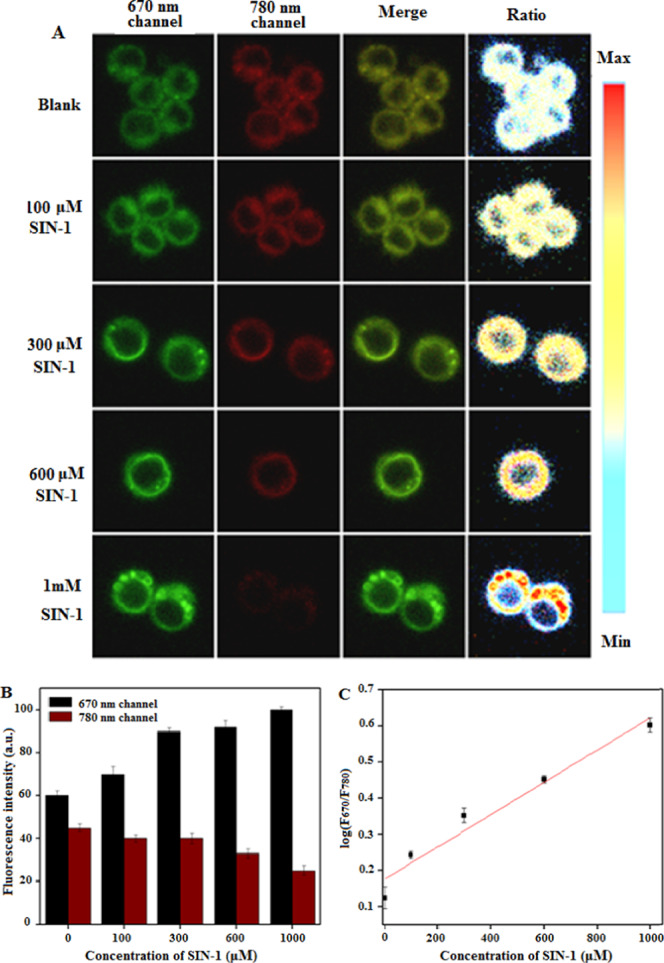
Dual-channel ratiometric fluorescence imaging of living cells in the presence of different concentrations of exogenous ONOO– (A); the fluorescence intensity in two channels in the presence of different concentrations of SIN-1 (B); and the linear relationship between the fluorescence intensity ratio (F670/F780) of the two channels and the concentrations of SIN-1 (C).
Ratiometric Fluorescence Imaging of Endogenous ONOO– in Living Cells
To study the imaging of endogenous ONOO– in living cells, lipopolysaccharides (LPS), γ-interferon (INF-γ), and phorate (PMA) with and without their inhibitors were used to induce or inhibit the production of ONOO– in RAW264.7 cells. RAW264.7 cells at an appropriate density were seeded in four separate 35 mm confocal imaging plates, namely, A, B, C, and D. After incubation for 20 h, the NI-BQD-Cy7 nanoprobes were added to each plate, and then 50 mL of PBS solution was added to group A and 50 mL of a PBS solution containing 50 ng/mL INF-γ and 1 μg/mL LPS was added to other three groups, and the cells were incubated for 4 h. Eventually, 4 μL of PBS solution was added to group A; 25 nM PMA solution was added to group B; a mixed solution containing 25 nM PMA and 100 μM 1400W dihydrochloride acid (1400W) (inhibitor of inducible NO synthase (iNOS), thereby inhibiting the production of ONOO–) was added to group C; and a mixed solution containing 25 nM PMA and 100 μM apocynin (inhibitor of NADPH oxidase (NOX), thereby inhibiting the production of ONOO–) was added to group D. After incubation for 30 min, the cells in each group were examined by dual-channel fluorescence imaging. The results shown in Figure S9 in the Supporting Information reveal that, compared to the blank control group A, the fluorescence at the 780 nm channel decreased and the fluorescence at the 670 nm channel increased in group B after adding PMA. In RAW264.7 cells stimulated by PMA, the formation of ONOO– can be regulated by iNOS and NOX. When 1400W and apocynin (inhibitors of iNOS and NOX, respectively) were added to groups C and D, the fluorescence intensity of the two channels was almost the same as that in group A. The above experimental results indicate that ONOO– is formed from the rapid reaction of nitric oxide radical (NO•) and superoxide anion radical (O2–•) in cell, and is mainly produced in the mitochondria. When O2–• or NO• existed alone in cells, no ONOO– was produced. These results further support the mechanism of ONOO– production in cells.
Real-Time Tracing the Generation of Endogenous ONOO– in Single Living Cells
The generation of endogenous ONOO– in single living cells was monitored by in situ ratiometric fluorescence imaging using the developed nanoprobe. RAW264.7 cells were inoculated in 35 mm confocal imaging dishes. When the cells reached a suitable density, the NI-BQD-Cy7 nanoprobe was added and the cells were incubated for 6 h. Subsequently, the cells were incubated with a mixed solution containing 50 ng/mL INF-γ and 1 μg/mL LPS for 4 h. After adding 25 nM PMA, a single cell was imaged on a confocal microscopic imaging system at 0, 5, 10, 20, 30, and 40 min. The results displayed in Figure 5 show that with the increase of incubation time, the fluorescence intensity of the single living cell at the 780 nm channel gradually decreases, while the fluorescence intensity at the 670 nm channel gradually increases (Figure 5A,5B). The results also show that there was a good linear relationship between the logarithmic value of the fluorescence intensity ratio (F670/F780) of the two channels and the incubation time within the 0–40 min period (Figure 5C), as indicated by the linear regression equation: log(F670/F780) = 0.01383T (min) + 0.08668, R2 = 0.9995. These results showed that the NI-BQD-Cy7 nanoprobe can real-time trace the generation of endogenous ONOO– in a single cell. Moreover, it was also found that the generation of endogenous ONOO– increased linearly within 0–40 min.
Figure 5.
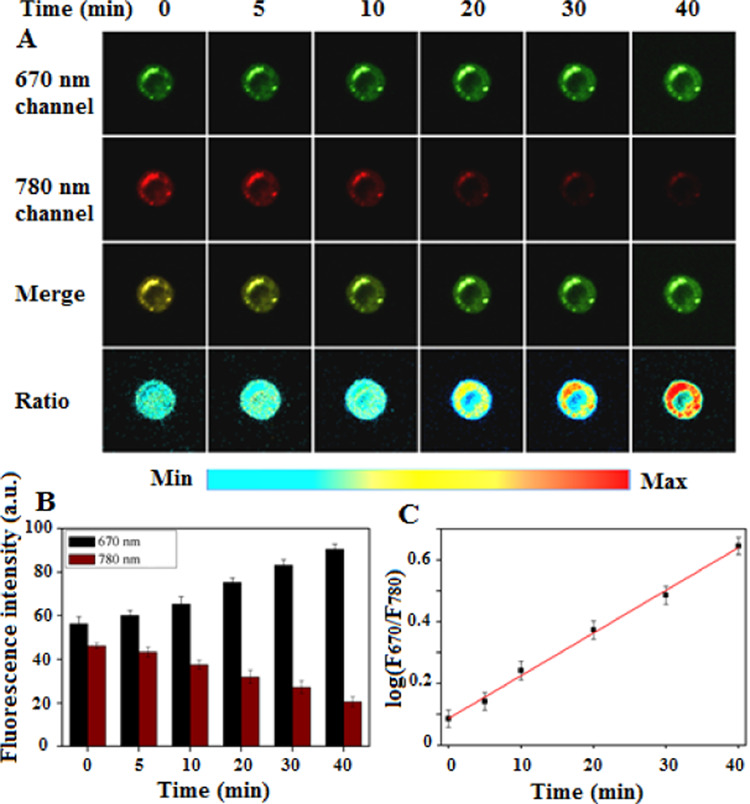
(A) Real-time tracing the generation of endogenous ONOO– in a single living cell by ratiometric fluorescence images. (B) Change of the single-cell fluorescence intensity with time in two fluorescence channels. (C) Linear relationship between the logarithmic value of the fluorescence intensity ratio (F670/F780) at the two channels and incubation time within 0–40 min.
Stability of NI-BQD-Cy7 Fluorescent Nanoprobe In Vivo
To achieve the ratiometric fluorescence imaging of ONOO– in vivo, the stability of the fluorescent nanoprobe in vivo was investigated. Two male nude mice (10 week old, weight of about 20 g) were evaluated. One was injected with saline (150 μL), and the other with the NI-BQD-Cy7 nanoprobe (3 mg/mL,150 μL) in the abdominal cavity at ca. 2–4 mm depth. After anesthesia with isoflurane and halothane, the mice were imaged using a small animal imaging system. After injecting NI-BQD-Cy7, the fluorescence at the 700 ± 30 and 790 ± 30 nm channels was collected at 0.5, 1.5, and 4 h under excitation at 650 nm.28 The results shown in Figure 6 reveal that the fluorescence intensity at two channels remains stable for 4 h, indicating that the developed nanoprobe is suitable for the ratiometric fluorescence imaging of ONOO– in vivo.
Figure 6.
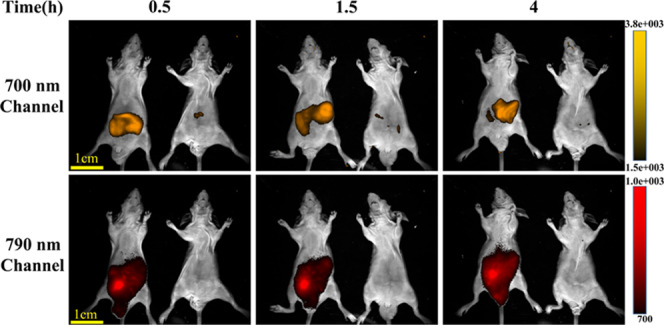
Stability of the fluorescent NI-BQD-Cy7 nanoprobe in vivo. The imaging parameters are the excitation wavelength: 650 nm; receiving filter wavelength: 700 and 790 nm; power: 400 W; and irradiation time: 20 s.
Real-Time Tracing the Generation of Endogenous ONOO– In Vivo
In situ ratiometric fluorescence imaging monitoring the generation of endogenous ONOO– in vivo was investigated using NI-BQD-Cy7 as the nanoprobe and acetaminophen (APAP) as the ONOO–-inducing agent.26 The NI-BQD-Cy7 nanoprobe was injected into the diaphragm of male nude mice (3 mg/mL, 150 μL), and after 30 min, the APAP (500 mg/kg) was also injected into the diaphragm of the mice. The mice were anesthetized with isoflurane and halothane, and then the fluorescence at the 700 ± 30 and 790 ± 30 nm channels was collected at 10, 30, 50, and 70 min after injection of APAP. The results presented in Figure 7A show that with prolongation of time after treatment with APAP, the fluorescence intensity at the 700 ± 30 nm channel gradually increases, while the fluorescence intensity at the 790 ± 30 nm channel gradually decreases (Figure 7B). The fluorescence intensity ratio of two channels (F700/F790) gradually increases with the prolongation of time but slowed down after 50 min (Figure 7C). These results show that the NI-BQD-Cy7 nanoprobe can be used for in situ ratiometric imaging to monitor the production of ONOO– in vivo as well as in the diagnosis of ONOO– related diseases in vivo.
Figure 7.
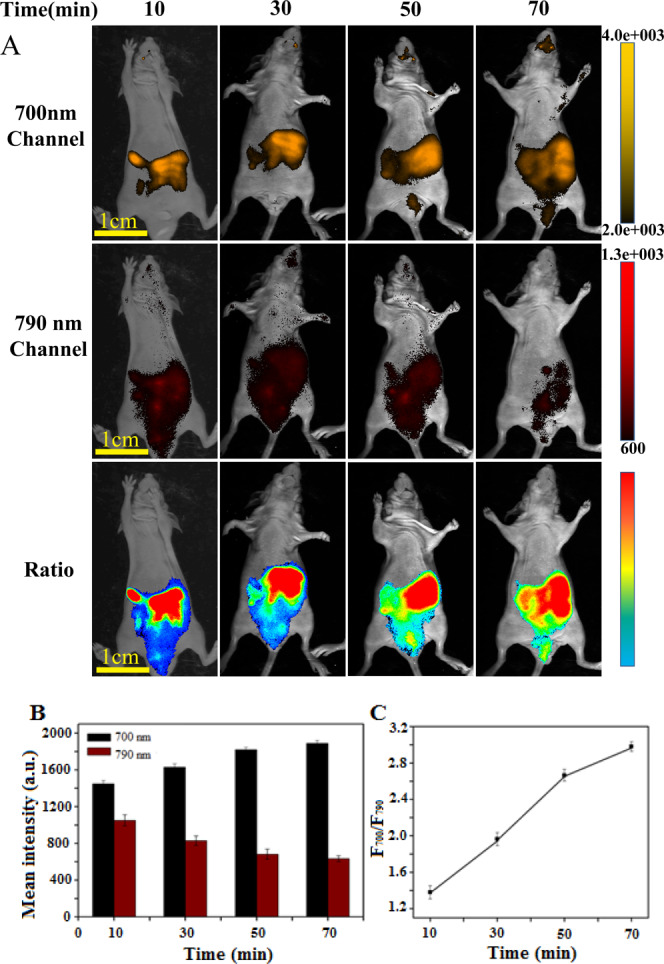
(A) Real-time tracing the generation of endogenous ONOO– in vivo by ratiometric fluorescence images. The imaging parameters are the same as those in Figure 6. (B) Change of fluorescence intensity of endogenous ONOO– in vivo with time in two channels. (C) Relationship between the fluorescence intensity ratio (F700/F790) of two channels and incubation time within 0–70 min.
Conclusions
In summary, we have prepared NIR luminous biomass quantum dots (NI-BQDs) from holly leaves and subsequently covalently coupled them with the NIR dye Cy7 to construct an NIR dual-emission ratiometric fluorescent nanoprobe (NI-BQD-Cy7) with specificity for ONOO–. This nanoprobe has the characteristics of low cytotoxicity, excellent biocompatibility, high specificity, and strong photobleaching resistance. Additionally, it can overcome the measurement error caused by the stability fluctuation of the measuring instrument itself, the uneven distribution of the probe in cells and vivo, and the background from biological tissue. The nanoprobe has high sensitivity and excellent selectivity for ONOO–, and the detection limit is as low as 8.5 nM. Other small RNS and ROS molecules do not interfere with the measurement of ONOO–. Using the proposed method, we have further proved the mechanism of formation of ONOO– in cells and found that the amount of endogenous ONOO– produced in single cell increased linearly with the increase of stimulating time by INF-γ, LPS, and PMA. In addition, we also further prove that acetaminophen (APAP) can produce ONOO– in vivo. For the first time, this ratiometric fluorescence imaging technique was used to trace the generation of endogenous peroxynitrite in single living cells. Future application of this technique is anticipated to play a key role in biomedical research and clinical diagnosis of ONOO–-related diseases.
Experimental Section
Reagents and Materials
Oleic acid, polyoxylenediamine (NH2-PEG-NH2, MW = 2000), 1-ethyl-(3-dimethyl aminopropyl) carbodiimide hydrochloric acid (EDC), N-hydroxysuccinimide (NHS), potassium superoxide (KO2), 3-morpholinosy-dnonimine (SIN-1), and apocynin were purchased from Shanghai Aladdin Biochemical Technology Co., Ltd. (Shanghai, China). 2-(N,N-diethylamino)-diazene-2-oxodiethylammonium salt (NONOate), tert-butylhy-drogen peroxide (tBuOOH), diethylenetriamine/nitric oxide adduct, (NOC-18), tetracycline (minocycline), menadione sodium bisulfite (MSB), and 1400W dihydrochloride acid (1400W) were purchased from Sigma-Aldrich Company (St Louis, MO). Lipopolysaccharide (LPS), phorate (PMA), and PBS were purchased from Beijing Sorebao Technology Co. Ltd. (Beijing, China). Interferon-γ (INF-γ) and dialysis bags (MWCO: 1000 Da; MWCO: 2000 Da) were purchased from Shanghai Shenggong Bioengineering Co., Ltd. (Shanghai, China). MitoLite RED FX600, LysoBrite RED, Cyanine7 amine (Cy7-NH3+), and Cyanine7 monosuccinimidyl ester (Cy7 NHS ester) were purchased from AAT Bioquest, Inc. (Sunnyvale, CA). NucView was purchased from GeneCopoeia (Rockville, MD). The cell line used in this study, RAW264.7 (a mouse monocyte macrophage leukemia cell line), was purchased from the Cell Bank of the typical Culture Storage Committee of the Chinese Academy of Sciences/Cell Resource Center of the Shanghai Institute of Life Sciences of the Chinese Academy of Sciences (Shanghai, China). All nude mice were purchased from Hunan Silaike Jingda Laboratory Animal Co., Ltd. (Changsha, China). The animal experiments were approved by the Animal Ethics Committee of Guangxi Normal University (No. 20150325-XC). All of the other chemical reagents in the experiment are pure for analysis made in China, and the water used in the experiment was of specific resistance 18.2 MΩ·cm.
Primary Instruments
A Cary Eclipse fluorescence spectrometer (Agilent Technologies) was used for recording the fluorescence spectrum. A Cary-60 UV–vis spectrophotometer (Agilent Technologies) was used for recording the UV–vis absorption spectrum. A Fourier transform infrared (FTIR) spectrometer (PerkinElmer, Inc.) was used for the characterization of the NI-BQD surface groups. A Rigaku X-ray powder diffractometer (Rigaku Corp.) was used for X-ray diffraction (XRD) analysis. An FLS980 time-resolved fluorescence spectrometer (Edinburgh Instruments) was used for fluorescence lifetime determination. A transmission electron microscope (Philips) was used to characterize the particle size of the NI-BQDs. An ESCALAB X-ray photoelectron spectrometer (Thermo Fisher) was used for the elemental analysis of NI-BQDs. An ELx800 enzyme labeling instrument (Bio-Tek Instruments) was employed for cytotoxicity analysis. The Zeiss LSM710 laser scanning confocal microscope system (Carl Zeiss Microscopy) was used for living cell imaging. The Kodak in vivo FX Pro imaging system (Kodak) was used for in vivo imaging analysis.
Preparation of NI-BQDs and NI-BQD-Cy7
Fresh holly leaves were washed and dried in air and cut into pieces. About 20 g of holly leaves fragments were ground for 3 min in an agate mortar with 20 mL of absolute ethanol. Then, the holly leaves solution was poured into a beaker, mixed with 10 mL of acetone, stirred uniformly, left to stand for 30 min, and filtered to obtain the chlorophyll extract. Oleic acid (20 mL) was mixed with 0.05 g of NH2-PEG-NH2 in a round-bottom flask and heated to 250 °C with stirring until the solution turned orange-red. After the solution was cooled to room temperature, 5 mL of the chlorophyll extract was added to this solution. Subsequently, the mixed solution was heated to 180 °C and reacted under stirring for 3 h. After cooling to room temperature, 12 M HCl was added to adjust the acidity of the solution to strong acidity and stirring was continued for 12 h. The mixture solution was transferred to a funnel and 1 mL of ultrapure water was added and shaken well. After static delamination, the underlying layer solution was transferred to a beaker and the pH value of the solution was adjusted to neutral with saturated NaOH solution. Then, the solution was filtered with a 0.22 μm filter membrane to remove the large particles. The filtrate was transferred to a dialysis bag (MWCO: 1000 Da) and dialyzed in ultrapure water for 24 h to obtain the NI-BQD solution. Then, 10 mL of the NI-BQD solution and 35 μL of 3.794 mM Cy7 NHS ester solution were mixed and stirred for 1 h at room temperature. The resulting solution was transferred to a dialysis bag (MWCO: 2000 Da) and dialyzed in ultrapure water for 24 h to remove the excess Cy7 NHS ester. Then, 0.1 g of EDC and 0.01 g of NHS were added to the dialyzed solution, and the mixed solution was stirred for 30 min. Then, 35 μL of 2.27 mM Cy7-NH3+ solution was added into the mixed solution and the reaction was continued for 1 h. The resulting solution was transferred to a dialysis bag (MWCO: 2000 Da) and dialyzed for 24 h to obtain the NI-BQD-Cy7 solution.
Ratiometric Fluorescence Detection of ONOO– in the Solution
The solutions of 1.5 mL of 0.7 M H2O2, 1.5 mL of 0.6 M HCl, 3 mL of 0.6 M NaNO2, and 3 mL of 1.5 M NaOH were transferred into a 25 mL flask, and a yellowish solution was obtained by mixing quickly. The excess H2O2 was completely decomposed by taking an appropriate amount of the above solution and adding an appropriate amount of MnO2 to it. Then, the solution was filtered using a 0.22 μm filter membrane to obtain the ONOO– solution. The concentration of ONOO– was calibrated by a UV–vis spectrophotometer, and then the calibrated ONOO– solution was diluted to 100 μM with a PBS (pH 7.4) solution and stored in a 4 °C refrigerator. Different concentrations of ONOO– solutions were added to 90 μL of the NI-BQD-Cy7 solution and evenly mixed. After 5 min, the fluorescence intensity was measured at wavelengths of 670 and 780 nm at the excitation wavelength of 405 nm.
Colocalization Imaging of Suborganelle
RAW264.7 cells were seeded at an appropriate density in a 35 mm confocal Petri dish and incubated for 20 h in an incubator (at 37 °C, 5% CO2). Afterward, the NI-BQD-Cy7 nanoprobe was added and the cells were further incubated for 8 h. Subsequently, the location reagents NucView for the nucleus, LysoBrite NIR for lysosomes, and MitoLite Deep Red FX660 for mitochondria were added. After incubating the RAW264.7 cells for 30 min, colocalization imaging was performed by confocal laser scanning microscopy on a Zeiss LSM710 confocal laser scanning microscope system.
Ratiometric Fluorescence Imaging of Exogenous ONOO– in Living Cells
RAW264.7 cells were seeded at the appropriate density in a 35 mm confocal imaging dish, and after incubation for 20 h in an incubator (at 37 °C, 5%CO2), the NI-BQD-Cy7 nanoprobe (final concentration of 120 μg/mL) was added and the cells were continued to incubate for 6 h. Then, SIN-1 was used as the ONOO– donor, MSB as the O2–• donor, NOC-18 as the NO donor, and the RAW264.7 cells were divided into six groups, namely, A, B, C, D, E, and F. Then, PBS solution (pH 7.4) was added to group A, an SIN-1 solution at a final concentration of 0.1 mM was added to group B, an SIN-1 solution at a final concentration of 1 mM was added to group C, a mixed solution at a final concentration of 1 mM SIN-1 and 100 μM tetracycline was added to group D, MSB solution at a final concentration of 100 μM was added to group E, and NOC-18 solution at 500 μM was added to group F. After incubation for 2 h, cell imaging at the 630–720 and 740–800 nm channels was collected at 405 nm laser excitation on the Zeiss LSM710 confocal laser scanning microscope system.
Ratiometric Fluorescence Imaging of Endogenous ONOO– in Living Cells
RAW264.7 cells were seeded at an appropriate density in four 35 mm confocal imaging plates, namely, A, B, C, and D, and after incubation for 20 h in an incubator (at 37 °C, 5% CO2), the NI-BQD-Cy7 nanoprobes (final concentration of 120 μg/mL) was added to each plate, and then 50 mL of PBS was added to group A and 50 ng/mL of INF-γ (final concentration) and 1 μg/mL LPS (final concentration) were added to the other three groups, and the plates were incubated (at 37 °C, 5% CO2) for 4 h. Ultimately, 4 μL of PBS solution was added to group A, a mixed solution containing 25 nM PMA and 2 μL PBS was added to group B, a mixed solution containing 25 nM PMA and 100 μM 1400W was added to group C, and a mixed solution containing 25 nM PMA and 100 μM apocynin was added to group D. After incubation for 30 min, cell imaging at the 630–720 and 740–800 nm channels was collected at 405 nm laser excitation by CLSM using a Zeiss LSM710 confocal laser scanning microscope system.
Real-Time Tracing the Generation of Endogenous ONOO– in Single Living Cells
RAW264.7 cells were seeded at the appropriate density in 35 mm confocal imaging dishes. The cells were cultured to a suitable density and incubated with the NI-BQD-Cy7 nanoprobe (final concentration of 120 μg/mL) for 6 h. Then, 50 ng/mL INF-γ (final concentration) and 1 μg/mL LPS (final concentration) were added and the cells were incubated for 4 h. After adding 25 nM PMA, a single cell was imaged on the confocal microscope imaging system at 0, 5, 10, 20, 30, and 40 min.
Real-Time Tracing the Generation of Endogenous ONOO– In Vivo
The NI-BQD-Cy7 nanoprobe was injected into the diaphragm of male nude mice (3 mg/mL,150 μL). After 30 min, the APAP (500 mg/kg) was also injected into the diaphragm of the mice. The mice were anesthetized with isoflurane and halothane, and then the fluorescence at the 700 ± 30 and 790 ± 30 nm channels was collected with an exposure time of 30 s on the fluorescence imaging system for small animals at 10, 30, 50, and 70 min after injection of APAP.
Acknowledgments
This work was supported by the National Natural Science Foundations of China (Nos. 21874030, 21575031) and BAGUI Scholar Program.
Supporting Information Available
The Supporting Information is available free of charge at https://pubs.acs.org/doi/10.1021/acsomega.0c01320.
High-resolution XPS spectra of NI-BQDs for C 1s, N 1s, and O 1s; ζ-potential of the as-prepared NI-BQDs and NI-BQD-Cy7; UV–vis spectra of NI-BQDs and NI-BQD-Cy7; stability of NI-BQD-Cy7 fluorescent nanoprobe in aqueous solution; cytotoxicity of the NI-BQDs and NI-BQD-Cy7 nanoprobes; kinetics curve for the change of fluorescence intensity of NI-BQD-Cy7 after the addition of ONOO–; selectivity of the NI-BQD-Cy7 nanoprobe; dual-channel ratiometric fluorescence images of exogenous ONOO– in living cells; and dual-channel ratiometric fluorescence images of endogenous ONOO– in living cells (PDF)
The authors declare no competing financial interest.
Supplementary Material
References
- Szabó C.; Ischiropoulos H.; Radi R. Peroxynitrite: biochemistry, pathophysiology and development of therapeutics. Nat. Rev. Drug Discovery 2007, 6, 662–680. 10.1038/nrd2222. [DOI] [PubMed] [Google Scholar]
- Radi R. Protein tyrosine nitration: biochemical mechanisms and structural basis of functional effects. Acc. Chem. Res. 2013, 46, 550–559. 10.1021/ar300234c. [DOI] [PMC free article] [PubMed] [Google Scholar]
- Beckman J. S.; Koppenol W. H. Nitric oxide, superoxide, and peroxynitrite: the good, the bad, and ugly. Am. J. Physiol.: Cell Physiol. 1996, 271, C1424–C1437. 10.1152/ajpcell.1996.271.5.C1424. [DOI] [PubMed] [Google Scholar]
- Li J.; Su J.; Li W.; Liu W.; Altura B. T.; Altura B. M. Peroxynitrite induces apoptosis in canine cerebral vascular muscle cells: possible relation to neurodegenerative diseases and strokes. Neurosci. Lett. 2003, 350, 173–177. 10.1016/S0304-3940(03)00881-4. [DOI] [PubMed] [Google Scholar]
- Virág L.; Szabó E.; Gergely P.; Szabó C. Peroxynitrite-induced cytotoxicity: mechanism and opportunities for intervention. Toxicol. Lett. 2003, 140–141, 113–124. 10.1016/S0378-4274(02)00508-8. [DOI] [PubMed] [Google Scholar]
- Ferrer-Sueta G.; Radi R. Chemical biology of peroxynitrite: kinetics, diffusion, and radicals. ACS Chem. Biol. 2009, 4, 161–177. 10.1021/cb800279q. [DOI] [PubMed] [Google Scholar]
- Pacher P.; Beckman J. S.; Liaudet L. Nitric oxide and peroxynitrite in health and disease. Physiol. Rev. 2007, 87, 315–424. 10.1152/physrev.00029.2006. [DOI] [PMC free article] [PubMed] [Google Scholar]
- Sedgwick A. C.; Han H. H.; Gardiner J. E.; Bull S. D.; He X. P.; James T. D. Long-wavelength fluorescent boronate probes for the detection and intracellular imaging of peroxynitrite. Chem. Commun. 2017, 53, 12822–12825. 10.1039/C7CC07845E. [DOI] [PubMed] [Google Scholar]
- Li J.; Lim C. S.; Kim G.; Kim H. M.; Yoon J. Highly selective and sensitive two-photon fluorescence probe for endogenous peroxynitrite detection and its applications in living cells and tissues. Anal. Chem. 2017, 89, 8496–8500. 10.1021/acs.analchem.7b02059. [DOI] [PubMed] [Google Scholar]
- Wu D.; Ryu J. C.; Chung Y. W.; Lee D.; Ryu J. H.; Yoon J. H.; Yoon J. A far-red-emitting fluorescence probe for sensitive and selective detection of peroxynitrite in live cells and tissues. Anal. Chem. 2017, 89, 10924–10931. 10.1021/acs.analchem.7b02707. [DOI] [PubMed] [Google Scholar]
- Chen Z. J.; Tian Z.; Kallio K.; Oleson A. L.; Ji A.; Borchardt D.; Jiang D.; Remington S. J.; Ai H. The N–B interaction through a water bridge: understanding the chemoselectivity of a fluorescent protein based probe for peroxynitrite. J. Am. Chem. Soc. 2016, 138, 4900–4907. 10.1021/jacs.6b01285. [DOI] [PMC free article] [PubMed] [Google Scholar]
- Yu F.; Li P.; Wang B.; Han K. Reversible near-infrared fluorescent probe introducing tellurium to mimetic glutathione peroxidase for monitoring the redox cycles between peroxynitrite and glutathione in vivo. J. Am. Chem. Soc. 2013, 135, 7674–7680. 10.1021/ja401360a. [DOI] [PubMed] [Google Scholar]
- Yu F.; Li P.; Li G.; Zhao G.; Chu T.; Han K. A near-IR reversible fluorescent probe modulated by selenium for monitoring peroxynitrite and imaging in living cells. J. Am. Chem. Soc. 2011, 133, 11030–11033. 10.1021/ja202582x. [DOI] [PubMed] [Google Scholar]
- Cheng D.; Pan Y.; Wang L.; Zeng Z.; Yuan L.; Zhang X.; Chang Y. T. Selective visualization of the endogenous peroxynitrite in an inflamed mouse model by a mitochondria-targetable two-photon ratiometric fluorescent probe. J. Am. Chem. Soc. 2017, 139, 285–292. 10.1021/jacs.6b10508. [DOI] [PubMed] [Google Scholar]
- Sedgwick A. C.; Dou W. T.; Jiao J. B.; Wu L.; Williams G. T.; Jenkins A. T. A.; Bull S. D.; Sessler J. L.; He X. P.; James T. D. An ESIPT probe for the ratiometric imaging of peroxynitrite facilitated by binding to Aβ-aggregates. J. Am. Chem. Soc. 2018, 140, 14267–14271. 10.1021/jacs.8b08457. [DOI] [PubMed] [Google Scholar]
- Jia X.; Chen Q.; Yang Y.; Tang Y.; Wang R.; Xu Y.; Zhu W.; Qian X. FRET-based mito-specific fluorescent probe for ratiometric detection and imaging of endogenous peroxynitrite: dyad of Cy3 and Cy5. J. Am. Chem. Soc. 2016, 138, 10778–10781. 10.1021/jacs.6b06398. [DOI] [PubMed] [Google Scholar]
- Fan Y.; Wang P.; Lu Y.; Wang R.; Zhou L.; Zheng X.; Li X.; Piper J. A.; Zhang F. Lifetime-engineered NIR-II nanoparticles unlock multiplexed in vivo imaging. Nat. Nanotechnol. 2018, 13, 941–946. 10.1038/s41565-018-0221-0. [DOI] [PubMed] [Google Scholar]
- Wang S.; Liu L.; Fan Y.; El-Toni A. M.; Alhoshan M. S.; Li D.; Zhang F. In vivo high-resolution ratiometric fluorescence imaging of inflammation using NIR-II nanoprobes with 1550 nm emission. Nano Lett. 2019, 19, 2418–2427. 10.1021/acs.nanolett.8b05148. [DOI] [PubMed] [Google Scholar]
- Sun C.; Li B.; Zhao M.; Wang S.; Lei Z.; Lu L.; Zhang H.; Feng L.; Dou C.; Yin D.; Xu H.; Cheng Y.; Zhang F. J-Aggregates of cyanine dye for NIR-II in vivo dynamic vascular imaging beyond 1500 nm. J. Am. Chem. Soc. 2019, 141, 19221–19225. 10.1021/jacs.9b10043. [DOI] [PubMed] [Google Scholar]
- Liu L.; Wang S.; Zhao B.; Pei P.; Fan Y.; Li X.; Zhang F. Er3+ sensitized 1530 nm to 1180 nm second near-infrared window upconversion nanocrystals for in vivo biosensing. Angew. Chem., Int. Ed. 2018, 57, 7518–7522. 10.1002/anie.201802889. [DOI] [PubMed] [Google Scholar]
- Zhao M.; Wang R.; Li B.; Fan Y.; Wu Y.; Zhu X.; Zhang F. Precise in vivo inflammation imaging using in situ responsive crosslinking of glutathione-modified ultra-small NIR-II lanthanide nanoparticles. Angew. Chem., Int. Ed. 2019, 58, 2050–2054. 10.1002/anie.201812878. [DOI] [PubMed] [Google Scholar]
- Fan Y.; Wang S.; Zhang F. Optical multiplexed bioassays for improved biomedical diagnostics. Angew. Chem., Int. Ed. 2019, 58, 13208–13219. 10.1002/anie.201901964. [DOI] [PubMed] [Google Scholar]
- Li D.; Wang S.; Lei Z.; Sun C.; El-Toni A. M.; Alhoshan M. S.; Fan Y.; Zhang F. Peroxynitrite activatable NIR-II fluorescent molecular probe for drug-induced hepatotoxicity monitoring. Anal. Chem. 2019, 91, 4771–4779. 10.1021/acs.analchem.9b00317. [DOI] [PubMed] [Google Scholar]
- Hong G.; Antaris A. L.; Dai H. Near-infrared fluorophores for biomedical imaging. Nat. Biomed. Eng. 2017, 1, 0010 10.1038/s41551-016-0010. [DOI] [Google Scholar]
- Zhao P.; He K.; Han Y.; Zhang Z.; Yu M.; Wang H.; Huang Y.; Nie Z.; Yao S. Near-infrared dual-emission quantum dots–gold nanoclusters nanohybrid via co-template synthesis for ratiometric fluorescent detection and bioimaging of ascorbic acid in vitro and in vivo. Anal. Chem. 2015, 87, 9998–10005. 10.1021/acs.analchem.5b02614. [DOI] [PubMed] [Google Scholar]
- Peng J.; Samanta A.; Zeng X.; Han S.; Wang L.; Su D.; Loong D. T. B.; Kang N. Y.; Park S. J.; All A. H.; Jiang W.; Yuan L.; Liu X.; Chang Y. T. Real-tme in vivo hepatotoxicity monitoring through chromophore-conjugated photon-upconverting nanoprobes. Angew. Chem., Int. Ed. 2017, 56, 4165–4169. 10.1002/anie.201612020. [DOI] [PubMed] [Google Scholar]
- Lei Z.; Sun C.; Pei P.; Wang S.; Li D.; Zhang X.; Zhang F. Stable, wavelength-tunable fluorescent dyes in the NIR-II region for in vivo high-contrast bioimaging and multiplexed biosensing. Angew. Chem., Int. Ed. 2019, 58, 8166–8171. 10.1002/anie.201904182. [DOI] [PubMed] [Google Scholar]
- Wang S.; Fan Y.; Li D.; Sun C.; Lei Z.; Lu L.; Wang T.; Zhang F. Anti-quenching NIR-II molecular fluorophores for in vivo high-contrast imaging and pH sensing. Nat Commun. 2019, 10, 1058 10.1038/s41467-019-09043-x. [DOI] [PMC free article] [PubMed] [Google Scholar]
Associated Data
This section collects any data citations, data availability statements, or supplementary materials included in this article.


