

Abstract
Photosynthetic organisms experience wide fluctuations in light intensity and regulate light harvesting accordingly to prevent damage from excess energy. qH is a sustained form of energy dissipation that protects the photosynthetic apparatus under stress conditions. This photoprotective mechanism requires the plastid lipocalin, LCNP, and is prevented by SUPPRESSOR OF QUENCHING1 (SOQ1) under non-stress conditions. However, molecular insight into qH relaxation has yet to be resolved. Here, we isolated and characterized RELAXATION OF QH1 (ROQH1), an atypical short chain dehydrogenase/reductase that functions as a qH relaxation factor in Arabidopsis. The ROQH1 gene belongs to the GreenCut2 inventory specific to photosynthetic organisms, and the ROQH1 protein localizes to the chloroplast stroma lamellae membrane. After a cold and high light treatment, qH does not relax in roqh1 mutants, whereas qH does not occur in ROQH1 overexpressors. When the soq1 and roqh1 mutations are combined, qH can neither be prevented nor relaxed, and soq1 roqh1 displays constitutive qH and light-limited growth. We propose that LCNP and ROQH1 perform dosage-dependent, antagonistic functions to protect the photosynthetic apparatus and maintain light harvesting efficiency in plants.
In natural environments, photosynthetic organisms experience daily fluctuations in light intensity and quality. Light stress occurs when light energy is absorbed in excess of photosynthesis, leading to oxidative damage to the photosynthetic apparatus1. Thus, photosynthetic organisms have evolved a suite of photoprotective responses to prevent damage, including ways to minimize light absorption, detoxify reactive oxygen species, and dissipate excess absorbed light energy as heat2. Thermal dissipation is commonly known as non-photochemical quenching of chlorophyll fluorescence (NPQ) and is comprised of several different processes, originally defined based on their relaxation kinetics and sensitivities to chemical inhibitors3. Currently, different NPQ processes are defined based on the molecular players involved (for review see ref4).
Energy-dependent quenching, qE, occurs within seconds under excess light when acidification of the thylakoid lumen results in protonation of lumen-exposed residues of photosystem II subunit S (PsbS)5 and of violaxanthin de-epoxidase (VDE)6,7. Once protonated, the VDE enzyme is active and can convert violaxanthin to zeaxanthin, a photoprotective carotenoid required alongside PsbS for quenching site formation8–10. Zeaxanthin-dependent quenching, qZ, also relies on zeaxanthin yet it does not require PsbS or a pH gradient (ΔpH) once zeaxanthin has been produced. Instead, qZ involves the binding of zeaxanthin to monomeric antenna proteins11,12, and takes tens of minutes to turn on and off13. Previously, photoinhibitory quenching, qI, included all mechanisms that resulted in the light-induced decrease in the quantum yield of Photosystem II (PSII). This term included all components with slow relaxation kinetics, such as photoinhibition due to PSII photoinactivation and uncharacterized modes of sustained thermal dissipation2,14,15. However, qH, a sustained form of antenna quenching, was recently identified as a distinct NPQ component independent of PsbS, ΔpH, zeaxanthin, STN7 kinase, PSII core protein D1 inactivation and other qI processes16,17.
Previously, a suppressor screen on the Arabidopsis (A. thaliana) npq4 mutant lacking PsbS helped to uncover qH, which is negatively regulated by the SUPPRESSOR OF QUENCHING1 (SOQ1) protein16. SOQ1 is a multi-domain protein of 104 kD that spans the thylakoid membrane. The stroma-exposed region of SOQ1 contains a haloacid dehalogenase-like hydrolase (HAD) domain, and the lumen-exposed region contains a thioredoxin (Trx)-like and β-propeller NHL domain. The lumenal domains are required to suppress qH, whereas the stromal domain is not required16. To gain insight on the molecular mechanism of qH and to identify possible targets of SOQ1, a second suppressor screen was performed on soq1 npq4 and the peripheral antenna of PSII and the plastid lipocalin protein, LCNP, were found to be required for qH to occur17. LCNP is a soluble protein of 29 kD that is localized in the thylakoid lumen and upregulated during abiotic stress such as drought and high light18. Lipocalin proteins can bind small hydrophobic molecules such as fatty acids, pigments, or steroids and have enzymatic activity19. However, the identity of the putative ligand or substrate of LCNP is unknown. Our working model is that under stress conditions, such as cold and high light, SOQ1 inhibition is relieved, and LCNP is either directly involved in quenching site formation, or indirectly through changes to the membrane environment via modification of a hydrophobic molecule. Under non-stress conditions, SOQ1 negatively regulates LCNP either directly or indirectly.
In addition to the chlorina1 (lacking the peripheral antenna of PSII, i.e., light-harvesting complex II, LHCII) and the lcnp mutants, this second suppressor screen generated mutants with constitutive NPQ. We isolated and characterized these mutants, and found they were affected in an atypical short chain dehydrogenase/reductase, subsequently named RELAXATION OF QH1 (ROQH1). Interestingly, roqh1 single mutants display wild-type dark-acclimated chlorophyll fluorescence values and only when combined to the soq1 mutation does the soq1 roqh1 double mutant display a low fluorescence phenotype indicative of possible constitutive NPQ. We tested whether the low, or ‘quenched’, fluorescence phenotype in soq1 roqh1 is LCNP- and antenna-dependent, and whether qH induction or relaxation is affected in roqh1 single mutants. Our findings demonstrate that ROQH1 functions in the relaxation of qH.
A genetic screen uncovered mutants with constitutively quenched fluorescence
Previously, a genetic screen was performed by chlorophyll fluorescence video imaging on mutagenized soq1 npq4 Arabidopsis plants, lacking both SOQ1 and PsbS, to identify molecular players involved in qH17. Through this approach, the chlorina1–4 and −5 and lcnp-2 and −3 mutations were isolated, demonstrating the requirement of LHCII and LCNP for qH to occur (see ref17). In addition, two mutants were isolated with altered maximum chlorophyll fluorescence yield in the dark (Fm) (Figure 1a). Mutant #164 showed severely decreased dark-acclimated minimal fluorescence (Fo) and Fm, and mutant #108 showed mildly decreased Fo and Fm (Figure 1a). The fluorescence yield of #164 and #108 remained low throughout a high light and dark treatment (Supplemental Figure 1a), indicating that the mutants were quenched constitutively. Thus, the NPQ levels of #164 and #108 could not be accurately measured through standard pulse-amplitude modulated fluorometry techniques (Figure 1b). The low fluorescence yield was not due to a lack of chlorophyll, as the total chlorophyll level determined by HPLC analysis of #164 and #108 was slightly higher and unchanged, respectively, compared to the parental strain, soq1 npq4 (Figure 1c). In addition, there were no major differences between wild type and #164 in the accumulation of photosynthetic proteins and complexes (Supplemental Figure 2). We hypothesized that the low Fm may be due to a constitutively active NPQ mechanism. However, #164 and #108 lacked PsbS and accumulated wild type levels of zeaxanthin under standard growth conditions and after a high light treatment (Figure 1d). Thus, fluorescence quenching was not attributable to constitutive qE or qZ. Instead, we hypothesized that the quenched Fo and Fm may be the result of constitutive qH.
Figure 1. Genetic screen uncovered mutants with constitutively quenched fluorescence.
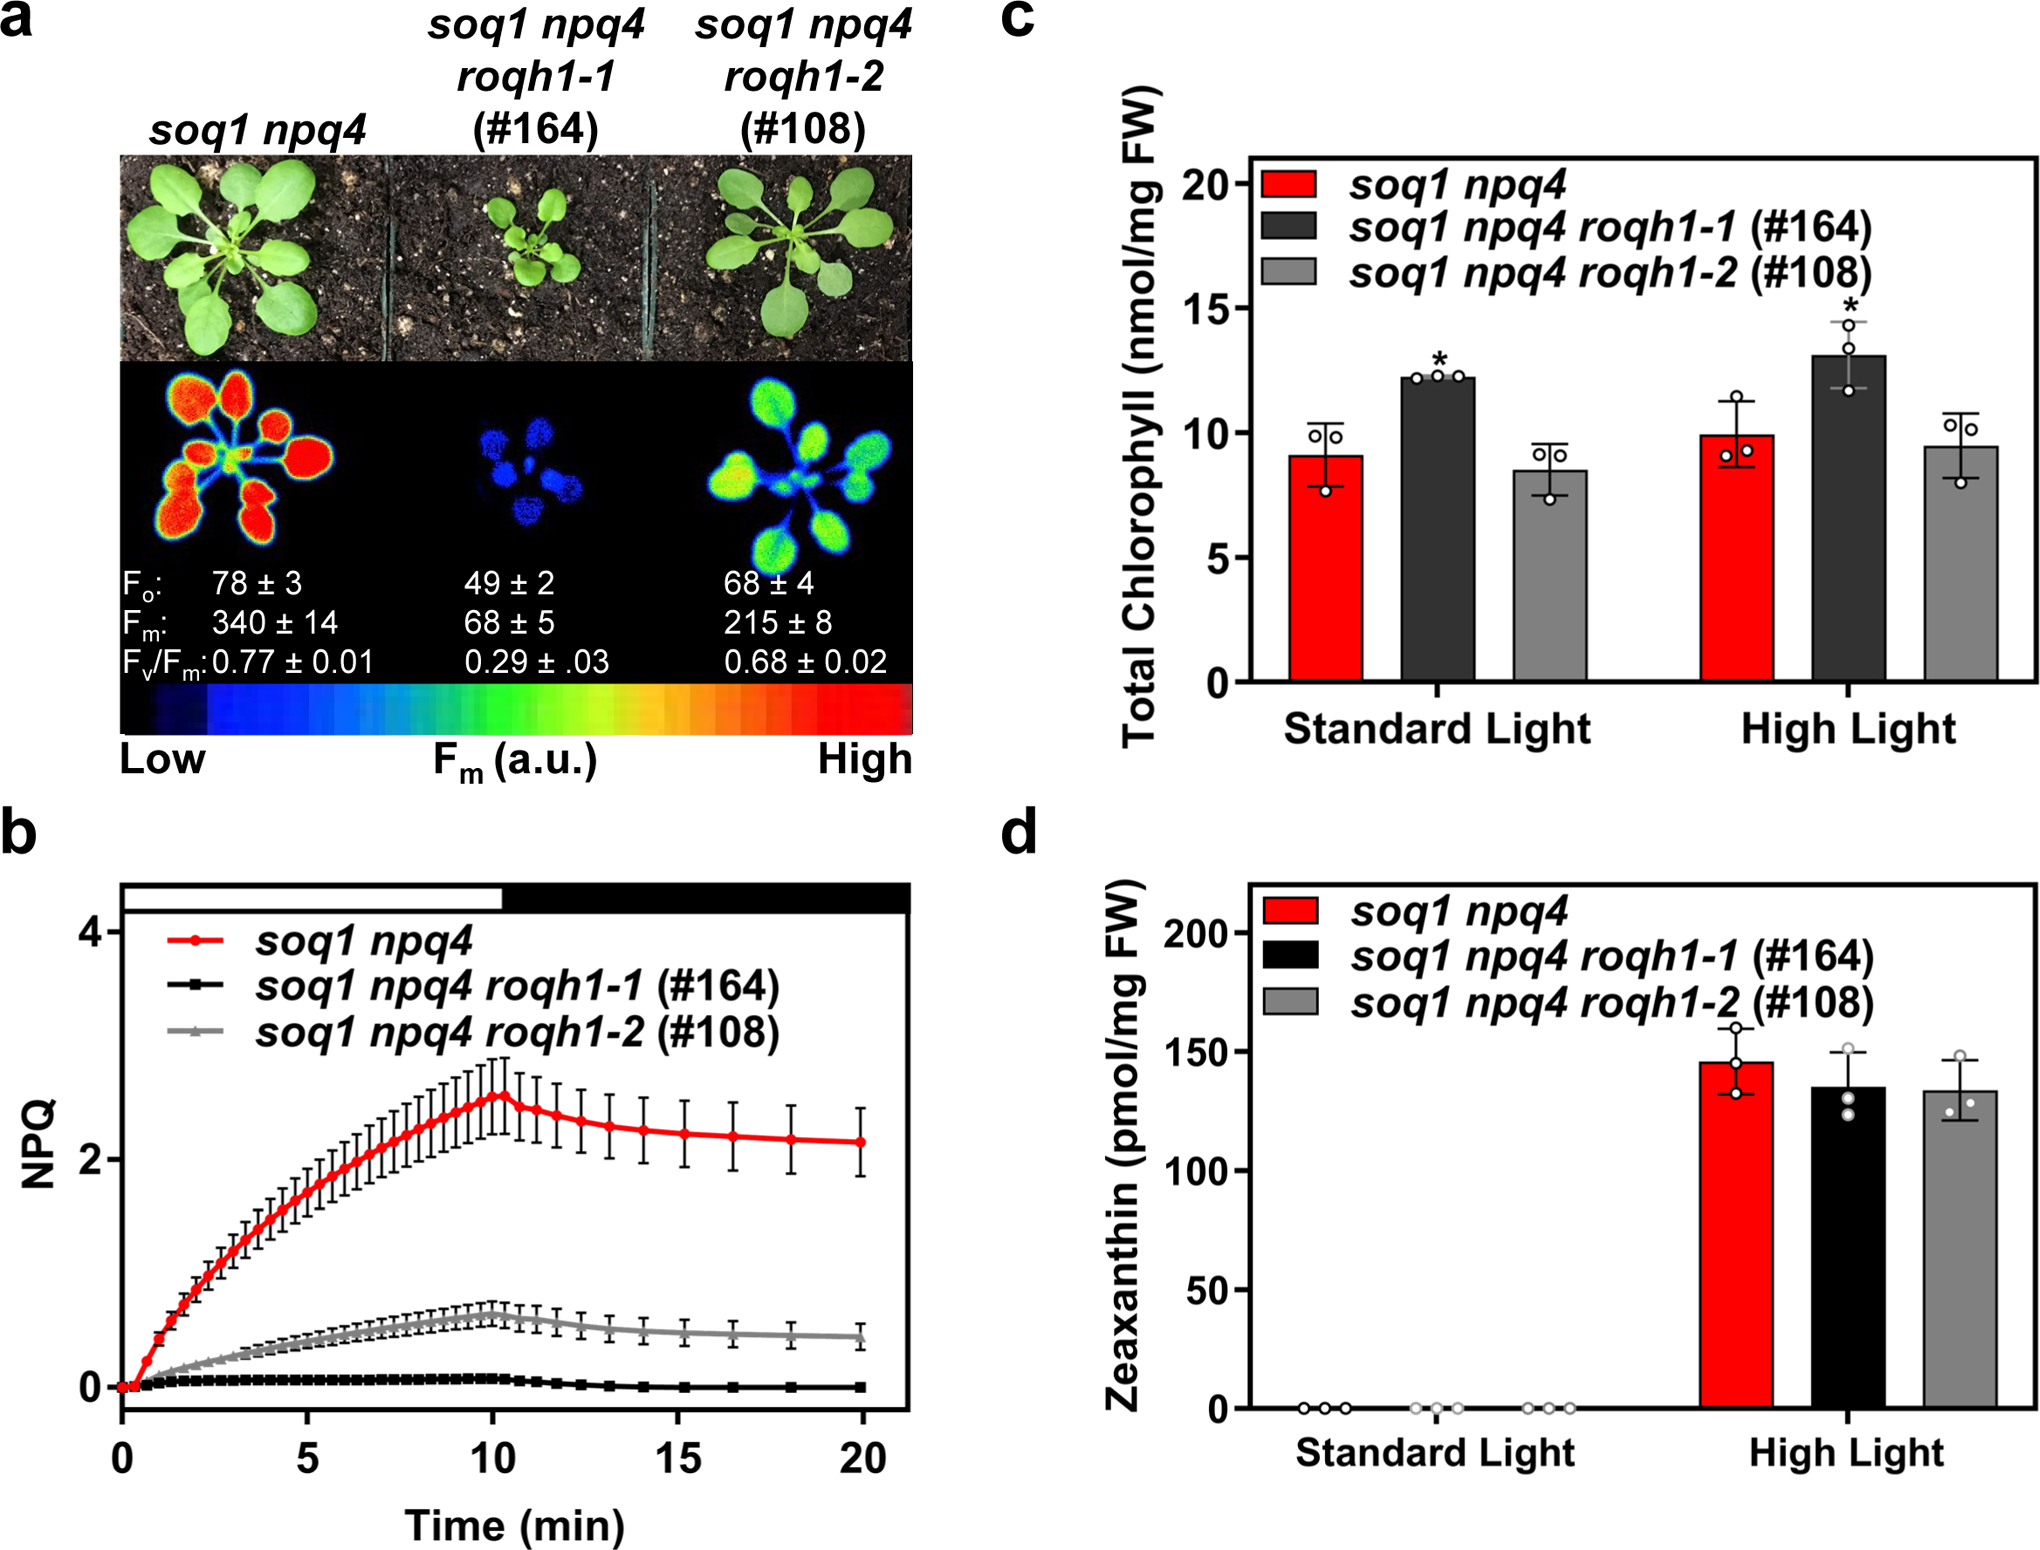
(a) Image of plants and false-colored image of maximum fluorescence (Fm) of 4-week-old soq1 npq4, soq1 npq4 roqh1–1 (#164), and soq1 npq4 roqh1–2 (#108) grown under 150 μmol photons m-2 s-1, 21°C. Average Fo, Fm, and Fv/Fm values ± SD are given with n = 5 individuals. (b) NPQ kinetics of 5-week-old plants. Induction at 1,200 μmol photons m-2 s-1 (white bar) and relaxation in the dark (black bar). Data represent means ± SD, n = 3 individuals. (c) Total chlorophyll and (d) zeaxanthin levels determined by HPLC analysis of 4-week-old plants under standard light conditions (150 μmol photons m-2 s-1) and after a 30-min high light treatment (1,000 μmol photons m-2 s-1) to induce zeaxanthin accumulation. Under standard light conditions, zeaxanthin accumulation isbelow detection limit of 0.15pmol. Tukey’s multiple comparison test shows a significant increase in chlorophylllevels of soq1 npq4 roqh1–1 (#164) compared to soq1 npq4 and soq1 npq4 roqh1–2 (#108). Data shownrepresents means ± SD, n = 3 individuals, * = p-value 0.0103.
Whole-genome sequencing revealed mutations in a gene encoding an atypical short chain dehydrogenase/reductase
To identify the mutation responsible for the low fluorescence phenotype, a mapping-by-sequencing approach was used. Mutant #164 was backcrossed to soq1 npq4, and all progeny from the F1 generation displayed fluorescence and NPQ values similar to soq1 npq4 (Supplemental Figure 3), indicating that the causative gene contained a recessive mutation. From the segregating F2 population, 20.6% of seedlings displayed low Fm, consistent with Mendelian inheritance of a single mutation. The seedlings with low Fm were pooled and compared to the parental strain through whole-genome sequencing. Single nucleotide polymorphism analysis (Supplemental Figure 4) revealed non-synonymous point mutations in seven nuclear genes on chromosome 4 that were enriched in the low Fm pool but absent in the parental strain (Supplemental Tables 1 and 2). The list of candidate genes potentially responsible for the low Fm phenotype was narrowed down using TargetP20 to genes encoding chloroplast-targeted proteins (because a protein involved in NPQ is most likely chloroplast localized). Among the two remaining candidates, only At4g31530 was also disrupted in the mutant #108, strongly suggesting that mutations in this gene caused the low fluorescence phenotype of #108 and #164.
At4g31530 encodes a 29 kD atypical short chain dehydrogenase/reductase protein, subsequently named RELAXATION OF QH1 (ROQH1). The ROQH1 protein is predicted to contain a Rossmann-fold with an NAD(P)-binding motif (GXXGXXG) and a partial catalytic tetrad (D-S-VXXXK) (Figure 2a). #164 and #108 contained allelic mutations in ROQH1, named roqh1–1 and roqh1–2, respectively. G-to-A point mutations were found in the first exon (roqh1–1) and sixth exon (roqh1–2) causing the following amino acid changes: Gly81Asp within the NAD(P)-binding motif in roqh1–1 and Gly211Glu within the partial catalytic tetrad in roqh1–2 (Figure 2a). In addition to roqh1–1 and roqh1–2, we obtained seven insertional mutants potentially affecting At4g31530 expression. Through PCR and immunoblot analysis, we confirmed that three insertional lines were disrupted in the ROQH1 gene and in ROQH1 protein accumulation (Supplemental Figure 5). We proceeded with SALK_039706, subsequently named roqh1–3, which contained a T-DNA insertion in the second exon of ROQH1. To determine the effect of the roqh1–1, roqh1–2, and roqh1–3 mutations on ROQH1 protein abundance, protein accumulation was investigated in the different mutant alleles. Both roqh1–1 and roqh1–2 showed decreased ROQH1 levels, accumulating approximately 50% in roqh1–1 and 25% in roqh1–2 in comparison to wild type (Figure 2b). The insertional mutant, roqh1–3, showed complete disruption of protein accumulation and is therefore a null allele (Figure 2b and Supplemental Figure 5c).
Figure 2. Schematic representation of ROQH1 protein and accumulation in roqh1 mutants.
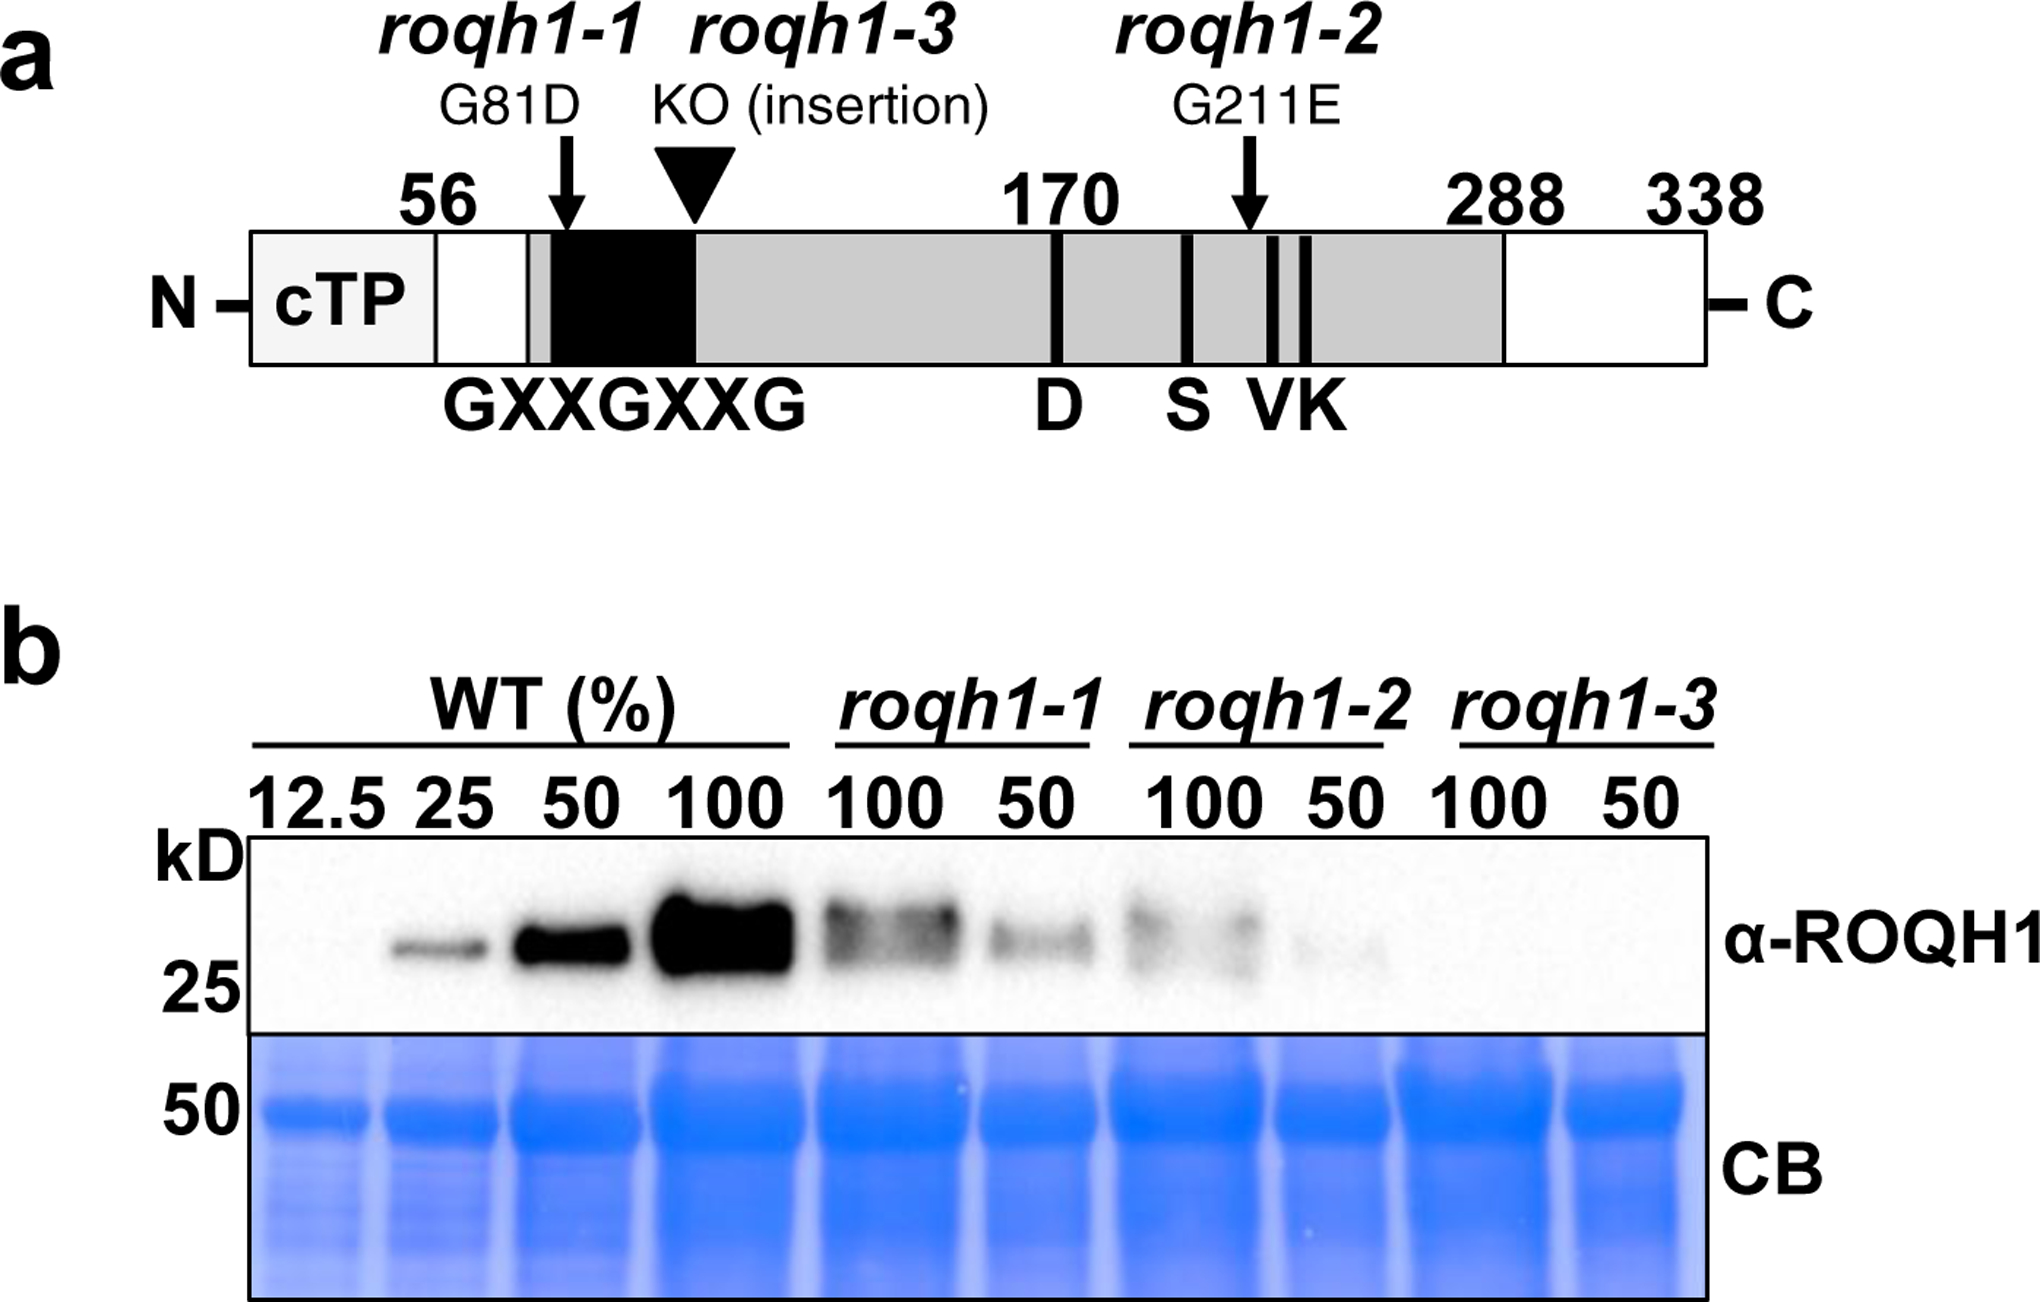
(a) Schematic representation of ROQH1 protein with positions of mutations. Predicted chloroplast transit peptide (cTP; light grey) suggesting a mature size of 29 kD, Rossmann-fold (grey), NAD(P)-binding motif (GXXGXXG; black), and partial catalytic tetrad of residues (D-SVXXXK; black lines). Numbers indicate amino acid positions and arrows indicate mutations. ROQH1–G81D (roqh1–1) and ROQH1–G211E (roqh1–2) from suppressor mutants #164 and #108, respectively; KO, knock-out mutant allele from T-DNA insertion (roqh1–3). (b) Total leaf extract from plants grown under 150 μmol photons m-2 s-1, 21°C. Samples were loaded by equal total chlorophyll content (2.5 μg). Proteins were separated by SDS-PAGE and analyzed by immunodetection with antibodies against ROQH1, Rubisco, Lhca1, Lhcb2, D2, or PsaD. Coomassie blue (CB) or Ponceau are shown as loading controls. Molecular masses (kD) are indicated according to the migration of Precision Plus Protein Standards markers from Bio-Rad. The appearance of two bands in roqh1–1 (100) and roqh1–2 (100) are most likely due to protein shadowing by the LHC proteins, as only one band is present in the diluted (50) sample. Immunoblot is representative of 3 biologically independent experiments.
ROQH1 is enriched in the chloroplast stroma lamellae
A previous proteomics study of chloroplast membranes identified ROQH1 in the stroma lamellae within the chloroplast21. Subcellular localization of ROQH1 was confirmed by isolating and fractionating wild-type chloroplasts into thylakoid sub-compartments, including grana core, margins, stroma lamellae, and the soluble stroma fraction. Immunoblot analysis identified the majority of ROQH1 in the stroma lamellae fraction (Extended Figure 1), consistent with the previous report21. According to protein topology prediction tools, Aramemnon and Protter22,23, ROQH1 is predicted to contain either one or no transmembrane domains. To discern whether ROQH1 is an intrinsic or peripherally bound protein, we tested the strength of ROQH1 association to the stroma lamellae by subjecting isolated thylakoids to various salt treatments. After treatments with NaCl, Na2CO3, and CaCl2, ROQH1 was present in both the pellet and the supernatant fractions, indicating that a portion of ROQH1 is loosely associated to the stroma lamellae while a portion remains strongly bound (Supplemental Figure 6).
Constitutive quenching is due to the combination of soq1 and roqh1 mutations
As ROQH1 had not been previously characterized, we investigated the phenotype of the roqh1 single mutants. By crossing #164 and #108 to the wild type, the roqh1–1 and roqh1–2 mutations were isolated from the soq1 and npq4 mutations. When grown under standard growth conditions, all single roqh1 mutants displayed wild-type chlorophyll fluorescence levels, and roqh1–1 and roqh1–2 were indistinguishable from the wild type (Figure 3). The null allele, roqh1–3, had a developmental phenotype and overproduced leaves with short petioles (Figure 3). However, complementation of roqh1–3 with ROQH1 showed that this phenotype was independent of the roqh1 mutation, as complemented lines retained the developmental phenotype (Supplemental Figure 7). It is likely that the roqh1–3 growth phenotype is due to a mutation in a nearby gene and linked to the T-DNA insertion (approximately 2000 seedlings were screened from the cross soq1 × roqh1–3, and no roqh1–3 mutant could be found without the short petiole phenotype). HPLC analysis of leaves showed that the pigment composition of all single mutants did not differ from the wild type (Figure 4a, Supplemental Figure 8).
Figure 3. Constitutive quenching is due to the combination of soq1 and roqh1 mutations.
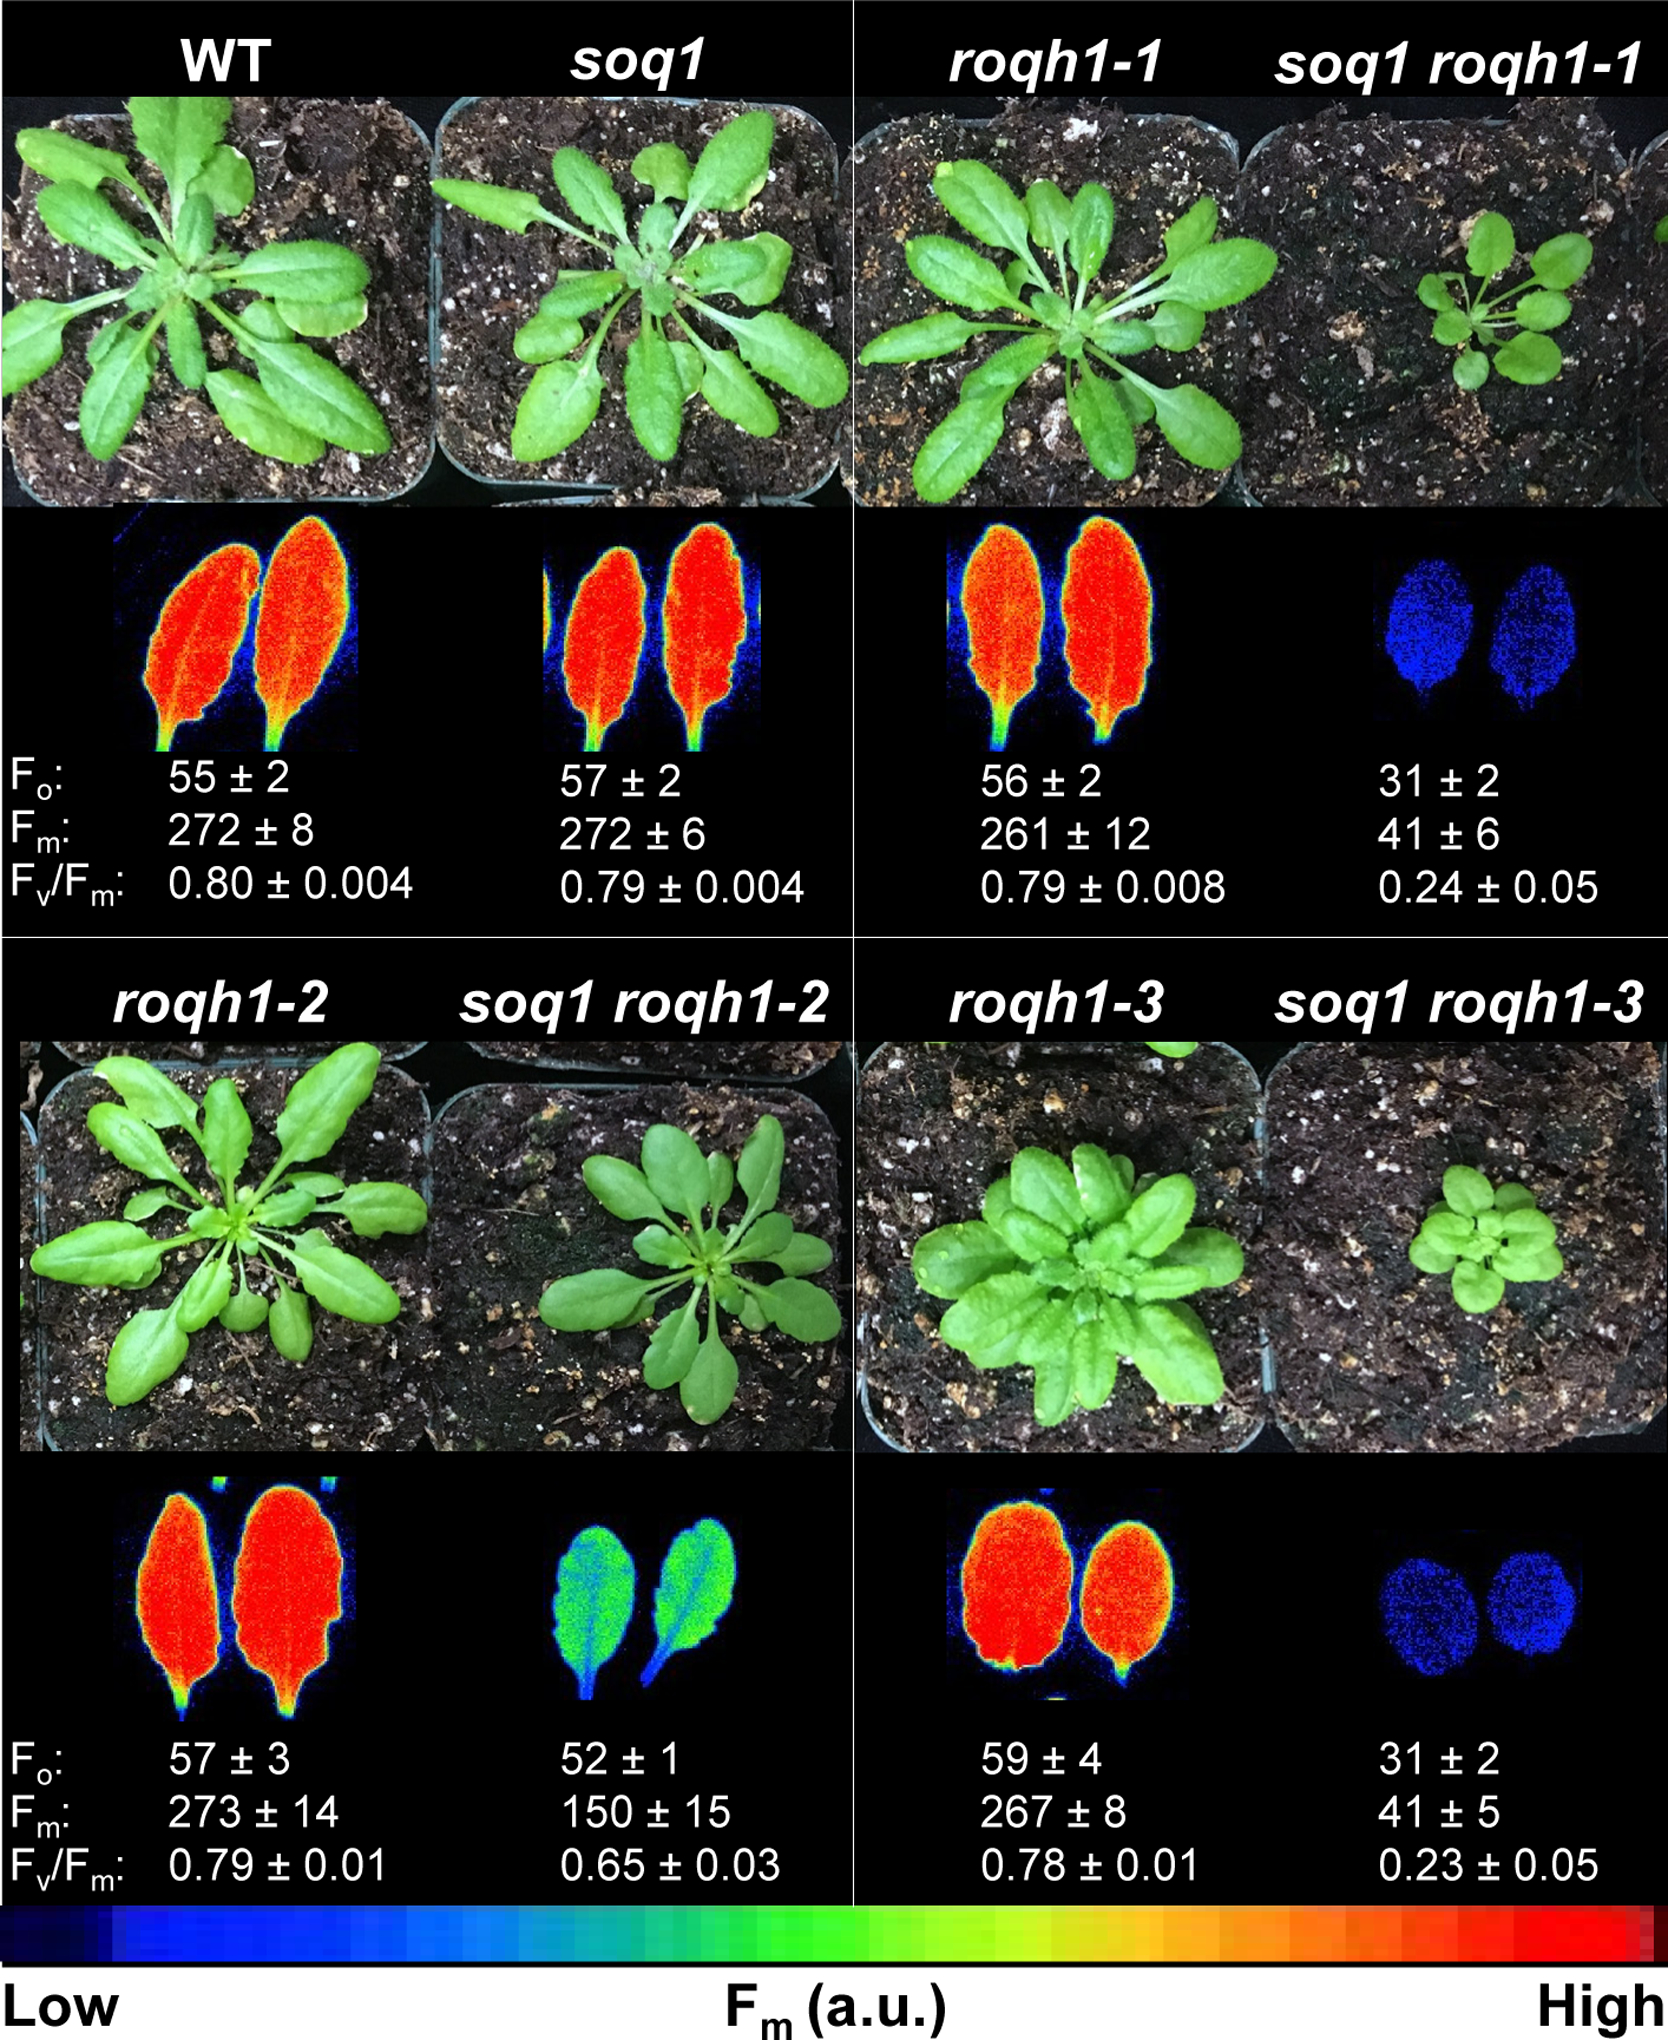
Images of plants and false-colored images of maximum fluorescence (Fm) of detached leaves from 5-week-old plants grown under 150 μmol photons m−2 s−1, 21°C. Average Fo, Fm, and Fv/Fm values ± SD are given with n = 5 individuals for each genotype.
Figure 4. Constitutively quenched mutants are light-limited.
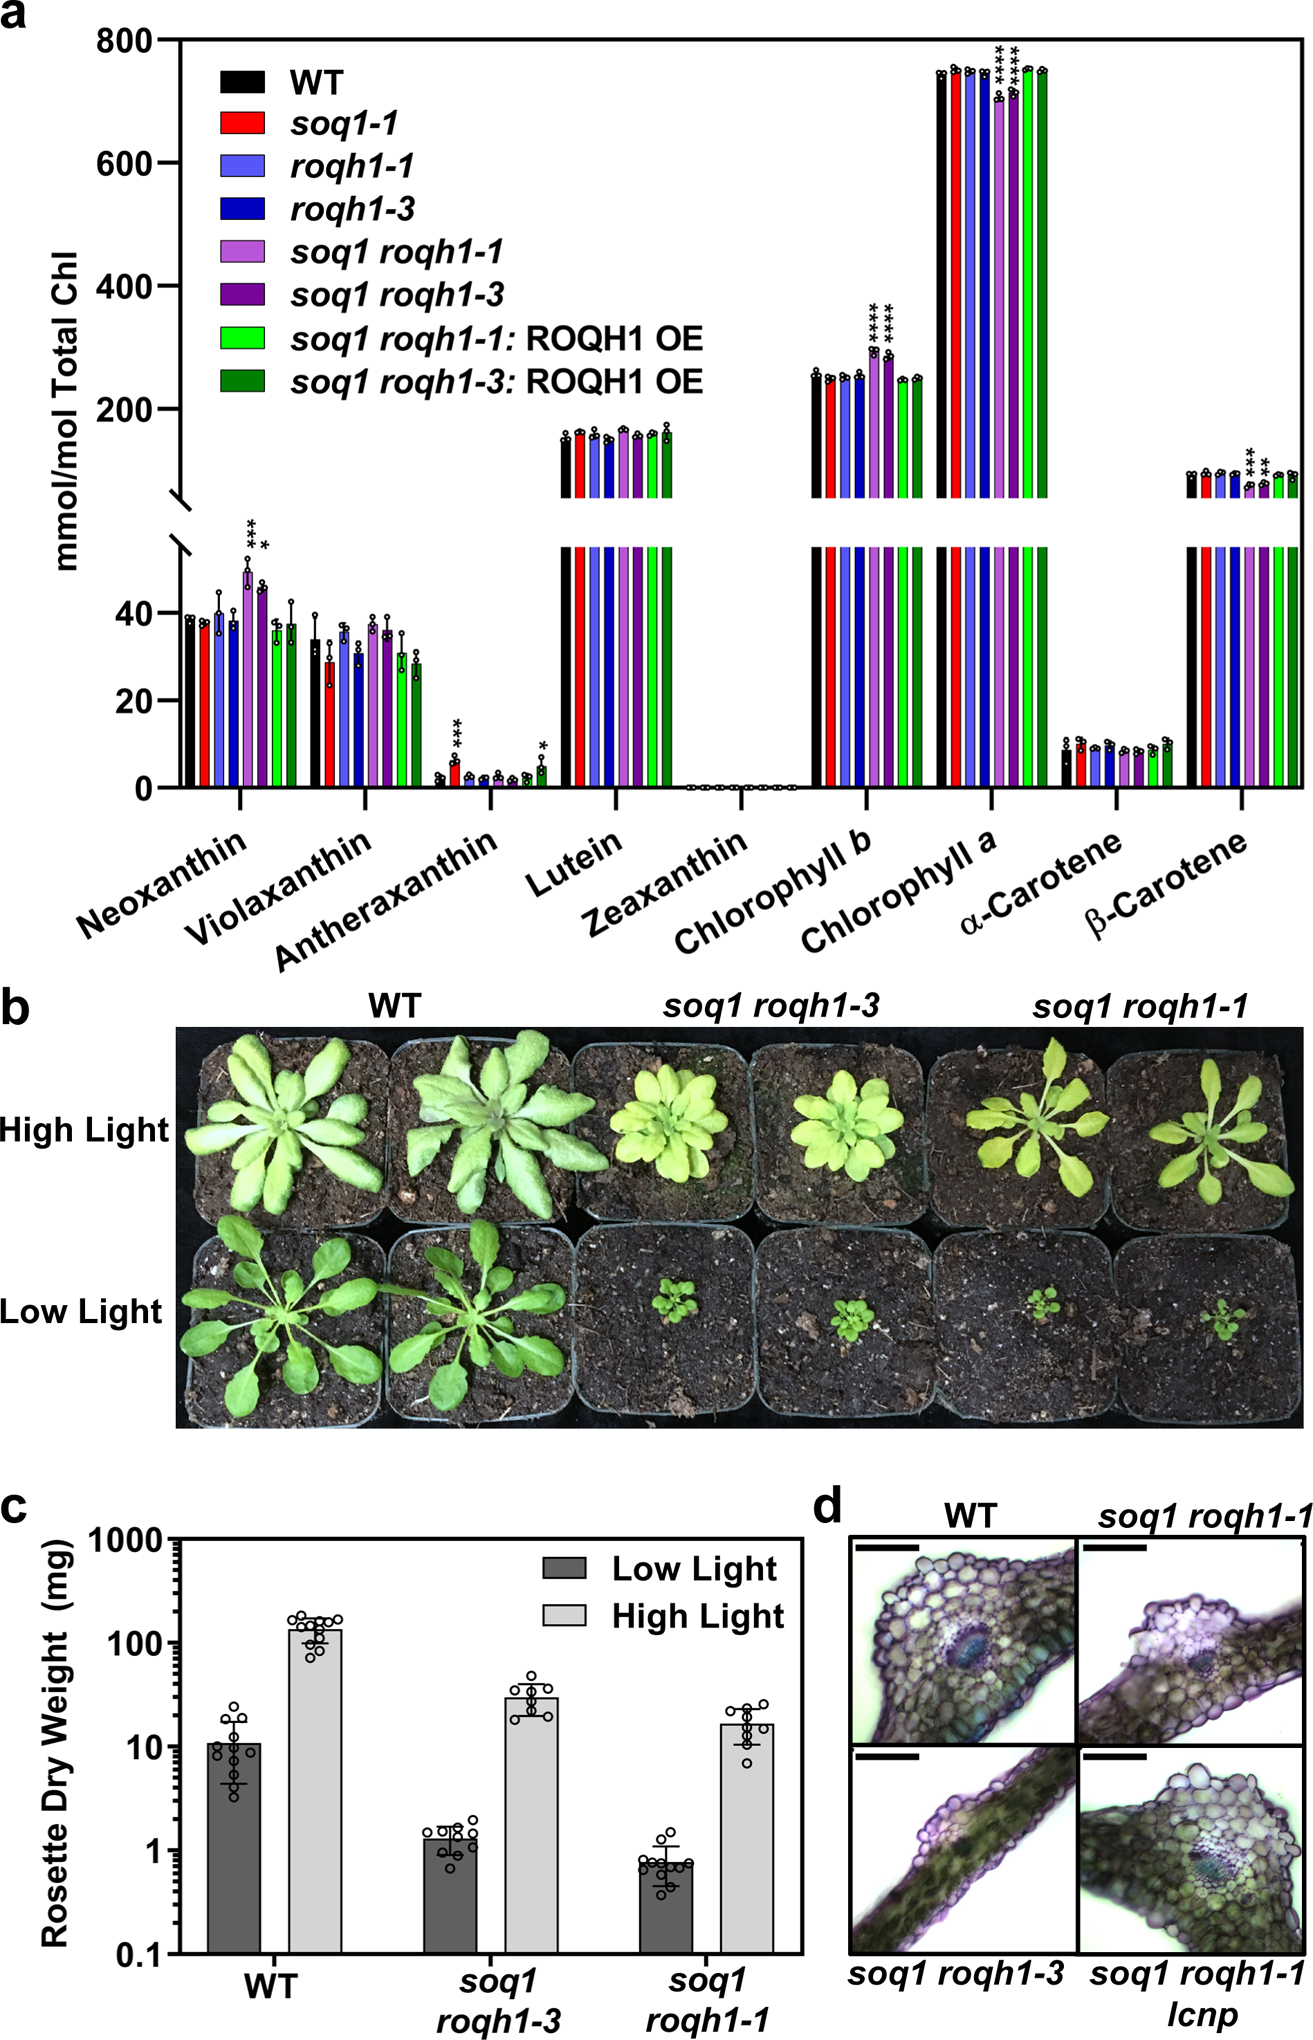
(a) Pigment composition determined by HPLC analysis of 6-week-old plants, grown under standard light conditions (120 μmol photons m-2 s-1, 21°C). Under standard light conditions, zeaxanthin accumulation is below detection limit of 0.15pmol. Tukey’s multiple comparison test shows a significant increase in neoxanthin and chlorophyll b and a significant decrease in chlorophyll a and β-carotene in soq1 roqh1–1 and soq1 roqh1–3 compared to wild type. **** = p-value 0.0001, *** = p-value 0.0007, ** = p-value 0.006, * = p-value 0.0321. Average values ± SD are given with n = 3 individuals per genotype. (b) Image of 5-week-old plants grown under low (100 μmol photons m-2 s-1) or high (1,300 μmol photons m-2 s-1) light. Image is representative of 3 biologically independent experiments. (c) Rosette dry weight harvested from plants indicated in (b). Average values ± SD are given with n = 8 individuals. Note the log scale Y-axis. (d) Microscopy images of leaf cross-sections at the mid-vein. Plants are 6–7 weeks old grown under 150 μmol photons m-2 s-1, 21°C. Scale bar represents 100 μm. Images are representative cross-sections from 2 biologically independent experiments.
In addition to the soq1 and roqh1 mutations, #164 and #108 also lacked PsbS due to the npq4 mutation. To determine which mutations were necessary for constitutive quenching, we outcrossed #164 and #108 to the wild type. Of the segregating F2 populations, 4% and 6% of seedlings displayed low Fm, indicating that two mutations were necessary for the phenotype. To determine if the npq4 mutation was required, we separated soq1 roqh1–1 and soq1 roqh1–2 from npq4. The Fo and Fm values of soq1 roqh1–1 and soq1 roqh1–2 remained as low as the original soq1 npq4 roqh1–1 and soq1 npq4 roqh1–2 mutants (Figure 3 and Supplemental Figure 1b, c). For independent confirmation, we crossed soq1 with the null allele, roqh1–3. Of the segregating F2 population, 5.3% of seedlings displayed low Fm, consistent with two mutations being required. The homozygous double mutant, soq1 roqh1–3 displayed decreased Fo and Fm values similar to soq1 roqh1–1, further confirming that this phenotype required both soq1 and roqh1 mutations and was independent of npq4 (Figure 3). In addition, the soq1/soq1 ROQH1/roqh1–3 heterozygote displayed normal fluorescence and NPQ (Supplemental Figure 3b), indicating that roqh1–3 was also a recessive mutation.
Constitutively quenched mutants grow slowly and contain an altered pigment composition
Compared to the single soq1 and roqh1 mutants, soq1 roqh1–1 and soq1 roqh1–3 showed severely decreased Fo, Fm, and photoautotrophic growth (Figure 3). Leaf thickness was also decreased by 70 μm compared to wild type (Figure 4d and Supplemental Figure 9). As a result, the leaves of the double mutants had lower fresh weight per area than wild type (Supplemental Figure 8a). Accordingly, pigment analysis was normalized to fresh weight rather than leaf area, and soq1 roqh1–1 and soq1 roqh1–3 showed equal total chlorophyll per mg of fresh weight compared to wild type (Supplemental Figure 8b). However, the pigment composition relative to total chlorophyll was altered, and both mutants contained significantly higher amounts of chlorophyll b and neoxanthin, and lower amounts of chlorophyll a and β-carotene (Figure 4a and Supplemental Table 3). The growth and carotenoid composition of the milder allele, soq1 roqh1–2, was unaltered, yet the chlorophyll a/b ratio was mildly decreased (Figure 3, Supplemental Figure 8, and Supplemental Table 4).
The constitutive quenching phenotype led us to question whether growth in the double mutants was limited by light. Under increased light intensity, growth of soq1 roqh1–1 and soq1 roqh1–3 improved as shown by an increase in dry rosette weight compared to standard light conditions (Figure 4b, c). For further confirmation of light limitation, the thylakoid ultrastructure of soq1 roqh1–1 was determined using transmission electron microscopy. The thylakoid membranes of soq1 roqh1–1 appeared to be more stacked and in larger grana compared to wild type (Supplemental Figure 9c, d), suggesting a light-limited thylakoid architecture.
The constitutive quenching observed in soq1 roqh1 is qH
qH occurs in the peripheral antenna of PSII, as mutants without chlorophyll b and thus major and minor LHCII in both trimeric and monomeric forms in PSII-LHCII, lack qH17. To determine whether quenching in soq1 roqh1 was constitutive qH, we tested whether the peripheral antenna of PSII was required by crossing soq1 roqh1–1 to chlorina1, a mutant lacking chlorophyll b24. Without chlorophyll b, the light-harvesting antenna proteins fail to organize into functional LHCII trimers or monomers25. Constitutive quenching was abolished in the triple mutant soq1 roqh1–1 chlorina1 indicated by the similar Fo and Fm values compared with soq1 chlorina1 (Figure 5a). This result suggests that the site of quenching in soq1 roqh1–1 is the peripheral antenna of PSII, consistent with the site of qH quenching.
Figure 5. Constitutive quenching requires the peripheral antenna of PSII and LCNP.
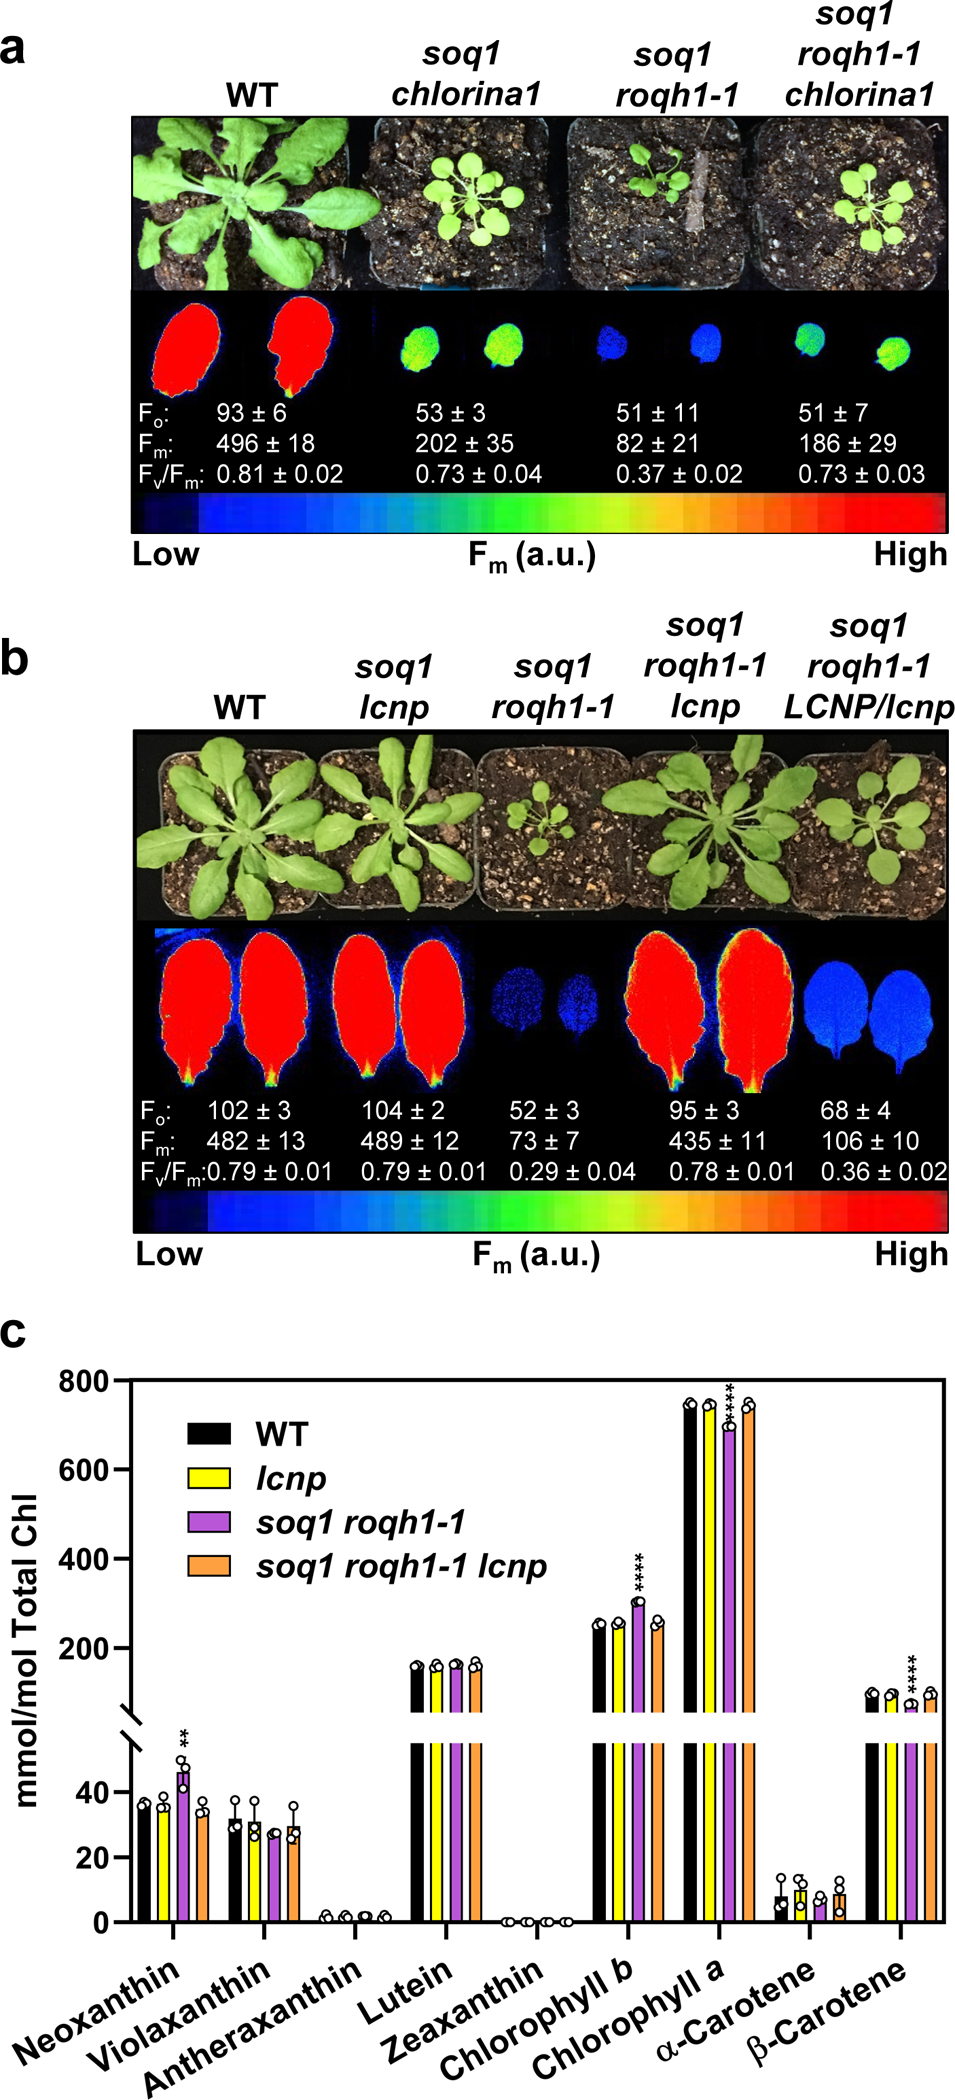
(a) and (b) Images of plants and false-colored images of maximum fluorescence (Fm) of detached leaves from 6-week-old plants grown under standard growth conditions (120 μmol photons m-2 s-1, 21°C). Average Fo, Fm, and Fv/Fm values ± SD are given with n = 3 individuals for each genotype. (c) Pigment composition determined by HPLC analysis of 6-week-old plants grown under standard growth conditions (120 μmol photons m-2 s-1, 21°C). Under standard light conditions, zeaxanthin accumulation is below detection limit of 0.15pmol. Tukey’s multiple comparison test shows a significant increase in neoxanthin and chlorophyll b and a significant decrease in chlorophyll a and β-carotene in soq1 roqh1–1 but not in soq1 roqh1–1 lcnp. **** = p-value 0.0001, ** = p-value 0.0036. Average values ± SD are given with n = 3 individuals per genotype.
Because the plastid lipocalin (LCNP) is required for qH, we tested whether LCNP was required for the constitutive quenching observed in soq1 roqh1–1. To this aim, the LCNP knockout mutant (lcnp) was combined with soq1 roqh1–1. Indeed, the fluorescence values, Fo and Fm, of the triple mutant soq1 roqh1–1 lcnp returned to wild-type levels (Figure 5b). In addition, soq1 roqh1–1 lcnp recovered wild type growth, pigment composition, and leaf thickness, confirming that these phenotypes were a consequence of quenching and not the soq1 and roqh1 mutations themselves (Figure 5b, c and Supplemental Figure 9). Furthermore, the soq1 roqh1–1 LCNP/lcnp heterozygote recovered an intermediate Fm phenotype (Figure 5b and Supplemental Figure 10). This is consistent with the previously reported observation that qH is dependent on LCNP dosage17. Altogether, these results demonstrate that the constitutive quenching observed in soq1 roqh1–1 is qH.
Overexpression of ROQH1 prevents qH from occurring
While roqh1 has no discernible NPQ phenotype compared to wild type under standard growth conditions (Supplemental Figure 11), the constitutive quenching in soq1 roqh1 implies that ROQH1 is required to prevent or relax quenching. However, qH can be induced by a 10-min high light treatment in the soq1 mutant grown under standard conditions (Supplemental Figure 11), which indicates either that qH can occur in the presence of ROQH1 and/or that the ROQH1 protein level is insufficient to prevent or relax quenching in this condition. The NPQ phenotype of soq1 led us to question whether the function of ROQH1 is dosage-dependent. To test the dosage effect of ROQH1, we overexpressed (OE) ROQH1-FLAG in the soq1 roqh1–1 mutant background and obtained lines with increased expression by a factor of >10 times that of wild type (Figure 6a and Supplemental Figures 7, 12). Overexpression of ROQH1 returned growth of soq1 roqh1–1 to wild-type levels (Figure 6b). Surprisingly, overexpression restored NPQ to wild-type levels and not to soq1 levels (Figure 6c), suggesting that ROQH1 overexpression prevents qH from occurring. To ensure that the NPQ phenotype was not due to any interaction between wild-type ROQH1 and the residual ROQH1-Gly81Asp protein that accumulated in soq1 roqh1–1, we overexpressed ROQH1-FLAG in the soq1 roqh1–3 mutant background (Supplemental Figure 7). The NPQ phenotype of soq1 roqh1–3: ROQH1 OE also reached wild-type levels (Supplemental Figure 7), confirming that overexpression of ROQH1 prevents qH from occurring.
Figure 6. Overexpression of ROQH1 prevents qH from occurring.
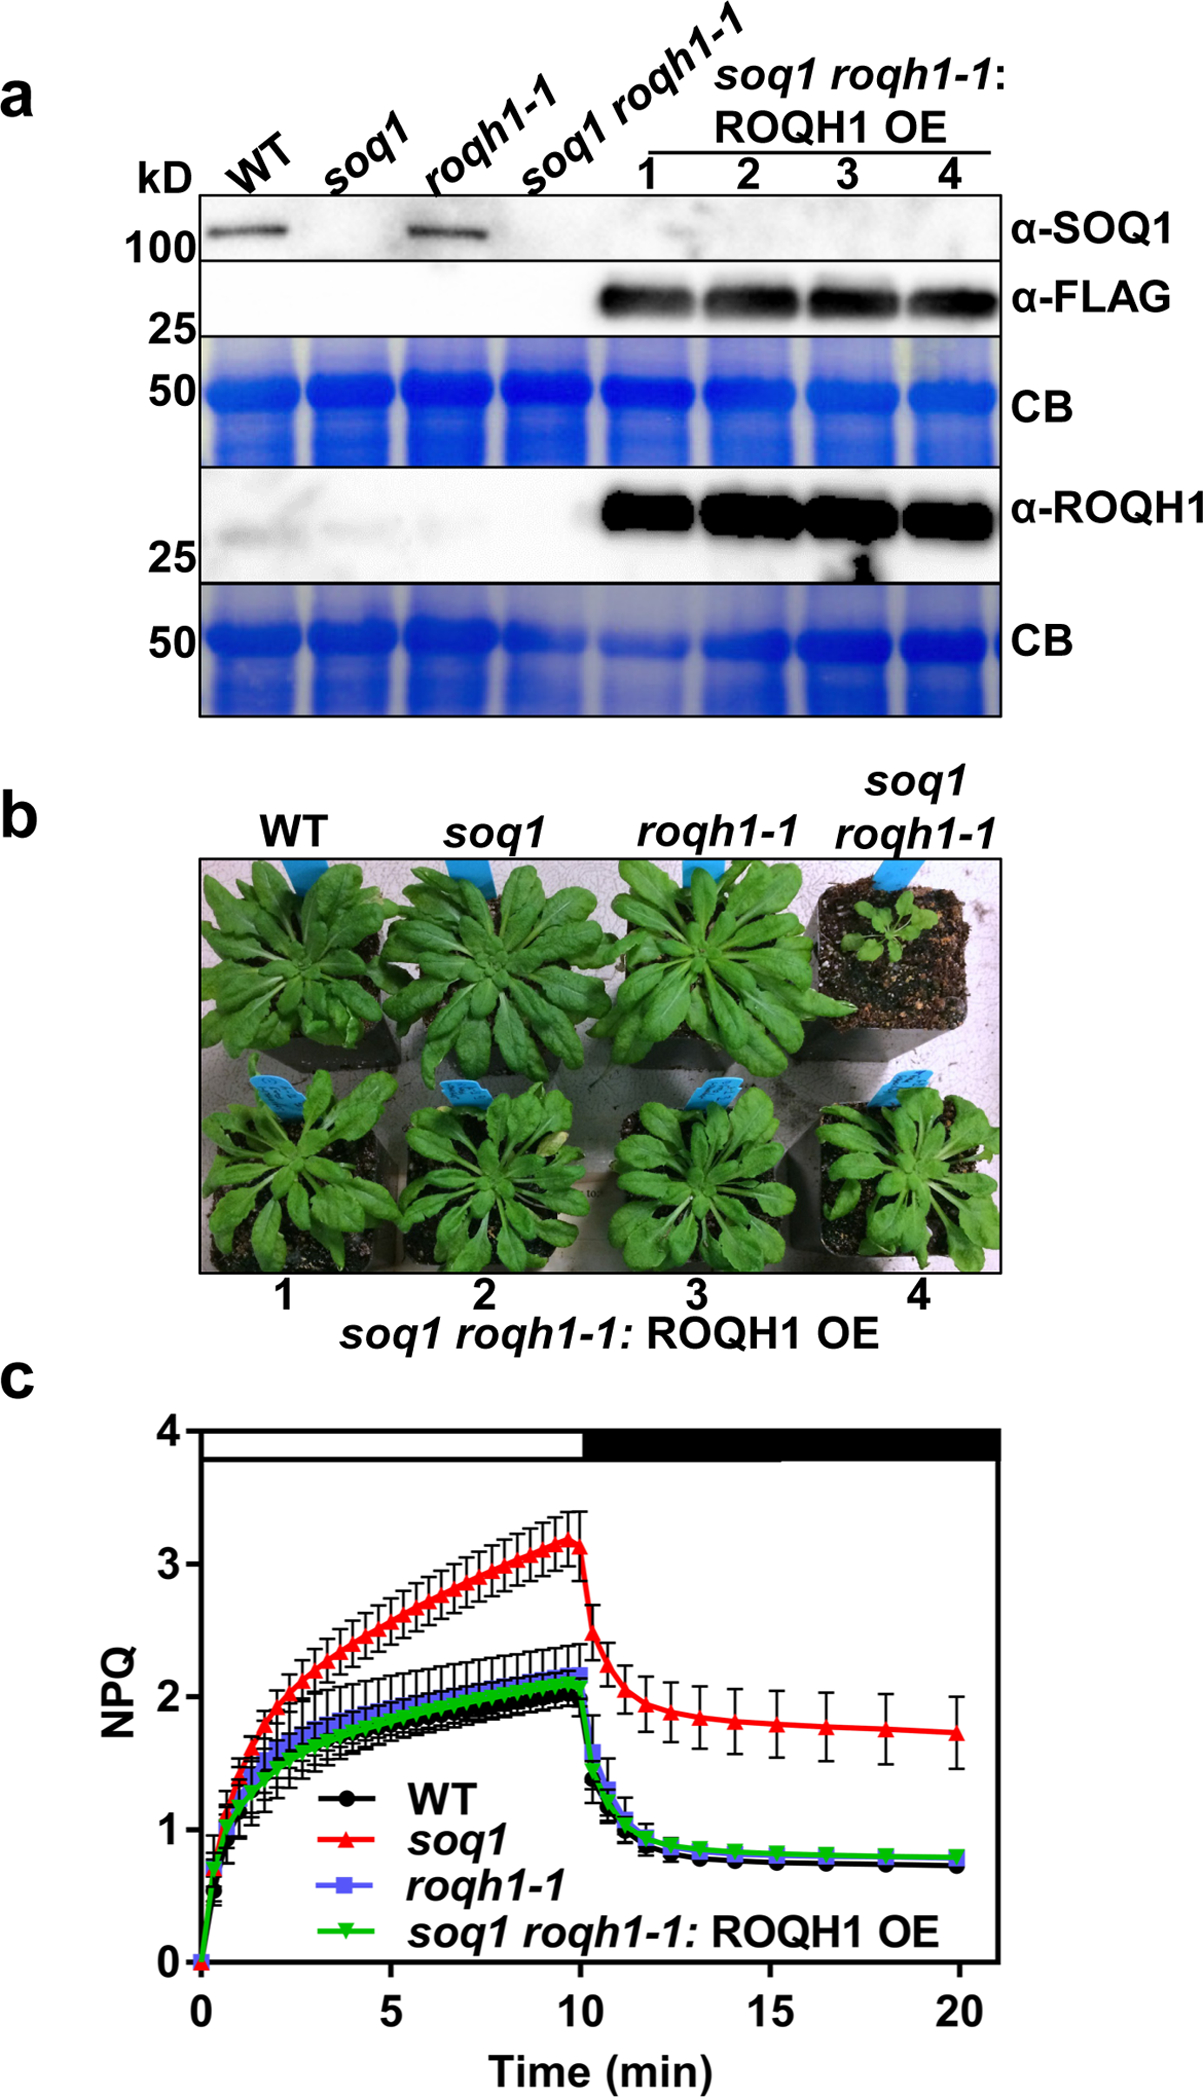
Plants 1–4 of soq1 roqh1–1: ROQH1 OE corresponds to individuals from T2-T1-4. Additional independent lines can be found in Supplemental Figure 7. (a) Isolated whole cells from 6.5-week-old plants grown under 120 μmol photons m-2 s-1. Samples were loaded by same leaf area, separated by SDS-PAGE, and analyzed by immunodetection with antibodies against ROQH1, SOQ1 and FLAG. Coomassie blue (CB) is shown as loading control. Molecular masses (kD) are indicated according to the migration of Precision Plus Protein Standards markers from Bio-Rad. Wild type ROQH1 signal is weak to prevent overexposure of soq1 roqh1–1: ROQH1 OE. Immunoblot is representative of 3 biologically independent experiments and consistent with additional independent lines and quantification immunoblots found in Supplementary Figures 7 and 12. (b) Images of 7-week-old plants grown under 120 μmol photons m-2 s-1. This OE line was used for all further experiments and phenotype was consistent throughout all experiments. (c) NPQ kinetics of WT, soq1, roqh1–1 and soq1 roqh1–1: ROQH1 OE. Induction at 1,200 μmol photons m-2 s-1 (white bar) and relaxation in the dark (black bar). Data shown represents means ± SD, n = 3 individuals.
ROQH1 is required for relaxation of qH
Induction of qH in wild type has been observed under cold and high light conditions17. Although roqh1 displayed wild-type NPQ kinetics under standard growth conditions (Figure 6 and Supplemental Figure 11), we hypothesized that roqh1 may be affected in qH induction and/or relaxation under stress conditions. To test qH kinetics in roqh1, NPQ induction was monitored as a quenching of Fm during a cold and high light treatment of 6°C and 1,600 μmol photons m−2 s−1 (Figure 7a and Supplemental Figure 13). After 5 h of cold and high light, soq1, roqh1–1, and roqh1–3 displayed elevated NPQ levels of 11, 6, and 8, respectively, while soq1 roqh1–1: ROQH1 OE and soq1 roqh1–1 lcnp displayed decreased NPQ levels of 3.5 and 3, respectively, compared to wild type (Figure 7b). The additional NPQ observed in the soq1 and roqh1 mutants was attributed to qH rather than qZ or qI as zeaxanthin accumulation was comparable to wild type throughout the time course (Figure 7c) and absence of ROQH1 did not lead to increased PSII photosensitivity or impaired repair (Supplemental Figure 14a, b) based on Fv/Fm values similar to wild type throughout a classical photoinhibition experiment. Despite the low Fv/Fm values in soq1 roqh1 (Supplemental Figure 14c,d), the D1 protein levels of soq1 roqh1 were higher than wild-type at all timepoints (Supplemental Figure 14e) confirming that constitutive qH is not due to lack of D1 or impaired PSII repair processes. After quenching was induced by cold and high light, NPQ relaxation was monitored throughout recovery under standard growth conditions. After 28 h of recovery, NPQ in soq1 had relaxed to nearly wild-type levels, while the roqh1 mutants remained quenched, as indicated by their lower Fm and higher NPQ values (Figure 7a, b). Notably, zeaxanthin levels were similarly close to zero in all lines after recovery (Figure 7c). The impaired qH relaxation in the roqh1 mutants indicated that ROQH1 is required for relaxing qH.
Figure 7. ROQH1 is required for relaxation of qH.
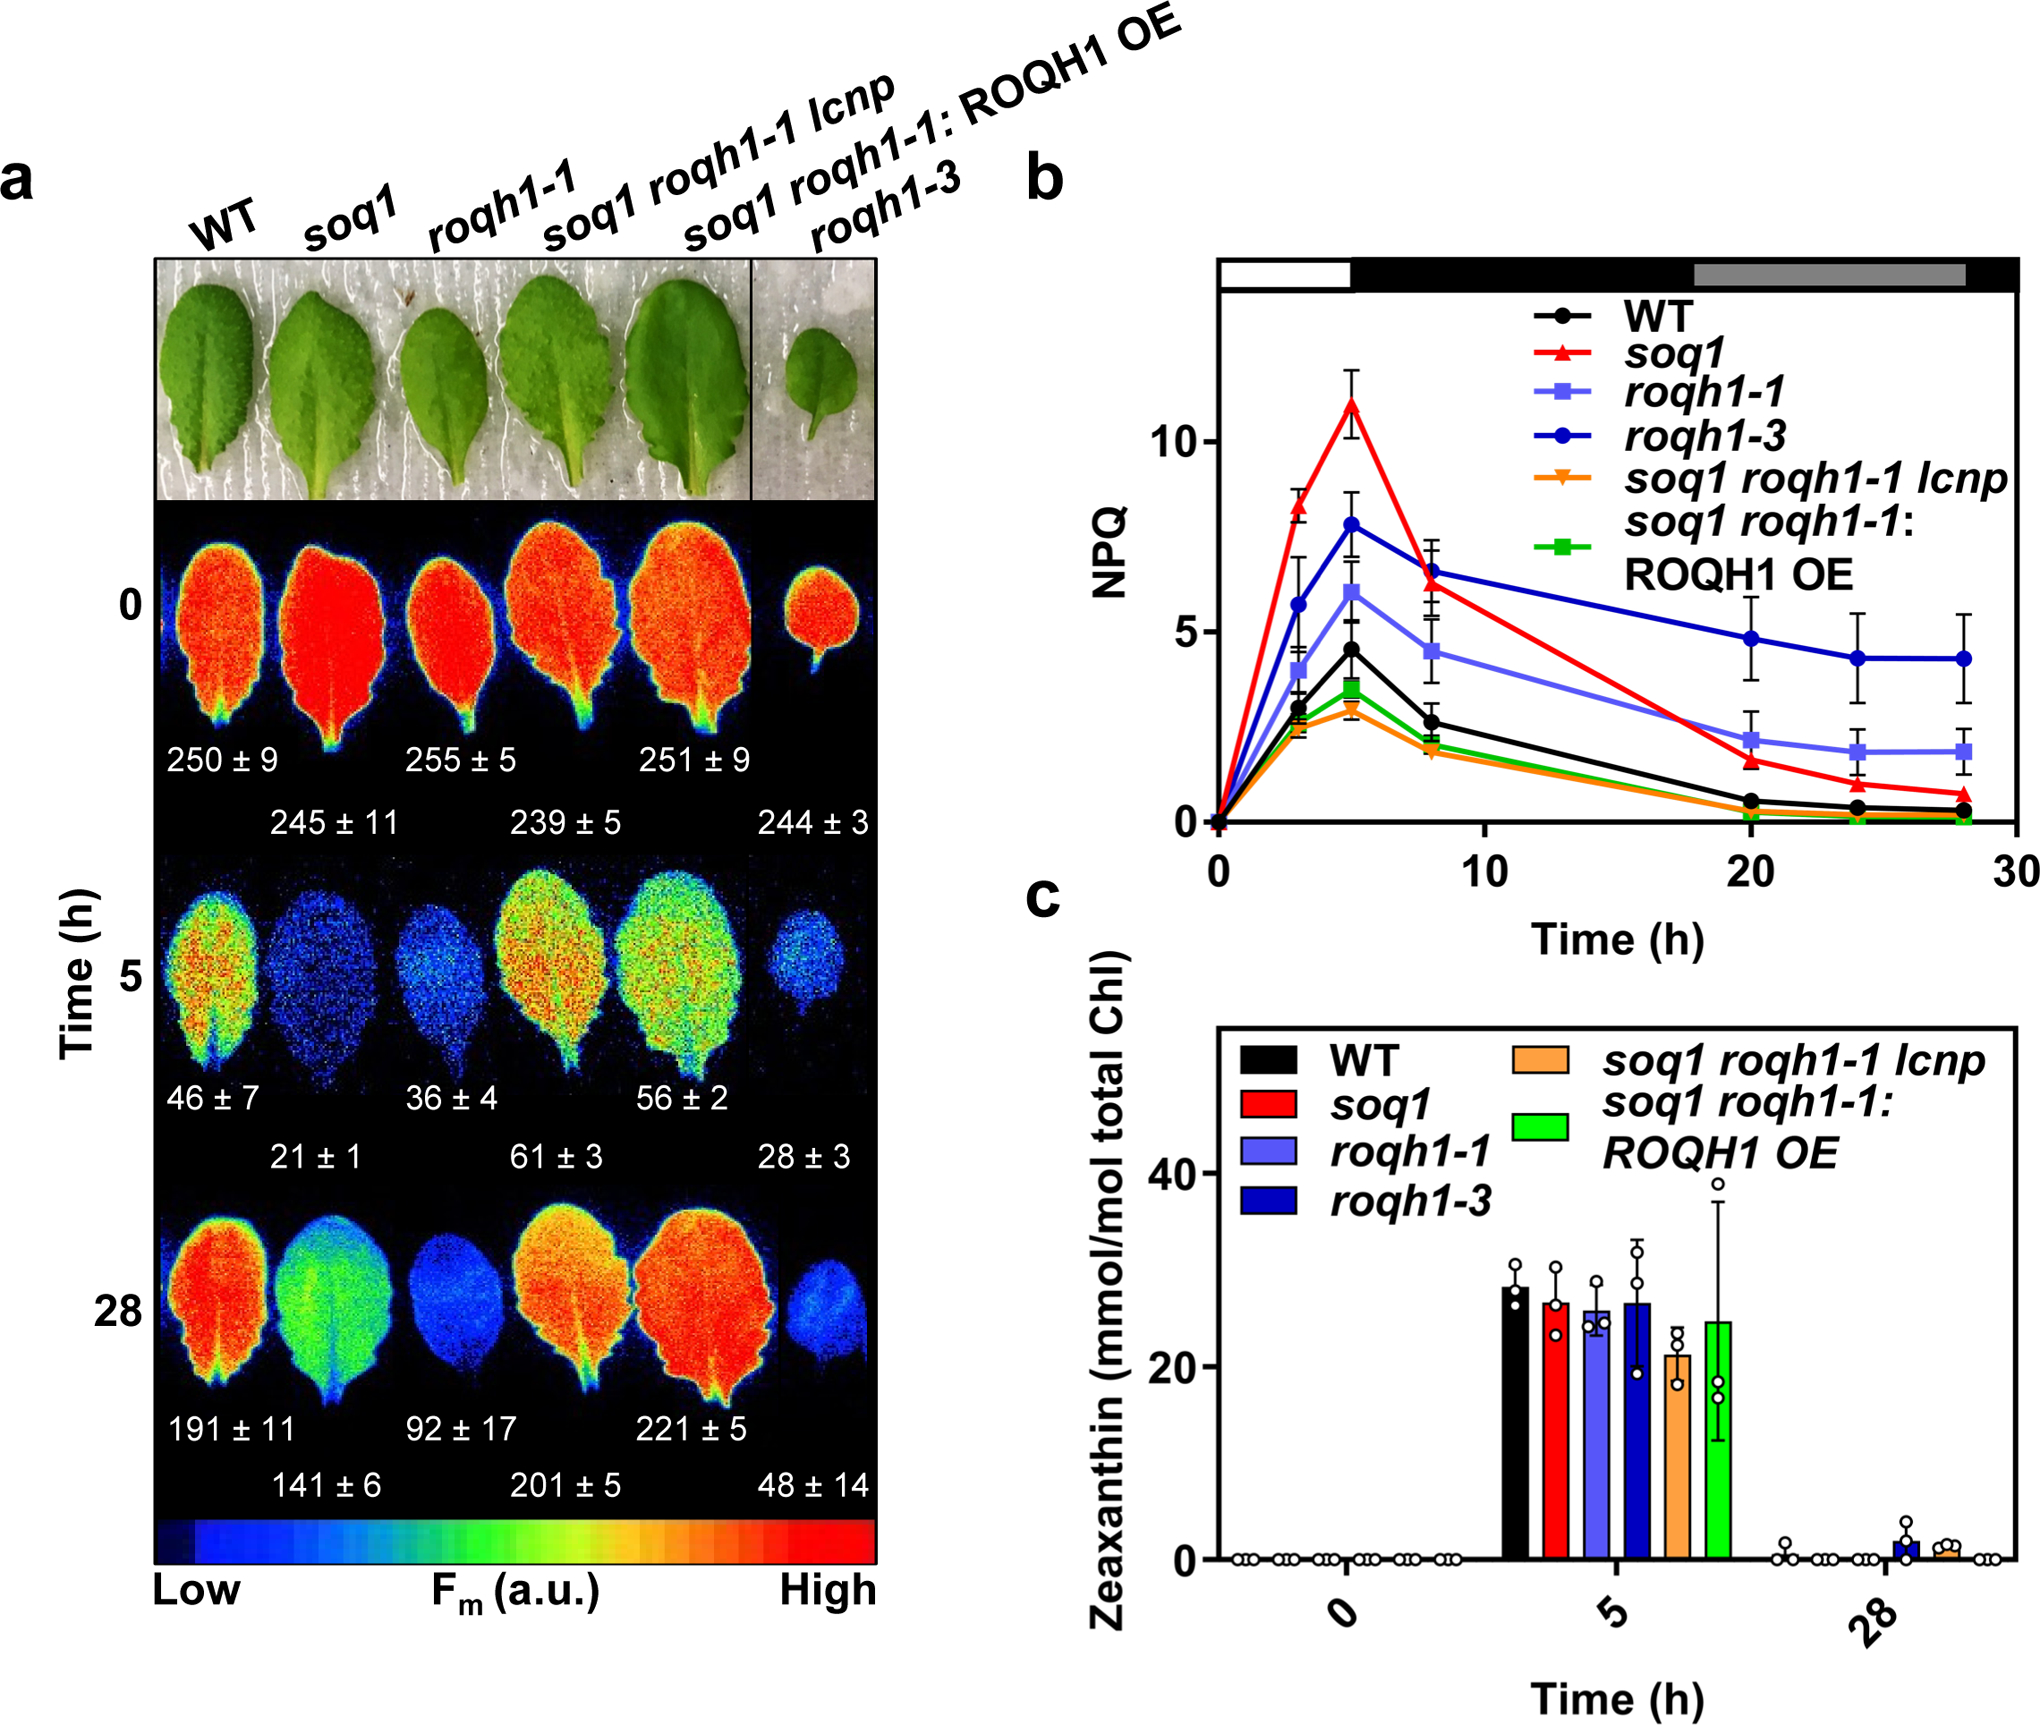
Detached leaves from 5-week-old plants grown under standard light conditions (150 μmol photons m-2 s-1, 21°C) were subjected to a cold and high light treatment (white bar) of 6°C and 1,600 μmol photons m-2 s-1 for 5 hours, and a recovery treatment of 150 μmol photons m-2 s-1 and a 10 h/14 h day/night cycle at 21°C (black, night period and grey, day period bars) for 28 hours. (Aa Images of detached leaves and false-colored images of maximum fluorescence (Fm) of detached leaves before the cold and high light treatment (Time 0), after the cold and high light treatment (Time 5) and after a recovery period (Time 28). Leaves were dark-adapted for 10 minutes before fluorescence measurement to relax qE. Additional leaves between soq1 roqh1–1: ROQH1 OE and roqh1–3 were cropped out for simplicity, and an uncropped image can be found in Supplemental Figure 13. Average Fm values ± SD are given with n = 4 individuals from two biologically independent experiments. (b) NPQ kinetics calculated as (Fm Time 0 - Fm’)/Fm’ throughout the cold, high light and recovery treatment indicated in (a). Data represent means ± SD, n = 4 individuals. (c) Zeaxanthin levels before the cold and high light treatment (Time 0), after the cold and high light treatment (Time 5) and after a recovery period (Time 28). Tukey’s multiple comparison test shows no significant difference in zeaxanthin levels among wild type and mutants before or after treatments. Data shown represents means ± SD, n = 3 individuals.
ROQH1 functions in a complex after cold and high light
To shed light on the molecular mechanism of qH relaxation by ROQH1, we checked whether ROQH1 interacts with any photosynthetic complex before and after a cold and high light treatment. Blue native PAGE (BN-PAGE) analyses of wild type and soq1 roqh1–1: ROQH1 OE thylakoids solubilized with either 1% n-dodecyl-β-D-maltoside (β-DM) or 1% digitonin and 1% α-DM showed no difference in photosynthetic complex abundance between genotypes (Figure 8a, Supplemental Figure 15a). As expected,26 solubilization with digitonin and α-DM preserved the high molecular weight PSII-LHCII supercomplexes better than solubilization with β-DM (Figure 8a, Supplemental Figure 15a). Both wild type and overexpressor in each detergent condition showed a decrease in PSII-LHCII supercomplexes and an increase in PSII monomers, RC47 assembly complexes, and LHCII monomers after 5 h cold and high light (Figure 8a). Immunoblotting the first dimension with an anti-FLAG antibody revealed that under standard growth conditions, ROQH1 migrates with unassembled proteins (Figure 8a, Supplemental Figure 15a). However, after the cold and high light treatment, ROQH1 protein level increased and a small portion migrated slightly above the PSI, PSII dimer band when solubilized with digitonin and α-DM (Supplemental Figure 15b). When solubilized with β-DM, a small portion migrated near the LHCII trimer and monomer band (Figure 8a).
Figure 8. ROQH1 functions in a complex after cold and high light.
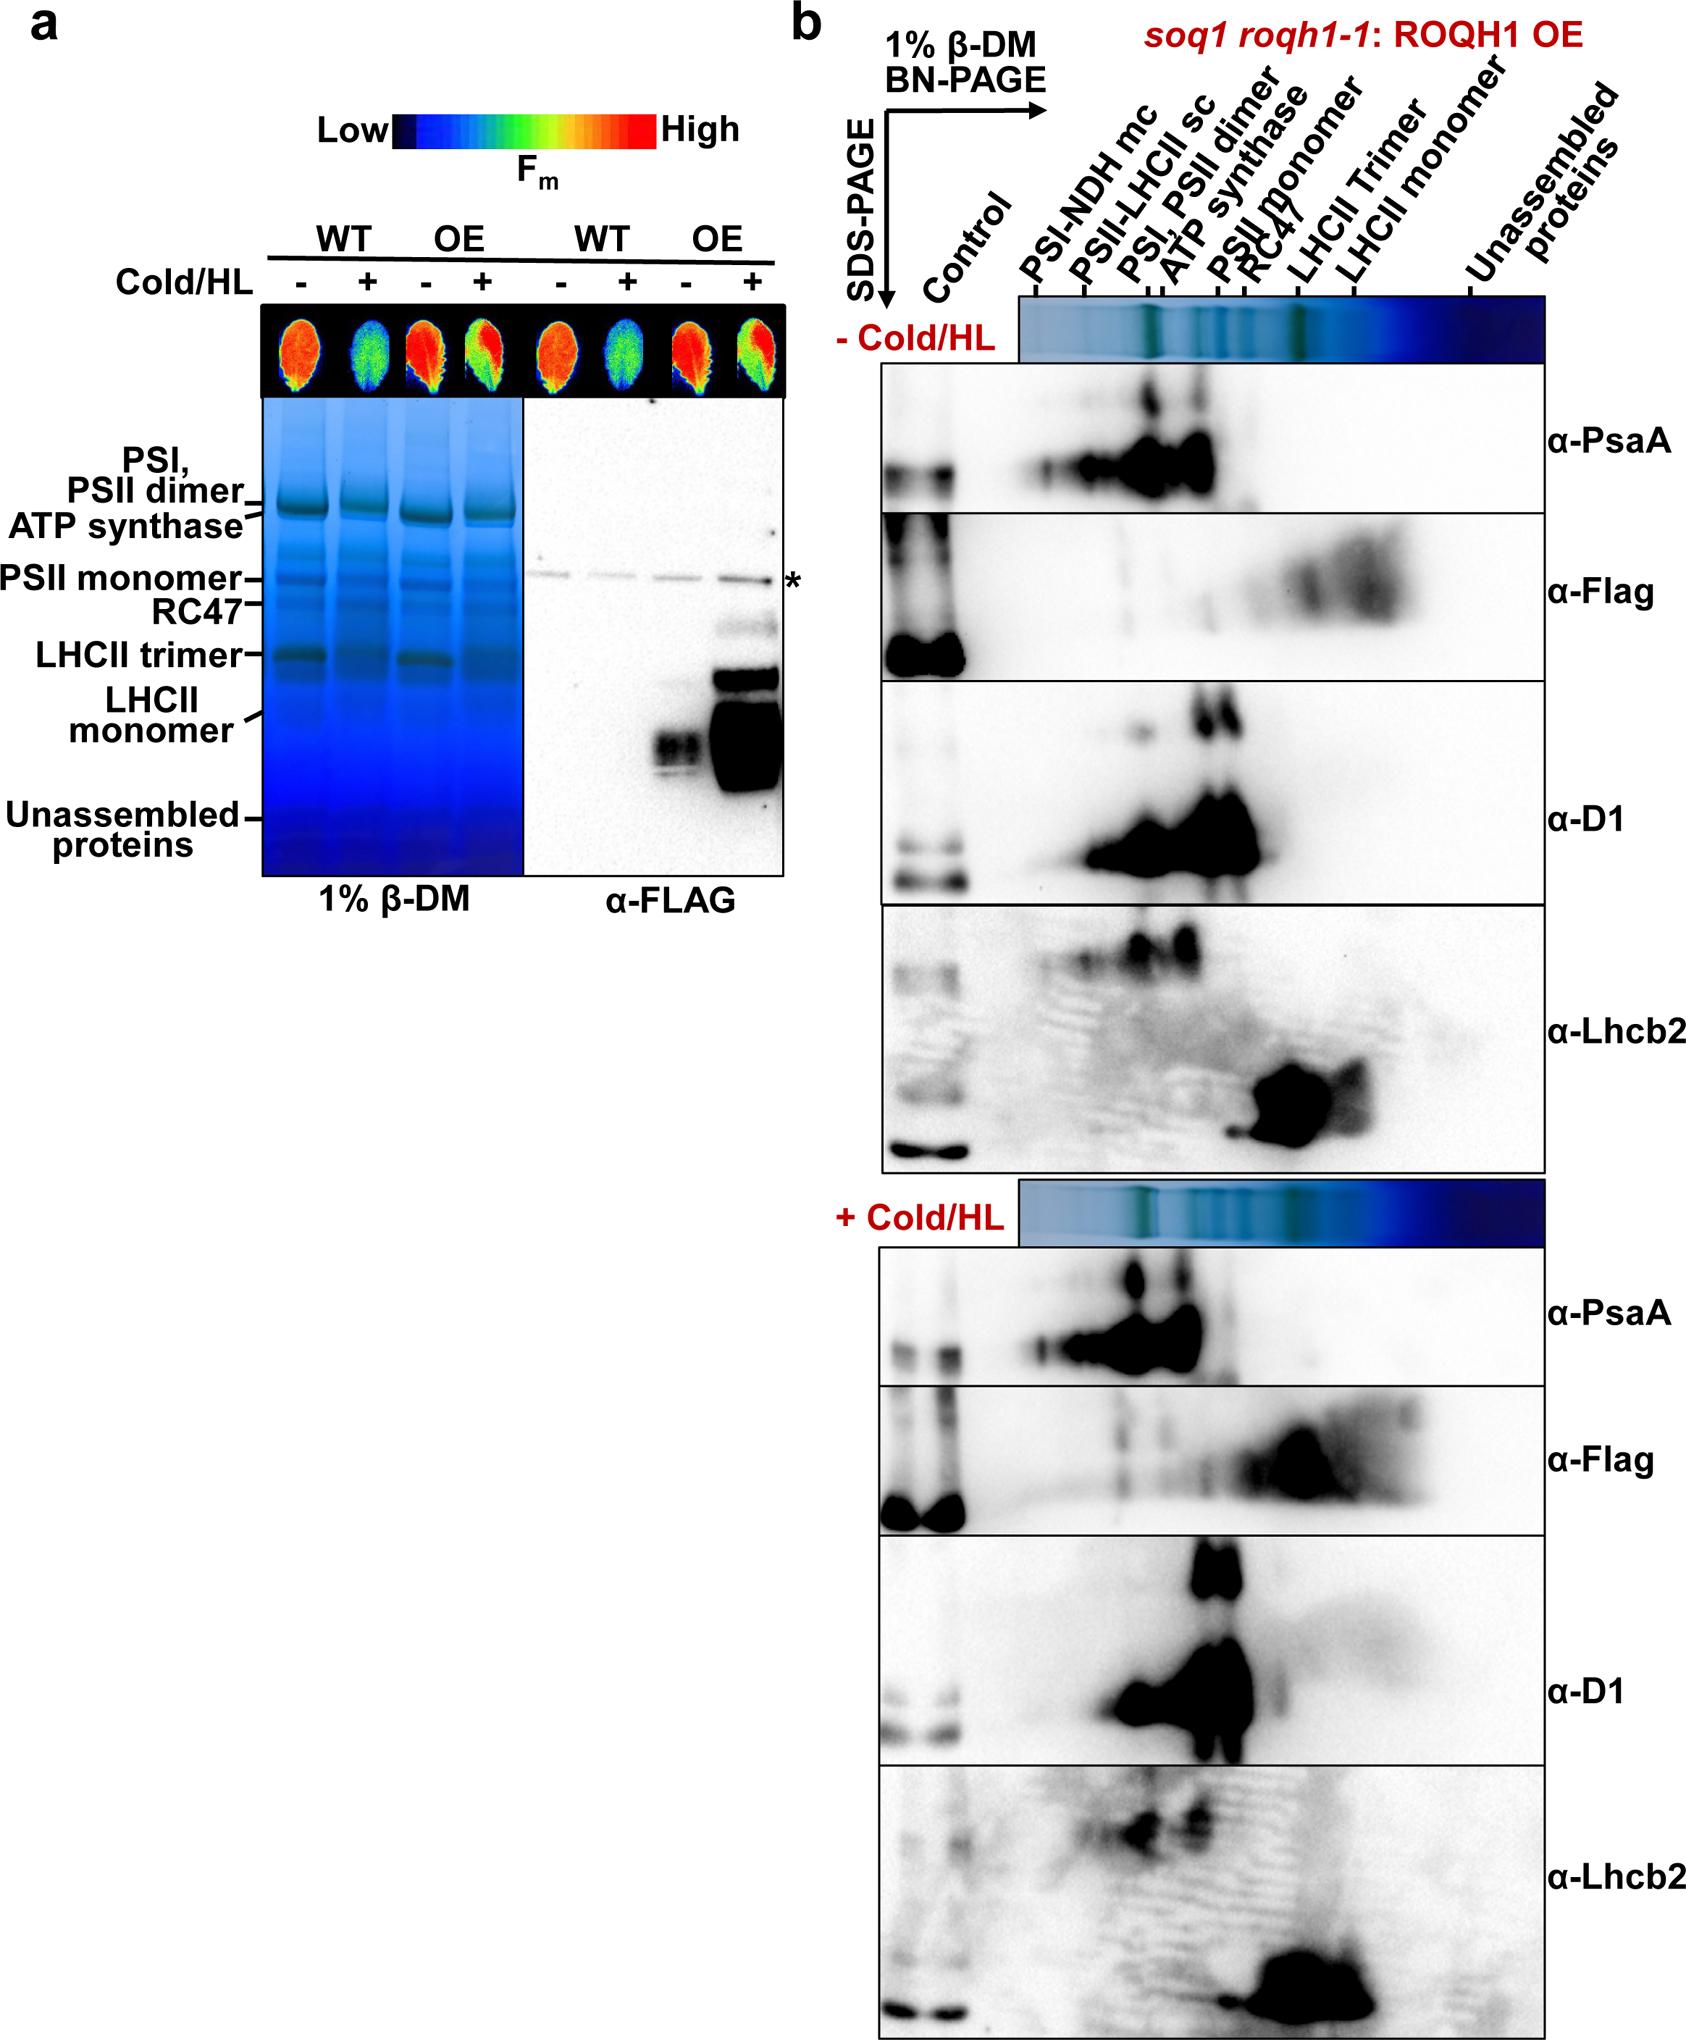
(a) BN-PAGE analysis of thylakoids isolated from 5-week-old wild type and soq1 roqh1–1: ROQH1 OE plants before (−) and after (+) a 5 h cold and high light treatment (6°C and 1,600 μmol photons m-2 s-1), solubilized with 1% β-DM and immunoblotted with a Flag antibody to detect ROQH1-Flag. Asterisk denotes nonspecific band detected by Flag antibody. Thylakoids were loaded based on 8 μg total chlorophyll. Immunoblot is representative of 3 biologically independent experiments. (b) Two-dimensional BN/SDS-PAGE analysis from thylakoids isolated from soq1 roqh1–1: ROQH1 OE before (−) and after (+) a 5 h cold and high light treatment (6°C and 1,600 μmol photons m-2 s-1), solubilized as indicated in (a), and immunoblotted with antibodies for Flag, PsaA, D1, and Lhcb2. For an internal loading control, 1 μg total chlorophyll of solubilized soq1 roqh1–1: ROQH1 OE thylakoids was loaded in the control lane. Two-dimensional BN/SDS-PAGE analysis from thylakoids isolated from wild type can be found in Extended Figure 2. Immunoblots are representative of 2 biologically independent experiments.
To determine whether the ROQH1 complexes contained photosynthetic chain components, two-dimensional SDS-PAGE immunoblot analysis was performed with photosystem core and antenna subunits D1, PsaA, and Lhcb2 (Figure 8b, Extended Figure 2). In both detergent conditions, the ROQH1-Flag signal was mainly detected at the expected size of 37 kD as well as 50 kDa, suggesting post-translational covalent modification (Figure 8b, Extended Figure 2 and Supplemental Figure 15b). When solubilized with digitonin and α-DM, ROQH1 did not seem to comigrate with any photosynthetic chain components except potentially D1 at the PSII monomer (Supplemental Figure 15b). When solubilized with β-DM, ROQH1 comigrated with Lhcb2 at the LHCII trimer and monomer (Figure 8b, Extended Figure 2), supporting the hypothesis that ROQH1 may function in a complex with LHCII.
Discussion and Conclusions
Both soq1 roqh1–1 and soq1 roqh1–3 (collectively termed here as soq1 roqh1) are constitutively quenched (Figure 3) and display features typically found in shade and low-light-acclimated plants, including thinner leaves, a lower chlorophyll a/b ratio, and more thylakoid stacking compared to wild type (Figure 4 and Supplemental Figure 9). Under standard growth conditions, leaves and vasculature from soq1 roqh1 are respectively 70 μm and 150 μm thinner than wild type due to a decrease in cell size and number (Supplemental Figure 9). This observation is consistent with shade and low-light-acclimated plants, where photosynthetically inactive leaf material such as the cell wall, epidermis, and vascular tissue is limited to maximize photosynthetically active tissue to total plant mass27,28. Compared to the wild type, soq1 roqh1 contains more antenna-associated pigments (chlorophyll b and neoxanthin) and fewer photosystem-associated pigments (chlorophyll a and β-carotene) per mole of total chlorophyll (Figure 4a and Supplemental Table 3), indicating that soq1 roqh1 may have more antenna complexes associated with fewer reaction centers29. An increase in antenna size could allow for an increased light-harvesting capacity and has been observed in wild-type Arabidopsis under limiting light conditions30,31. In addition, the thylakoid architecture of soq1 roqh1–1 is highly stacked with limited stroma lamellae membrane (Supplemental Figure 9). Grana stacking also increases the functional antenna size by forming semi-crystalline arrays of PSII-LHCII supercomplexes32,33. This organization enables excitation energy to flow between membranes until an open PSII reaction center is found34. Similar adjustments to grana organization and structure have been observed in shade obligate species and Arabidopsis plants transferred from high to low light intensities33,35. Taken together, these similarities between soq1 roqh1 and low-light-acclimated plants suggest that under standard growth conditions, the soq1 roqh1 mutants are light limited. This is confirmed under higher light intensities, where the growth of soq1 roqh1 improves in comparison to low light (Figure 4b, c). The possibility remains that enlarged grana is a direct consequence of the soq1 roqh1 mutations, which might promote energy dissipation through PSII-PSI spillover, and this merits future investigation.
Light intensity and quality are perceived in higher plants by phytochromes, cryptochromes, phototropins, and UV RESISTANCE LOCUS 8 (UVR8)36. These photoreceptors, particularly PhyB and Cry1, elicit signaling networks to control the shade avoidance syndrome and low light acclimation in germinating and growing seedlings36,37. However, once the chloroplast and photosynthetic apparatus is fully developed, chloroplast redox signals act above cytosolic photoreceptors to control acclimation38,39. This notion is shown through photoreceptor mutants that retain their ability to acclimate to various light intensities40. Thus, it is reasonable to assume that the light-limited phenotype observed in soq1 roqh1 is due to redox signals from photosynthetic starvation, rather than a defect in light perception or signaling. Photosynthetic starvation occurs because the constitutive qH in soq1 roqh1 dissipates the majority of light energy absorbed, leaving little for photochemistry. This hypothesis finds confirmation through soq1 roqh1–1 lcnp, which lacks qH and recovers normal growth, pigment composition, and leaf thickness (Figure 5b and Supplemental Figure 9). A similar response has been observed in the Arabidopsis mutants lacking either all minor light-harvesting complexes (NoM)41 or the chloroplast NADPH thioredoxin reductase C (NTRC)42. Both NoM and ntrc display moderate light starvation phenotypes, either due to reduced excitation trapping in PSII41 or enhanced qE42. In the case of NoM, the mutant over-accumulates major LHCIIs as a compensation mechanism, similar to how soq1 roqh1 over-accumulates chlorophyll b and neoxanthin. In the case of the ntrc mutant, when combined with mutation affecting PsbS (ntrc npq4), qE is eliminated and the double mutant shows improved growth42, similar to soq1 roqh1–1 lcnp. The ntrc mutant further demonstrates the physiological consequences of overprotection by enhanced NPQ.
Short chain dehydrogenases/reductases (SDR)s form a large NAD(P)H-dependent oxidoreductase protein superfamily. Members of this superfamily are found in all domains of life and perform diverse functions in lipid, amino acid, carbohydrate, steroid, and xenobiotic metabolism as well as in redox sensing43,44. SDRs are grouped by their conserved Rossmann-fold consisting of a central β-sheet with two or three α-helices flanking each side44. Within the Rossmann-fold, classical SDRs contain a dinucleotide binding motif (TGXXX[AG]XG) and a tetrad of catalytically active residues (D-S-YXXXK), yet sequence conservation is otherwise quite low44,45. In fact, atypical SDRs are the least conserved SDR family and may contain sequence modifications to these domains46. Such is the case with ROQH1, which contains a cofactor binding motif similar to the extended SDR subfamily ([ST]GGXGXXG)44 and a valine instead of a tyrosine in the predicted catalytic tetrad (D-S-VXXXK) (Figure 2a and Supplemental Figure 16). Typically, enzymatic function relies on the tyrosine to donate or remove protons to or from the substrate44, thus ROQH1 and other atypical SDRs are currently not known to have catalytic activity46. Of the 178 SDRs in Arabidopsis, 8 are classified as atypical45. Among these eight are the chloroplast stem loop-binding proteins 41a (CSP41a), CSP41b, high chlorophyll fluorescence173 (HCF173) and HCF244, all of which participate in RNA metabolism in the chloroplast47,48. In fungi, atypical SDRs also function as transcriptional regulators and/or redox sensors, as in the case of NmrA in Aspergillus nidulans49. NmrA preferentially binds oxidized dinucleotide cofactors to negatively regulate nitrogen metabolite repression49,50. These examples highlight the diverse roles of atypical SDRs, even though catalytic activity may be absent.
Point mutations within the Rossmann fold of ROQH1 affect its stability and/or degradation as well as its function to varying degrees. The ROQH1-Gly81Asp (roqh1–1) and ROQH1-Gly211Glu (roqh1–2) respectively accumulate 50% almost fully non-functional and 25% functional protein (Figures 2b, 3, 7). Indeed mutation to the putative NAD(P)H binding motif (GGTGGVG to GDTGGVG) in roqh1–1 results in a low fluorescence phenotype similar to the null allele, roqh1–3, when combined with the soq1 mutation (Figure 3). This result suggests that ROQH1-Gly81Asp is non-functional, however after a 5h cold and high light treatment, NPQ is slightly higher in roqh1–3 compared to roqh1–1 (Figure 7). This result indicates that the Gly81Asp mutation does not fully impair ROQH1 function. The point mutation in roqh1–2 disrupts a well conserved glycine residue (Supplemental Figure 16) that precedes the valine in the D-S-VXXXK motif (Figure 2a) and results in an intermediate lower Fm when combined with soq1 (Figure 3). Low levels of ROQH1 protein are sufficient to partially turn off qH (the soq1 SALK_001123 mutant displays an intermediate Fm phenotype, Supplemental Figure 5). Furthermore, the wild-type NPQ phenotype of soq1 roqh1: ROQH1 OE lines revealed that ROQH1 function is dosage dependent at high concentrations (Figure 6 and Supplemental Figure 7). The milder fluorescence phenotype, together with the dosage dependence of ROQH1 for relaxation of qH, suggests that the Gly211Glu mutation does not impair ROQH1 function and that the soq1 roqh1–2 phenotype is due to decreased protein levels rather than modified function.
ROQH1 is specific to plastid-containing organisms and is a member of the GreenCut2 inventory (named CGLD13 in Chlamydomonas reinhardtii)51,52. Among ROQH1 homologs, the predicted cofactor preference for NADP+ over NAD+ remains conserved. The cofactor preference is predicted by charged residues at the C-terminal end of the β2-strand53, and the conserved arginine residue in the β2-strand of ROQH1 indicates a conserved preference for NADP+ (Supplemental Figure 16). In Synechocystis sp. PCC 6803, the closest ROQH1 gene homolog is sll1218, annotated as “hypothetical protein YCF39”. slr0399 encodes YCF39, a PSII assembly factor homolog of HCF244 in Arabidopsis54,55. YCF39 forms a complex with terminal chlorophyll synthase G (ChlG) and high-light-inducible proteins, HliC and HliD, to provide safe delivery of chlorophyll to nascent PSII55. During PSII assembly, energy is dissipated from chlorophyll a via direct energy transfer to β-carotene within HliD56,57. It is proposed that YCF39 influences the binding pocket of β-carotene within HliD, allowing this quenching reaction to occur56. Perhaps ROQH1 functions through a similar mechanism as YCF39, but to promote relaxation of quenching in Arabidopsis.
The SOQ1 and LCNP genes are conserved among all land plants, yet they do not belong to the GreenCut2 inventory. In the case of SOQ1, this may be due to its multi-domain protein structure. SOQ1 homologs have been identified in Chlamydomonas and Synechocystis sp. PCC 6803, but as two separate proteins that contain either the HAD domain or the NHL and Trx-like domains. In Arabidopsis, it was previously shown that alternative splicing occurs, producing truncated transcripts with only the HAD domain 70% of the time instead of the full-length protein58. This supports the hypothesis that the multi-domain structure of SOQ1 in Arabidopsis is a recent protein fusion event and the HAD domain functions independently of the other domains59. Within the lipocalin superfamily, members show high structural similarity but poor sequence conservation60, thus LCNP gene homologs remain difficult to identify. Therefore, further investigation is required to determine whether qH is broadly conserved across the green lineage or restricted to land plants.
The low Fo and Fm values in dark-acclimated soq1 roqh1 are due to constitutive qH, as quenching requires the peripheral antenna of PSII and the LCNP protein17. The triple mutant combinations, soq1 roqh1–1 chlorina1, and soq1 roqh1–1 lcnp, indeed rescue fluorescence values to a similar level as their respective controls soq1 chlorina1 and soq1 lcnp (Figure 5). The combined effects of the soq1 and roqh1 mutations indicate that SOQ1 and ROQH1 have independent functions in qH. This notion becomes clear after a cold and high light treatment, where soq1 and roqh1 exhibit different qH induction and relaxation kinetics (Figure 7). Under cold and high light, roqh1 displays elevated levels of qH but to a lesser extent than soq1. Once returned to standard growth conditions, the additional qH relaxes normally in soq1 but fails to do so in roqh1. This inhibited relaxation explains the additional NPQ induced in roqh1. These results demonstrate that SOQ1 functions in inhibiting qH induction while ROQH1 functions in promoting qH relaxation (see working model, Extended Figure 3). Interestingly, by overexpressing ROQH1 in a soq1 roqh1 background, the NPQ induction and relaxation kinetics under standard conditions resemble those of wild type rather than soq1 (Figure 6 and Supplemental Figure 7). We hypothesize that the high levels of ROQH1 in the soq1 roqh1: ROQH1 OE lines may have inhibited qH by relaxing quenching sites faster than they are produced, even in the absence of SOQ1. Consistent with this hypothesis is the low NPQ in soq1 roqh1–1: ROQH1 OE under cold and high light compared to wild type (Figure 7). These results suggest that the functions of ROQH1 and LCNP are antagonistic and dosage dependent (Extended Figure 3). This concept is analogous to the photoprotective NPQ mechanism in cyanobacteria involving the orange carotenoid protein (OCP) and the fluorescence recovery protein (FRP) (for review see ref61). In this photoprotective cycle, quenching is induced by OCP upon photoconversion from the inactive orange form to the active red form62. Under low irradiance, FRP is required for OCP inactivation and removal from the phycobilisome63,64. Without this recovery factor, quenching in the frp mutant fails to relax, similarly to roqh1, while FRP overexpression minimizes quenching63, similarly to ROQH1 overexpression. However, FRP-mediated fluorescence recovery is achieved through a direct interaction between OCP and FRP63,65, and in the case of qH, ROQH1 and LCNP are physically separated by a thylakoid membrane. Thus, any antagonistic interaction between ROQH1 and LCNP is probably indirect.
Our current working hypothesis is that the formation of strong quenchers in the LHCII at the grana margin could quench excitation energy received by LHCII within the grana core. Therefore, access to stroma-exposed LHCII would be sufficient to turn off qH. ROQH1 could interact with antenna located on the outer grana and within the stroma lamellae consistent with its localization. Several stromal lamellae-localized proteins have been shown to have LHCII as their primary substrate, including the STN7 kinase and TAP38 phosphatase involved in state transitions66. After a cold and high light treatment, one- and two-dimensional BN/SDS-PAGE indicates that ROQH1-FLAG protein level increases and assembles into higher molecular weight complexes (Figure 8, Supplemental Figure 15). The increase in ROQH1-FLAG is likely due to the light-regulated I-box element present in the 35S promoter that is driving ROQH1 overexpression67,68. Strikingly a possible ROQH1-LHCII complex was observed only upon solubilization with β-DM (Figure 8a, b, Extended Figure 2). It may be that with α-DM solubilization, the FLAG epitope of ROQH1-FLAG is buried into LHCII subcomplexes and cannot be detected by the anti-FLAG antibody (Figure 8b, Extended Figure 2). The β-DM results are consistent with the potential involvement of ROQH1 in turning off qH at LHCII. Future experiments to determine the exact interacting partners and/or substrates of ROQH1, SOQ1 and LCNP will provide further insights into the overall quenching mechanism and its regulation.
METHODS
Plant material and growth conditions
The wild type and mutant Arabidopsis thaliana plants used in this study are of the Col-0 ecotype. Mutants soq1 npq4 roqh1–1 (#164), soq1 npq4 roqh1–2 (#108), soq1 roqh1–1, soq1 roqh1–2, roqh1–1, and roqh1–2 were isolated in this study. The soq1–1 mutant allele, referred to throughout as soq1, and soq1–1 npq4–1 are from ref16. The soq1–1 lcnp-1 mutant is from ref17. The lcnp T-DNA insertion line SALK_133049C was provided by F. Ouellet (Université du Québec à Montréal). The chlorina1–3 mutant25, referred to throughout as chlorina1, and the roqh1 T-DNA insertion lines SALK_039706.46.80 (roqh1–3), SALK_061421.54.50, SALK_001123, SALK_059586, SALK_025967, and SAIL_896_F07 were obtained from the Arabidopsis Biological Resource Center. The T-DNA insertion line GABI-KAT_446A01 was obtained from the University of Bielefeld.
Arabidopsis plants were grown on agar plates containing 0.5X Murashige and Skoog medium (VWR Scientific; 95026–314) under continuous light at 100 μmol photons m−2 s−1 at 21°C for 1.5–2 weeks and then transferred to soil (Sunshine Mix 4/LA4 potting mix; Sun Gro Horticulture Distribution). Once transplanted, plants were grown under a 10/14-h light/dark photoperiod at 120–150 μmol photons m−2 s−1 (standard light) at 21°C or under an 8/16-h light dark photoperiod at 1000–1,300 μmol photons m−2 s−1 (high light) at 21°C for 4–7 weeks. For seedlings grown on agar plates, growth chamber light bulbs were cool white from General Electric (F17T8/SP41 17W). For plants grown on soil, growth chamber light bulbs were cool white (4100K) from Philips (F25T8/TL841 25W) for standard light conditions, and high-pressure sodium and metal halide lamps from Philips (C1000S52 1000W) and Sylvania (MH1000U 1000W) for high light conditions. For the cold and high-light treatment, detached leaves were placed for 5 h at 6°C and 1,600 μmol photons m−2 s−1 using a JBeamBio LED panel with cool white LEDs (BXRA-56C1100-B-00). To determine rosette dry weight in Figure 5, rosettes from 5-week-old plants were harvested and baked in aluminum foil for 8 h at 105°C and then measured for dry weight.
Chlorophyll fluorescence video imaging suppressor screen and PAM fluorescence measurements
Mutagenesis and chlorophyll fluorescence screening of soq1 npq4 suppressors was performed as previously described17. Chlorophyll fluorescence measurements were determined at room temperature using an Imaging-PAM Maxi (Walz) or Dual-PAM-100 (Walz) fluorometer. False-colored fluorescence images and their respective Fo, Fm, and Fv/Fm values were determined using the Imaging-PAM Maxi, while NPQ induction and relaxation were determined using the Dual-PAM-100. Plant material was dark acclimated for 30 min prior to measurement unless stated otherwise. Maximum fluorescence levels after dark acclimation (Fm) and throughout an NPQ measurement (Fm’) were recorded after applying a saturating pulse of light. NPQ, calculated as (Fm-Fm’)/Fm’, was induced for 10 min with 1,200 μmol photons m−2 s−1 and relaxed for 10 min in the dark.
Genetic mapping, crosses, and overexpression
Mutations in #164 were identified through whole-genome sequencing, and the causative SNP was mapped to ROQH1 as previously described17. Genetic crosses were performed using standard techniques69. For whole-genome sequencing, #164 was backcrossed to soq1 npq4, and 146 seedlings with low Fm were pooled out of 709 total F2 progeny (20.6% segregation ratio). To obtain the double and single mutants, #164 and #108 were outcrossed to either soq1 or the wild type. From the cross between #164 and soq1, 33 seedlings out of 140 F2 progeny were confirmed to have low Fm and both mutations (23.6% segregation ratio). From the cross between #164 and wild type, 29 seedlings out of 743 total F2 progeny were confirmed to have low Fm and both soq1 and roqh1–1 mutations (4% segregation ratio). From the cross between #108 and wild type, 12 seedlings out of 202 total F2 progeny were confirmed to have intermediate Fm and both soq1 and roqh1–2 mutations (6% segregation ratio). The double mutant, soq1 roqh1–3 was obtained from an independent cross between soq1 and the T-DNA insertional line SALK_039706. From this cross 103 seedlings out of 1929 total F2 progeny were confirmed to have low Fm and both soq1 and roqh1–3 mutations (5.3% segregation ratio). The double mutant, soq1 SALK_001123 was obtained from an independent cross between soq1 and the T-DNA insertional line SALK_001123. From this cross 120 seedlings out of 2323 total F2 progeny displayed intermediate Fm and contained both soq1 and SALK_001123 mutations (5.2% segregation ratio). ROQH1 overexpression was done by adding a C-terminal FLAG tag to ROQH1 cDNA via round-the-horn PCR mutagenesis using the forward primer CA34 (GACCCAGCTTTCTTGTACAA) and the reverse primer CA35 (TTACTTATCATCATCATCCTTATAATCTTTGGATTCTGCAGCTTTA) and cloning ROQH1-FLAG into the pEarleyGate100 expression vector70 under the cauliflower mosaic virus 35S promoter. soq1 roqh1–1 and soq1 roqh1–3 plants were transformed with this construct using the floral dip method71, and transformants were selected on plates containing 10 μg/ml glufosinate ammonium. T1 transformants were allowed to self, and segregating T2s were screened for homozygosity on plates containing Murashige and Skoog medium with and without 10 μg/ml glufosinate ammonium. Heterozygous T2s and homozygous T3s were used in this study.
Genotyping primers
Genotyping was done using the Phire Plant Direct PCR kit and protocol (ThermoFisher Scientific) with gene specific primers indicated below. Genotyping for the soq1 mutation was done through PCR followed by digestion with the restriction enzyme, PstI. Genotyping for the roqh1–1 SNP was done through PCR followed by digestion with the restriction enzyme, AciI. The digestion products were run on a 3% agarose gel at 120V. The PCR product was digested by the restriction enzyme if it was the wild-type allele and undigested if it was the mutant allele. Genotyping insertional mutants was done using the LBb1.3 border primer and gene specific primers made through the Salk Institute Genomic Analysis Laboratory T-DNA primer design tool.
| Genotype | Forward Primer | Reverse Primer |
|---|---|---|
| soq1–1 | GAAGTGGTTTCTTTTGTACAATTCTGCA | CAATACGAATAGCGCACACG |
| roqh1–1 | GCTACAAAATCCCAAATCAGAA | GTAGTGTATCCGAAATAGTGAG |
| roqh1–3 | TTGACCAATAACAACTGCACG | TTTATCTTCGTCAATCACGCC |
| lcnp-1 | CCGCTTTGACATTTACATTACG | TATAGCAATGTCGGCTCCAAC |
| ROQH1 | GCTACAAAATCCCAAATCAGAA | ATTGCTGTGGATCACTTCCTG |
Protein extraction, localization, and immunoblot analysis
Total proteins from whole cell extracts or isolated thylakoids were extracted, solubilized in either an SDS lysis buffer (100 mM EDTA (pH 8.0), 120 mM Tris-HCl (pH 6.8), 4% SDS, 12% sucrose, 200 mM DTT, and 100 mM sodium carbonate for 10 min at 100°C) or LDS buffer (2% LDS, 30 mM Tris-HCl (pH 9.0), 30 mM Tris-HCl (pH 8.0), 60 mM DTT, 30% sucrose for 30 min at RT) and precipitated with methanol and chloroform. For immunoblots, samples were loaded by either equal leaf area or chlorophyll content on Any kD Mini-PROTEAN TGX Precast Protein Gels (Bio-Rad), separated by SDS-PAGE, transferred to a 0.45μm PVDF membrane (GE Healthcare), blocked with 3% nonfat dry milk, and incubated with the following antibodies. A rabbit antibody raised against a C-terminal peptide of SOQ117 was used at a 1:200 dilution. A rabbit polyclonal antibody raised against the C-terminal portion (starting from amino acid sequence RLLLR) of recombinant ROQH1 was used at a 1:2,500 dilution (AS12 2118). A rabbit antibody raised against recombinant LCNP protein18 was provided by F. Ouellet (Université du Québec à Montréal) and used at a 1:2,000 dilution. An anti-FLAG antibody was obtained from Sigma-Aldrich and used at a 1:1,500 dilution. A rabbit polyclonal antibody raised against a synthetic peptide of the beta subunit of ATP synthase was obtained from Agrisera and used at 1:10,000 dilution. Antibodies used for subcellular localization and membrane salt-wash experiments were D2, Lhca1, Lhcb2, Rubisco and PsaD, all from Agrisera, Vännäs, Sweden, catalog numbers AS06 146 (1:8,000 dilution), AS06 146 (1:8,000 dilution), AS01 003 (1:8,000 dilution), AS03 037 (1:10,000 dilution) and AS09 461 (1:10,000 dilution), respectively. After incubation with an HRP-conjugated, anti-rabbit secondary antibody from GE Healthcare (1:10,000 dilution), bands were detected by chemiluminescence using SuperSignal West Femto Maximum Sensitivity Substrate (Thermo Scientific).
For subcellular localization, 40 g of four-week old A. thaliana leaves were homogenized in 30 mL preparation buffer (25 mM Tricine-NaOH, pH 7.8, 330 mM sorbitol, 1 mM EDTA, 10 mM KCl, 0.15% [w/v] bovine serum albumin, 4 mM sodium ascorbate, and 7 mM L-Cysteine) in a precooled Waring blender for five periods of 1 s at high speed. The homogenate was immediately filtered through four layers of Miracloth (20-μm pore size), and the pellet was collected from the filtrate by centrifugation for 3 min at 1,000 × g in the cold (4°C). The pellet was resuspended in the same buffer and centrifuged again for 5 min at 1,000 × g. Intact chloroplasts were purified on 35%/80% (v/v) Percoll step gradients and separated by centrifugation at 2,000 × g for 15 min in a swinging-bucket rotor. For fractionation into stromal and thylakoid protein fractions, 30 mL of preparation buffer was gently mixed with the chloroplasts collected from the gradient. Subsequently, the chloroplasts were recovered by centrifugation at 2,500 × g for 4 min, resuspended in 3 mL of chloroplast lysis buffer (10 mM Tricine-NaOH, pH 7.8, and 5 mM MgCl2), and incubated on ice for 15 min. A Pyrex Potter-Elvehjem tissue grinder (homogenizer) was used to mediate complete lysis of the chloroplasts. The thylakoid membranes were collected by centrifugation for 5 min at 8,000 × g, resuspended in buffer (100 mM sorbitol, 25 mM Tricine-NaOH, pH 7.8, 5 mM MgCl2 and 10 mM KCl), and purified on a sucrose gradient (40%–80%) by centrifugation at 30,000 × g for 1 h. The soluble stromal proteins were collected from the supernatant of the chloroplast lysis. The stromal fraction was centrifuged at 8,000g for 4 min to remove any membrane particles and concentrated in a SpeedVac. For subfractionation thylakoids membranes were solubilized for 15 min on ice in the presence of 1% digitonin. The reaction was quenched by addition of 10-fold volume of ice-cold resuspension buffer. After centrifugation at 1,000 × g for 3 min at 4°C, the supernatant was collected, and grana membranes were obtained by centrifugation at 10,000 g for 30 min at 4°C. The supernatant was centrifuged at 40,000 × g for 30 min at 4 °C to collect the grana margins and then to pellet the stroma lamellae membranes, the supernatant was centrifuged at 145,000 × g for 1 h at 4°C.
For salt washing of thylakoid membranes and further immunolocalization of ROQH1, isolated thylakoid membranes described previously were vortexed for 1 min and then sonicated for 15 min on ice in the presence of 1M NaCl, 0.1M Na2CO3 or 0.1M CaCl2 in buffer (100 mM sorbitol, 25 mM Tricine-NaOH, pH 7.8, 5 mM MgCl2, and 10 mM KCl) before centrifugation to separate soluble and membrane fractions. 3 μg chlorophyll from supernatant and pellets was loaded on the SDS-PAGE gel. For control, thylakoids without any treatment of salt were used.
Blue native PAGE
For BN-PAGE, thylakoids were isolated by sucrose cushion as described in ref72. Isolated thylakoids were resuspended in sucrose storage solution (20 mM tricine-KOH pH 7.8, 0.4 M sucrose, 15 mM NaCl, 5 mM MgCl2) to 1.0 mg chlorophyll/mL. An equal volume of storage solution containing 2% n-dodecyl-α-D-maltoside, digitonin, or n-dodecyl-β-D-maltoside was added to solubilize thylakoids at a final concentration of 1% detergent per 0.5 mg chlorophyll/mL. Thylakoids were solubilized on ice in the dark for 15 min. After solubilization, insolubilized material was pelleted by centrifugation at 14,000 × g for 10 min. The supernatant was combined with one-tenth volume of loading buffer (100 mM Bis-Tris-HCl pH 7, 500 mM aminocaproic acid, 30% sucrose, 5% Coomassie G250), and 8 μg total chlorophyll was separated on a 4–16% Bis-Tris Novex NativePAGE gel according to ref73. Before immunoblotting the first dimension, the native gel was soaked in denaturing buffer (0.1 M EDTA-NaOH pH 8.0, 0.12 M Tris-HCl pH 6.8, 4% SDS, 12% sucrose, 0.2 M DTT, 0.1 M Na2CO3, 8 M urea) for 30 min before transferring. For separation in the second dimension, lanes were cut and soaked in denaturing buffer for 30 min and placed on top of a 10% Bis-Tris 2D Novex NuPAGE gel and further separated using MES running buffer (50 mM MES, 50 mM Tris, 0.1% SDS, 1 mM EDTA-HCl pH 7.3). The 2D gel was transferred to a 0.45 μm PVDF membrane followed by immunoblotting with PsaA (1:10,000), FLAG (1:1,500 dilution), D1 (1:10,000 dilution), and Lhcb2 (1:5,000 dilution) antibodies.
Pigment extraction and analysis
Whole plants or detached leaves were sampled under standard light (120–150 μmol photons m−2 s−1) or treated with high light (1,000 μmol photons m−2 s−1) for 30 min prior to pigment analysis. Three samples from different individuals were weighed and pigment analysis was normalized by fresh weight and total chlorophyll. For the cold and high light treatment, three samples from different individuals of each genotype were taken at indicated time points (0, 5, and 28 h) and zeaxanthin levels were normalized by total chlorophyll. Chlorophylls and carotenoids were extracted and quantified by HPLC analysis as previously described74.
Microscopy
For transmission electron microscopy, leaves were subjected to high pressure freezing, freeze-substitution in osmium tetroxide, and infiltration with epoxy resin75. Chloroplast ultrastructure was imaged on a Tecnai 12 and all grana on 10 representative chloroplast images of each genotype were quantified using ImageJ.
For light microscopy, leaves were embedded in 7% agarose and sectioned into 80–100 μm thick sections using a 752/M vibroslice tissue cutter from Campden Instruments Limited76. Sections were stained with 0.02% toluidine blue O for 30 s and imaged on a Zeiss AxioImager with a QImaging MicroPublisher color camera. For quantification of leaf and vein thickness, 10 representative images of each genotype were measured using ImageJ. Leaf thickness was measured approximately 150 μm away from the mid-vein where a lateral vein or trichome was not present, and the mid-vein was measured from the adaxial surface to the abaxial surface.
Extended Data
Extended Figure 1. ROQH1 is enriched at the chloroplast stroma lamellae.
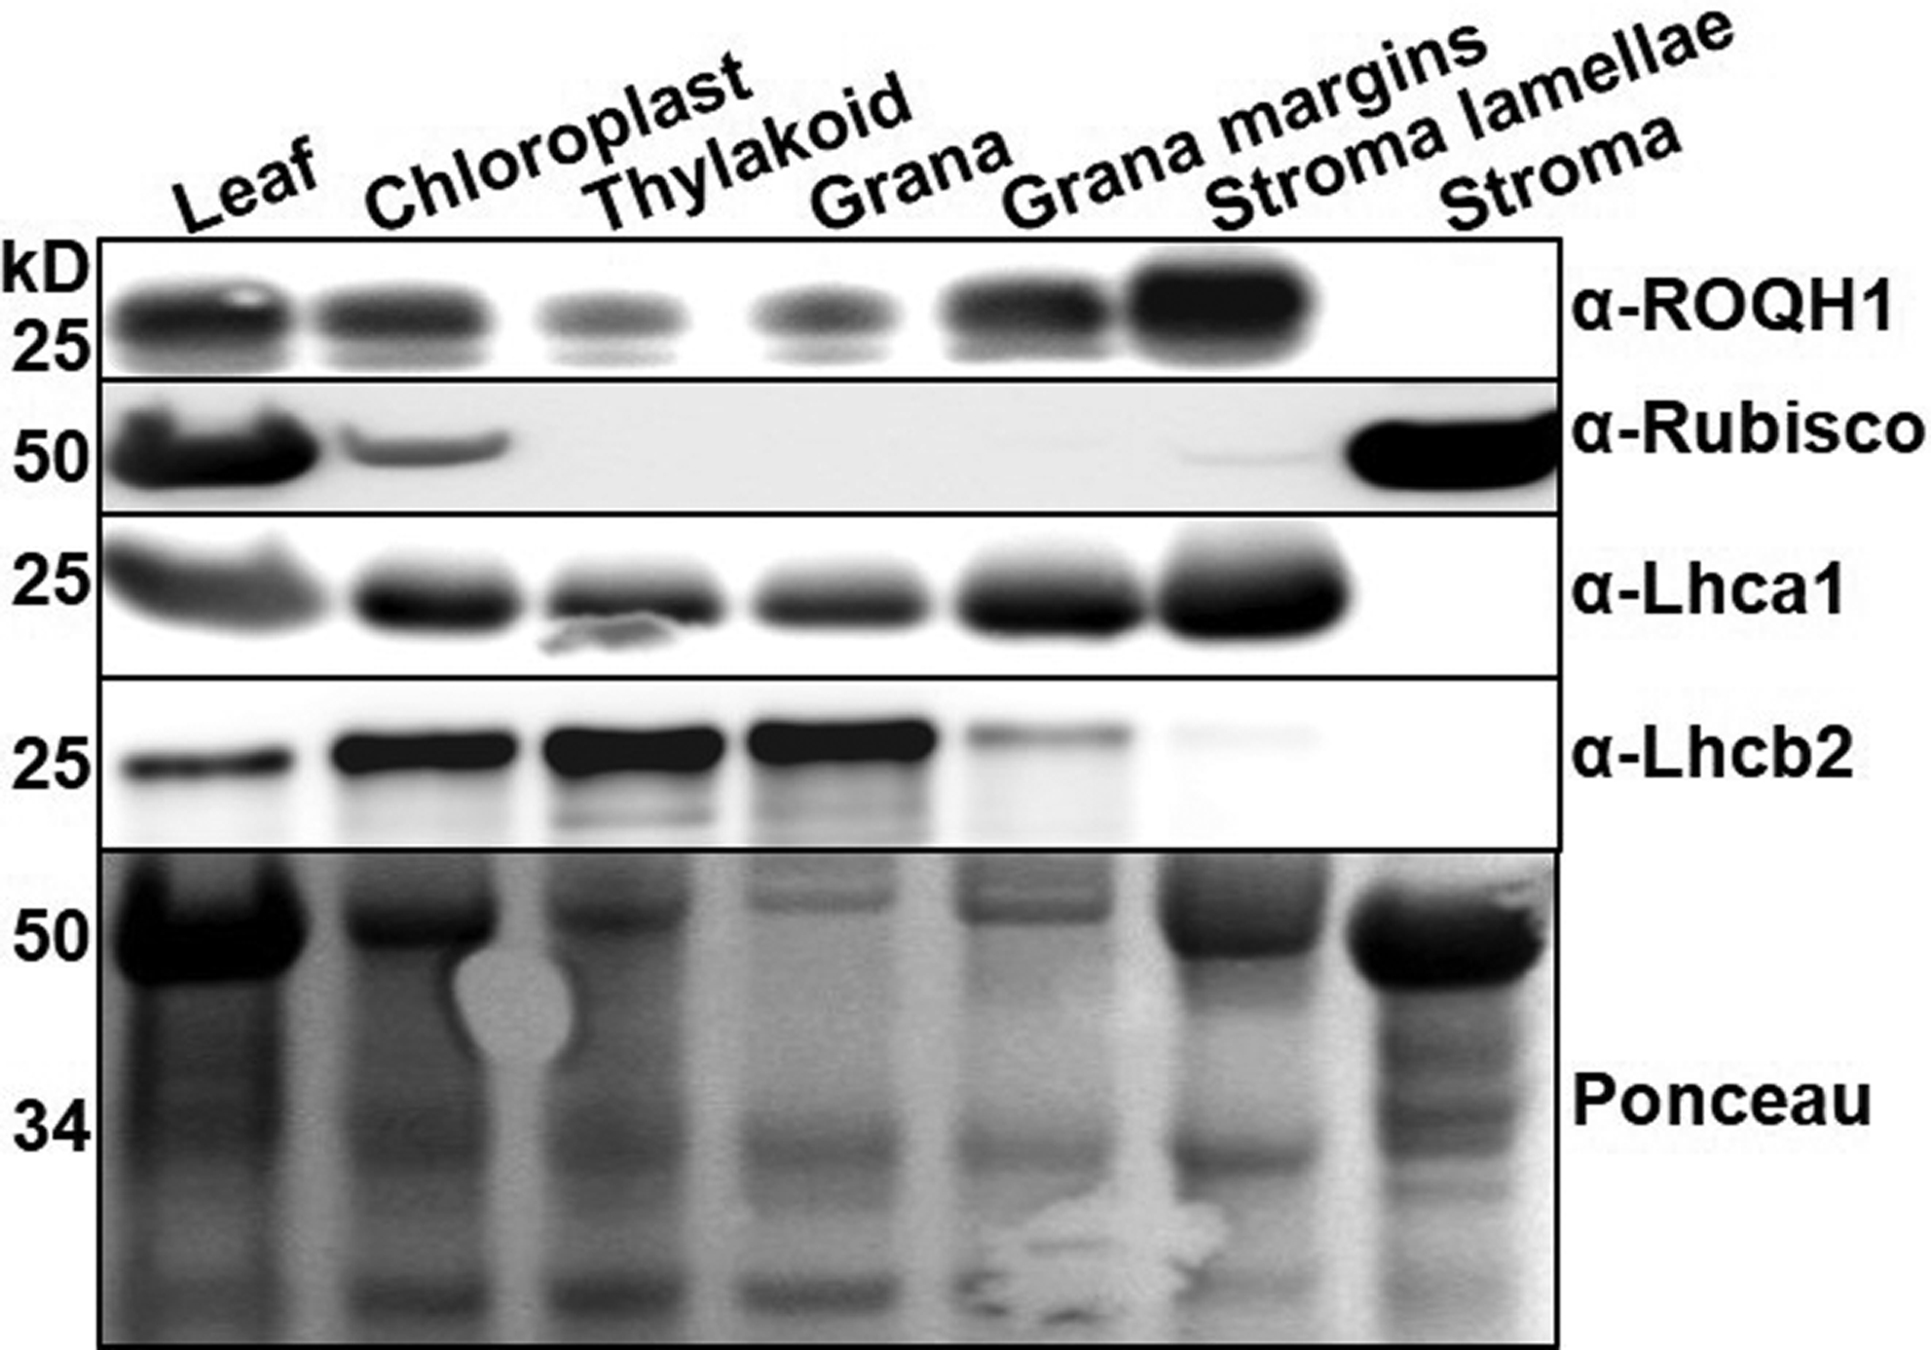
Proteins were separated by SDS-PAGE and analyzed by immunodetection with antibodies against ROQH1, Rubisco, Lhcal, Lhcb2, D2, or PsaD. Coomassie blue (CB) or Ponceau are shown as loading controls. Molecular masses (kD) are indicated according to the migration of Precision Plus Protein Standards markers from Bio-Rad. Total leaf extract (Leaf) from plants grown under 120 μmol photons m−2 s−1, 21°C were fractionated into chloroplasts, thylakoids, grana (appressed membranes), grana margins, stroma, and stroma lamellae (non-appressed membranes). Proteins were separated by SDS-PAGE and analyzed by immunodetection with antibodies against ROQH1, Rubisco, Lhca1, Lhcb2, D2, or PsaD. Coomassie blue (CB) or Ponceau are shown as loading controls. Molecular masses (kD) are indicated according to the migration of Precision Plus Protein Standards markers from Bio-Rad. Samples were loaded by equal total chlorophyll content (3 μg). Immunoblot is representative of 5 biologically independent experiments.
Extended Figure 2. ROQH1 functions in a complex after cold and high light.
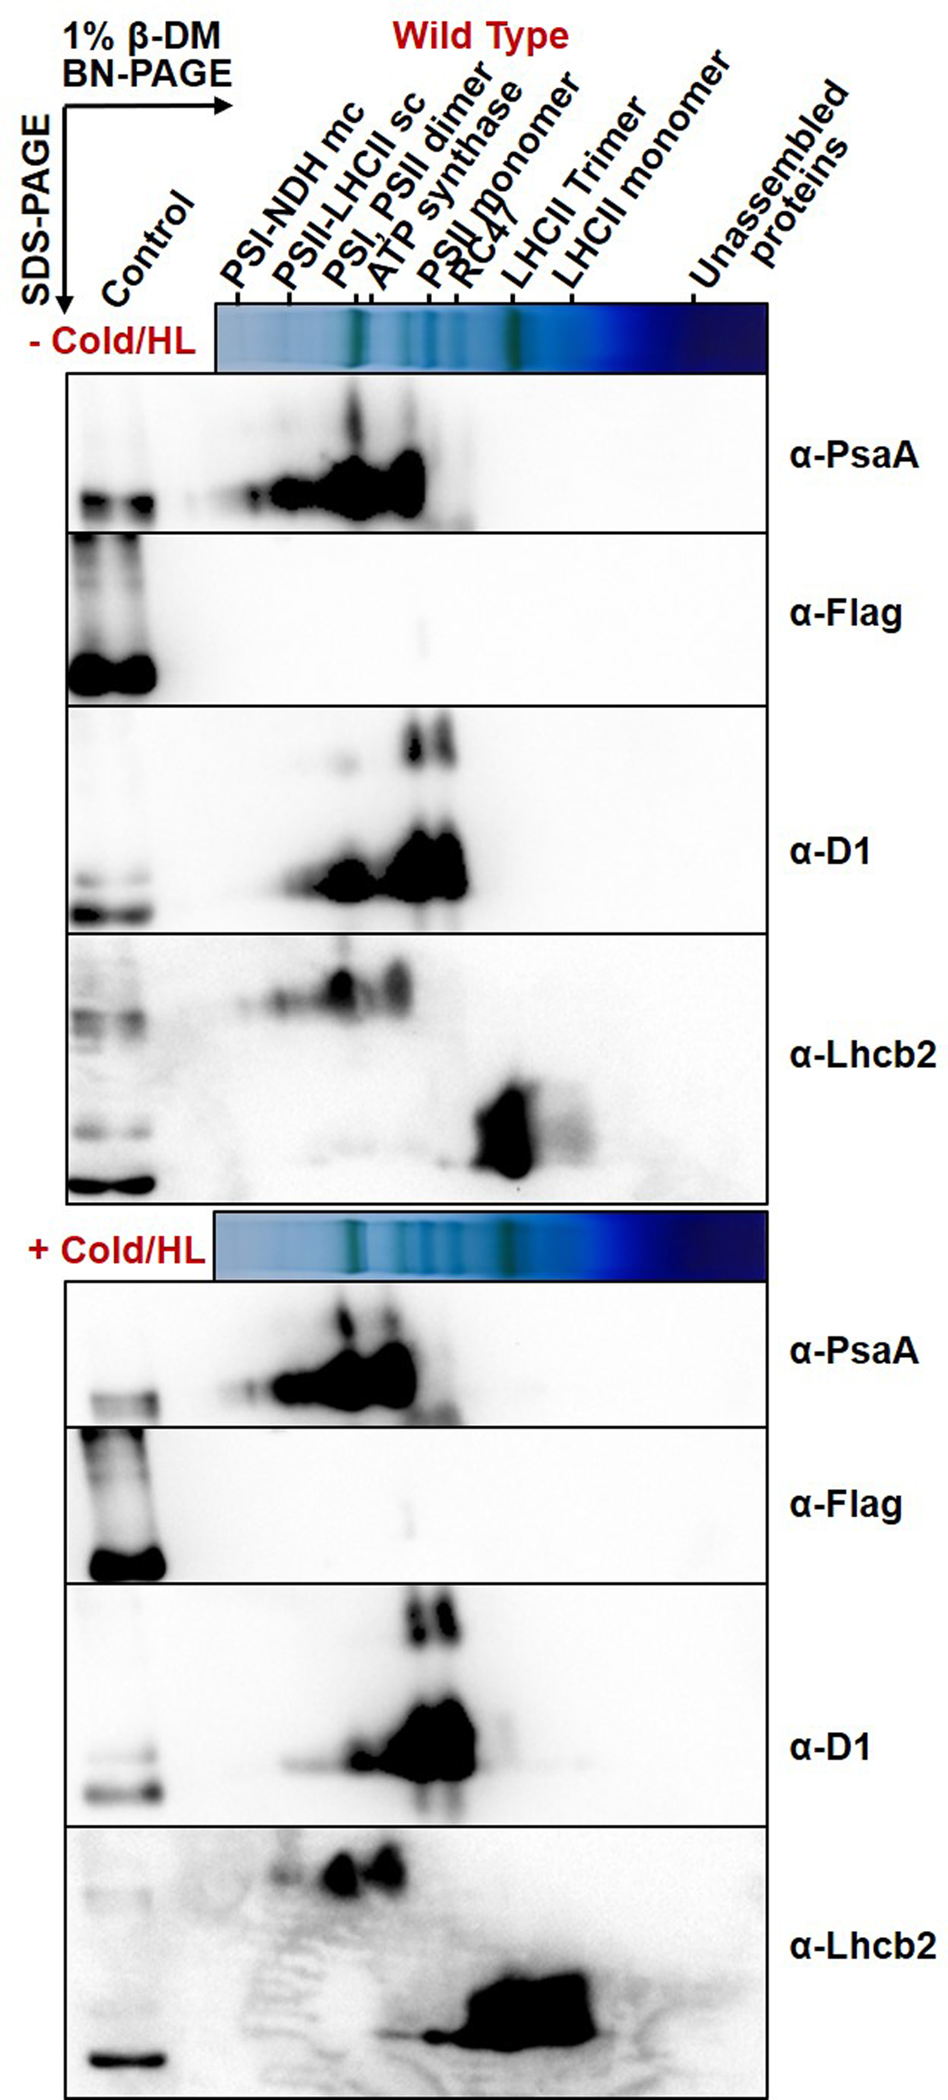
Two-dimensional BN/SDS-PAGE analysis from wild-type thylakoids isolated before (−) and after (+) a 5 h cold and high light treatment (6°C and 1,600 μmol photons m−2 s−1), solubilized with 1% β-DM and immunoblotted with antibodies for Flag, PsaA, D1, and Lhcb2. For an internal loading control, 1 μg total chlorophyll of solubilized soq1 roqh1–1: ROQH1 OE thylakoids was loaded in the control lane. Immunoblots are representative of 2 biologically independent experiments.
Extended Figure 3. ROQH1 is required to turn off qH.
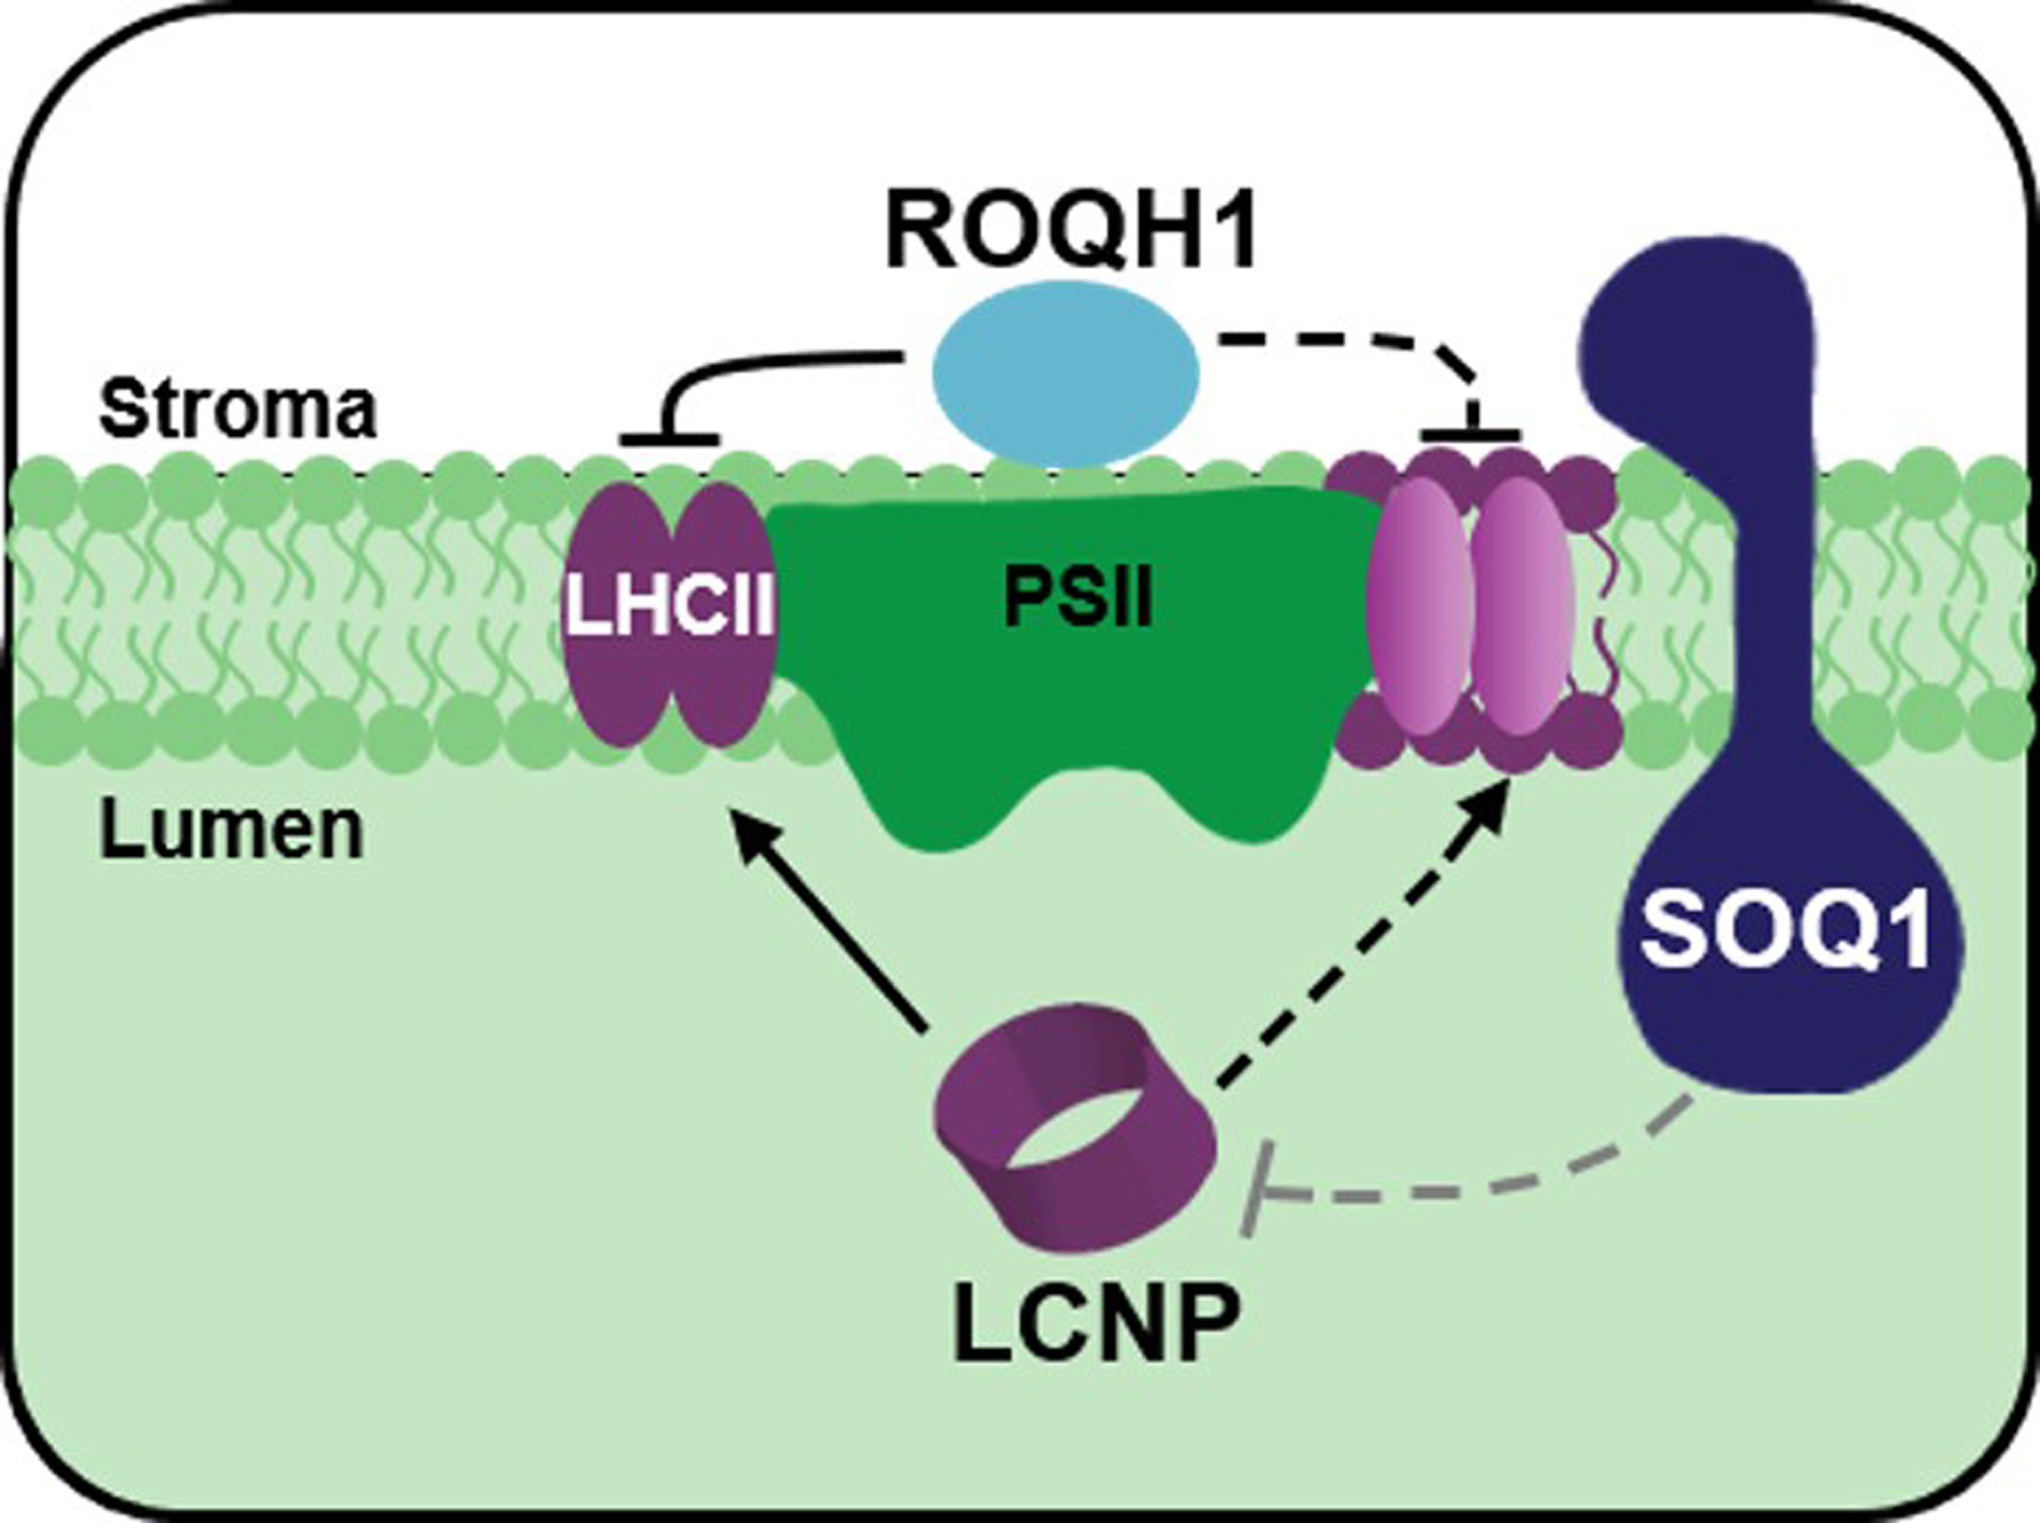
Under non-stress conditions, SOQ1 inhibits LCNP activity. Under stress conditions, such as cold and high light, SOQ1 inhibition is relieved (grey dashed line) and LCNP is active. Quenching sites indicated by purple color are produced in the peripheral antenna directly mediated by LCNP (solid arrow) or indirectly (dashed arrow) through LCNP modification of LHCII hydrophobic environment. ROQH1 recycle these quenching sites back to light harvesting sites either directly by acting at the antenna (solid line) or indirectly through modification of LHCII hydrophobic environment (dashed line). Adapted from ref17.
Supplementary Material
ACKNOWLEDGMENTS
We thank Steve Ruzin and Denise Schichnes from the Biological Imaging Facility and Kent McDonald and Reena Zalpuri from the Transmission Electron Microscopy Facility at UC Berkeley for technical advice and assistance. We thank Sanya Shahrasbi and Siyoun Lee for assistance with mutant screening and crosses, Carine Marshall for advice regarding DNA sequencing, François Ouellet for providing antibodies against LCNP, and Masakazu Iwai for advice regarding Blue-Native PAGE and critical reading of the manuscript. We are also grateful to Roberta Croce and Christopher Gee for critical discussions. Cynthia L. Amstutz would like to dedicate this manuscript in memory of Daniel L. Amstutz, a loving father and faithful supporter of all her academic endeavors. This research was supported by the Division of Chemical Sciences, Geosciences, and Biosciences, Office of Basic Energy Sciences, Office of Science, US Department of Energy (Field Work Proposal 449B). This work used the Vincent J. Coates Genomics Sequencing Laboratory at UC Berkeley, supported by NIH S10 Instrumentation Grants S10RR029668 and S10RR027303. R.F. was supported by the Dutch Organization for Scientific Research (NWO) via an ECHO grant to Roberta Croce and by the U.S. Department of Energy Office of Science, Office of Biological and Environmental Research program under Award Number DE-FC02-02ER63421. A.S. was supported by the National Institute of Health National Research Service Award Trainee appointment (grant no. GM007127). K.K.N. is an investigator of the Howard Hughes Medical Institute.
Footnotes
Competing interest statement
The authors have no competing interests as defined by Nature Research, or other interests that might be perceived to influence the results and/or discussion reported in this paper.
Data availability statement
Sequence data from this article can be found in the Arabidopsis Genome Initiative under accession numbers At1g44575 (PsbS), At1g56500 (SOQ1), At3g47860 (LCNP), and At4g31530 (ROQH1).
REFERENCES
- 1.Niyogi KK Photoprotection revisited: Genetic and molecular approaches. Annu. Rev. Plant Physiol. Plant Mol. Biol 50, 333–359 (1999). [DOI] [PubMed] [Google Scholar]
- 2.Demmig-Adams B & Adams WW III Photoprotection and other responses of plants to high light stress. Annu. Rev. Plant Phvsiol. Plant Mol. Bioi 43, 599–626 (1992). [Google Scholar]
- 3.Walters RG & Horton P Resolution of components of non-photochemical chlorophyll fluorescence quenching in barley leaves. Photosynth. Res 27, 121–133 (1991). [DOI] [PubMed] [Google Scholar]
- 4.Malnoë A Photoinhibition or photoprotection of photosynthesis, which one is it? Update on newly termed sustained quenching component, qH. Environ. Exp. Bot (2018). doi: 10.1016/j.envexpbot.2018.05.005 [DOI] [Google Scholar]
- 5.Li X-P et al. Regulation of photosynthetic light harvesting involves intrathylakoid lumen pH sensing by the PsbS protein. J. Biol. Chem 279, 22866–22874 (2004). [DOI] [PubMed] [Google Scholar]
- 6.Hager A Light dependent decrease of the pH-value in a chloroplast compartment causing the enzymatic interconversion of violaxanthin to zeaxanthin; relations to photophosphorylation. Planta 89, 224–243 (1969). [DOI] [PubMed] [Google Scholar]
- 7.Yamamoto HY, Kamite L & Wang Y-Y An ascorbate-induced absorbance change in chloroplasts from violaxanthin de-epoxidation. Plant Physiol. 49, 224–228 (1972). [DOI] [PMC free article] [PubMed] [Google Scholar]
- 8.Demmig B, Winter K, Krüger A & Czygan F-C Photoinhibition and zeaxanthin formation in intact leaves. A possible role of the xanthophyll cycle in the dissipation of excess light energy. Plant Physiol. 84, 218–224 (1987). [DOI] [PMC free article] [PubMed] [Google Scholar]
- 9.Niyogi KK, Grossman AR & Björkman O Arabidopsis mutants define a central role for the xanthophyll cycle in the regulation of photosynthetic energy conversion. Plant Cell 10, 1121–1134 (1998). [DOI] [PMC free article] [PubMed] [Google Scholar]
- 10.Havaux M, Bonfils J-P, Lütz C & Niyogi KK Photodamage of the photosynthetic apparatus and its dependence on the leaf developmental stage in the npq1 Arabidopsis mutant deficient in the xanthophyll cycle enzyme violaxanthin de-epoxidase. Plant Physiol. 124, 273–284 (2000). [DOI] [PMC free article] [PubMed] [Google Scholar]
- 11.Dall’Osto L, Caffarri S & Bassi R A mechanism of nonphotochemical energy dissipation, independent from PsbS, revealed by a conformational change in the antenna protein CP26. Plant Cell 17, 1217–1232 (2005). [DOI] [PMC free article] [PubMed] [Google Scholar]
- 12.Betterle N, Ballottari M, Hienerwadel R, Dall’Osto L & Bassi R Dynamics of zeaxanthin binding to the photosystem II monomeric antenna protein Lhcb6 (CP24) and modulation of its photoprotection properties. Arch. Biochem. Biophys 504, 67–77 (2010). [DOI] [PubMed] [Google Scholar]
- 13.Nilkens M et al. Identification of a slowly inducible zeaxanthin-dependent component of non-photochemical quenching of chlorophyll fluorescence generated under steady-state conditions in Arabidopsis. Biochim. Biophys. Acta - Bioenerg 1797, 466–475 (2010). [DOI] [PubMed] [Google Scholar]
- 14.Krause GH Photoinhibition of photosynthesis. An evaluation of damaging and protective mechanisms. 74, 566–574 (1988). [Google Scholar]
- 15.Demmig B & Björkman O Comparison of the effect of excessive light on chlorophyll fluorescence (77K) and photon yield of O2 evolution in leaves of higher plants. Planta 171, 171–184 (1987). [DOI] [PubMed] [Google Scholar]
- 16.Brooks MD, Sylak-Glassman EJ, Fleming GR & Niyogi KK A thioredoxin-like/β-propeller protein maintains the efficiency of light harvesting in Arabidopsis. Proc. Natl. Acad. Sci. U. S. A 110, E2733–40 (2013). [DOI] [PMC free article] [PubMed] [Google Scholar]
- 17.Malnoë A et al. The Plastid Lipocalin LCNP is Required for Sustained Photoprotective Energy Dissipation in Arabidopsis. Plant Cell 30, 196–208 (2017). [DOI] [PMC free article] [PubMed] [Google Scholar]
- 18.Levesque-Tremblay G, Havaux M & Ouellet F The chloroplastic lipocalin AtCHL prevents lipid peroxidation and protects Arabidopsis against oxidative stress. Plant J. 60, 691–702 (2009). [DOI] [PubMed] [Google Scholar]
- 19.Grzyb J, Latowski D & Strzalka K Lipocalins – a family portrait. J. Plant Physiol 163, 895—915 (2006). [DOI] [PubMed] [Google Scholar]
- 20.Emanuelsson O, Nielsen H, Brunak S & Von Heijne G Predicting subcellular localization of proteins based on their N-terminal amino acid sequence. J. Mol. Biol 300, 1005–1016 (2000). [DOI] [PubMed] [Google Scholar]
- 21.Tomizioli M et al. Deciphering thylakoid sub-compartments using a mass spectrometry-based approach. Mol Cell. Proteomics 13, 2147–2167 (2014). [DOI] [PMC free article] [PubMed] [Google Scholar]
- 22.Schwacke R et al. ARAMEMNON, a Novel Database for Arabidopsis Integral Membrane Proteins. Plant Physiol. 131, 16–26 (2003). [DOI] [PMC free article] [PubMed] [Google Scholar]
- 23.Omasits U, Ahrens CH, Müller S & Wollscheid B Protter: interactive protein feature visualization and integration with experimental proteomic data. Bioinformatics 30, 884–886 (2014). [DOI] [PubMed] [Google Scholar]
- 24.Espineda CE, Linford AS, Devine D & Brusslan JA The AtCAO gene, encoding chlorophyll a oxygenase, is required for chlorophyll b synthesis in Arabidopsis thaliana. Proc. Natl. Acad. Sci. USA 96, 10507–10511 (1999). [DOI] [PMC free article] [PubMed] [Google Scholar]
- 25.Kim E-H et al. The multiple roles of light-harvesting chlorophyll a/b-protein complexes define structure and optimize function of Arabidopsis chloroplasts: A study using two chlorophyll b-less mutants. Biochim. Biophys. Acta 1787, 973–984 (2009). [DOI] [PubMed] [Google Scholar]
- 26.Pagliano C, Barera S, Chimirri F, Saracco G & Barber J Comparison of the α and β isomeric forms of the detergent n-dodecyl-D-maltoside for solubilizing photosynthetic complexes from pea thylakoid membranes. Biochim. Biophys. Acta - Bioenerg 1817, 1506–1515 (2012). [DOI] [PubMed] [Google Scholar]
- 27.Björkman O Responses to different quantum flux densities in Physiological Plant Ecology I. Responses to the Physical Environment (eds. Lange OL, Nobel PS, Osmond CB & Ziegler H) 57–108 (Springer-Verlag; Berlin Heidelberg, 1981). [Google Scholar]
- 28.Lichtenthaler HK et al. Photosynthetic activity, chloroplast ultrastructure, and leaf characteristics of high-light and low-light plants and of sun and shade leaves. Photosynth. Res 2, 115–141 (1981). [DOI] [PubMed] [Google Scholar]
- 29.Eskins K, Duysen ME & Olson L Pigment analysis of chloroplast pigment-protein complexes in wheat. Plant Physiol. 71, 777–779 (1983). [DOI] [PMC free article] [PubMed] [Google Scholar]
- 30.Bailey S, Walters RG, Jansson S & Horton P Acclimation of Arabidopsis thaliana to the light environment: the existence of separate low light and high light responses. Planta 213, 794–801 (2001). [DOI] [PubMed] [Google Scholar]
- 31.Bielczynski LW, Schansker G & Croce R Effect of light acclimation on the organization of photosystem II super- and sub-complexes in Arabidopsis thaliana. Front. Plant Sci 7, 105 (2016). [DOI] [PMC free article] [PubMed] [Google Scholar]
- 32.Anderson JM, Chow WS & De Las Rivas J Dynamic flexibility in the structure and function of photosystem II in higher plant thylakoid membranes: the grana enigma. Photosynthesis Research 98, 575–587 (2008). [DOI] [PubMed] [Google Scholar]
- 33.Pribil M, Labs M & Leister D Structure and dynamics of thylakoids in land plants. J. Exp. Bot 65, 1955–1972 (2014). [DOI] [PubMed] [Google Scholar]
- 34.Dekker JP & Boekema EJ Supramolecular organization of thylakoid membrane proteins in green plants. Biochim. Biophys. Acta 1706, 12–39 (2005). [DOI] [PubMed] [Google Scholar]
- 35.Anderson JM, Horton P, Kim E-H & Chow WS Towards elucidation of dynamic structural changes of plant thylakoid architecture. Phil. Trans. R. Soc. B 367, 3515–24 (2012). [DOI] [PMC free article] [PubMed] [Google Scholar]
- 36.Casal JJ Photoreceptor signaling networks in plant responses to shade. Annu. Rev. Plant Biol 64, 403–427 (2013). [DOI] [PubMed] [Google Scholar]
- 37.Keller MM et al. Cryptochrome 1 and phytochrome B control shade-avoidance responses in Arabidopsis via partially independent hormonal cascades. Plant J. 67, 195–207 (2011). [DOI] [PMC free article] [PubMed] [Google Scholar]
- 38.Fey V et al. Retrograde plastid redox signals in the expression of nuclear genes for chloroplast proteins of Arabidopsis thaliana. J. Biol. Chem 280, 5318–5328 (2005). [DOI] [PubMed] [Google Scholar]
- 39.Pfalz J et al. Environmental control of plant nuclear gene expression by chloroplast redox signals. Front. Plant Sci 3, 257 (2012). [DOI] [PMC free article] [PubMed] [Google Scholar]
- 40.Walters RG, Rogers JJM, Shephard F & Horton P Acclimation of Arabidopsis thaliana to the light environment: the role of photoreceptors. Planta 209, 517–527 (1999). [DOI] [PubMed] [Google Scholar]
- 41.Dall’Osto L, Ünlü C, Cazzaniga S & Van Amerongen H Disturbed excitation energy transfer in Arabidopsis thaliana mutants lacking minor antenna complexes of photosystem II. Biochim. Biophys. Acta 1837, 1981–1988 (2014). [DOI] [PubMed] [Google Scholar]
- 42.Naranjo B et al. The chloroplast NADPH thioredoxin reductase C, NTRC, controls nonphotochemical quenching of light energy and photosynthetic electron transport in Arabidopsis. Plant. Cell Environ 39, 804–822 (2016). [DOI] [PubMed] [Google Scholar]
- 43.Oppermann UCT, Filling C & Jörnvall H Forms and functions of human SDR enzymes. Chem. Biol. Interact 130–132, 699–705 (2001). [DOI] [PubMed] [Google Scholar]
- 44.Kavanagh KL, Jörnvall H, Persson B & Oppermann U The SDR superfamily: functional and structural diversity within a family of metabolic and regulatory enzymes. Cell. Mol. Life Sci 65, 3895–3906 (2008). [DOI] [PMC free article] [PubMed] [Google Scholar]
- 45.Moummou H, Kallberg Y, Tonfack LB, Persson B & Van Der Rest B The plant short-chain dehydrogenase (SDR) superfamily: genome-wide inventory and diversification patterns. BMC Plant Biol. 12, 219–236 (2012). [DOI] [PMC free article] [PubMed] [Google Scholar]
- 46.Buysschaert G, Verstraete K, Savvides SN & Vergauwen B Structural and biochemical characterization of an atypical short-chain dehydrogenase/reductase reveals an unusual cofactor preference. FEBS J. 280, 1358–1370 (2013). [DOI] [PubMed] [Google Scholar]
- 47.Bollenbach TJ & Stern DB Divalent metal-dependent catalysis and cleavage specificity of CSP41, a chloroplast endoribonuclease belonging to the short chain dehydrogenase/reductase superfamily. Nucleic Acids Res. 31, 4317–4325 (2003). [DOI] [PMC free article] [PubMed] [Google Scholar]
- 48.Link S, Engelmann K, Meierhoff K & Westhoff P The Atypical Short-Chain Dehydrogenases HCF173 and HCF244 Are Jointly Involved in Translational Initiation of the psbA mRNA of Arabidopsis. Plant Physiol 160, 2202–2218 (2012). [DOI] [PMC free article] [PubMed] [Google Scholar]
- 49.Lamb HK et al. The negative transcriptional regulator NmrA discriminates between oxidized and reduced dinucleotides. J. Biol. Chem 278, 32107–32114 (2003). [DOI] [PubMed] [Google Scholar]
- 50.Andrianopoulos A, Kourambas S, Sharp JA, Davis MA & Hynes MJ Characterization of the Aspergillus nidulans nmrA gene involved in nitrogen metabolite repression. J. Bacteriol 180, 1973–1977 (1998). [DOI] [PMC free article] [PubMed] [Google Scholar]
- 51.Karpowicz SJ, Prochnik SE, Grossman AR & Merchant SS The GreenCut2 resource, a phylogenomically derived inventory of proteins specific to the plant lineage. J. Biol. Chem 286, 21427–21439 (2011). [DOI] [PMC free article] [PubMed] [Google Scholar]
- 52.Fristedt R Chloroplast function revealed through analysis of GreenCut2 genes. J. Exp. Bot 68, 2111–2120 (2017). [DOI] [PubMed] [Google Scholar]
- 53.Kallberg Y, Oppermann U, Jörnvall H & Persson B Short-chain dehydrogenases/reductases (SDRs). Coenzyme-based functional assignments in completed genomes. Eur. J. Biochem 269, 4409–4417 (2002). [DOI] [PubMed] [Google Scholar]
- 54.Ermakova-Gerdes S & Vermaas W Inactivation of the open reading frame slr0399 in Synechocystis sp. PCC 6803 functionally complements mutations near the QA niche of photosystem II. J. Biol. Chem 274, 30540–30549 (1999). [DOI] [PubMed] [Google Scholar]
- 55.Knoppová J et al. Discovery of a chlorophyll binding protein complex involved in the early steps of photosystem II assembly in Synechocystis. Plant Cell 26, 1200–1212 (2014). [DOI] [PMC free article] [PubMed] [Google Scholar]
- 56.Staleva H et al. Mechanism of photoprotection in the cyanobacterial ancestor of plant antenna proteins. Nat. Chem. Biol 11, 287–292 (2015). [DOI] [PubMed] [Google Scholar]
- 57.Komenda J & Sobotka R Cyanobacterial high-light-inducible proteins — protectors of chlorophyll – protein synthesis and assembly. Biochim. Biophys. Acta 1857, 288–295 (2016). [DOI] [PubMed] [Google Scholar]
- 58.Duc C, Sherstnev A, Cole C, Barton GJ & Simpson GG Transcription termination and chimeric RNA formation controlled by Arabidopsis thaliana FPA. PLoS Genet. 9, e1003867 (2013). [DOI] [PMC free article] [PubMed] [Google Scholar]
- 59.Brooks MD A Suppressor of Quenching Regulates Photosynthetic Light Harvesting. Dissertation (2012). [Google Scholar]
- 60.Lakshmi B, Mishra M, Srinivasan N & Archunan G Structure-based phylogenetic analysis of the lipocalin superfamily. PLoS One 10, e0135507 (2015). [DOI] [PMC free article] [PubMed] [Google Scholar]
- 61.Kirilovsky D & Kerfeld CA The orange carotenoid protein in photoprotection of photosystem II in cyanobacteria. Biochim. Biophys. Acta 1817, 158–166 (2012). [DOI] [PubMed] [Google Scholar]
- 62.Wilson A et al. A photoactive carotenoid protein acting as light intensity sensor. Proc. Natl. Acad. Sci. USA 105, 12075–12080 (2008). [DOI] [PMC free article] [PubMed] [Google Scholar]
- 63.Boulay C, Wilson A, D’Haene S & Kirilovsky D Identification of a protein required for recovery of full antenna capacity in OCP-related photoprotective mechanism in cyanobacteria. Proc. Natl. Acad. Sci. USA 107, 11620–11625 (2010). [DOI] [PMC free article] [PubMed] [Google Scholar]
- 64.Thurotte A et al. The cyanobacterial fluorescence recovery protein has two distinct activities: orange carotenoid protein amino acids involved in FRP interaction. Biochim. Biophys. Acta 1858, 308–317 (2017). [DOI] [PubMed] [Google Scholar]
- 65.Sutter M et al. Crystal structure of the FRP and identification of the active site for modulation of OCP-mediated photoprotection in cyanobacteria. Proc. Natl. Acad. Sci. USA 110, 10022–10027 (2013). [DOI] [PMC free article] [PubMed] [Google Scholar]
- 66.Wunder T et al. The major thylakoid protein kinases STN7 and STN8 revisited : effects of altered STN8 levels and regulatory specificities of the STN kinases. Front. Plant Sci 4, 1–15 (2013). [DOI] [PMC free article] [PubMed] [Google Scholar]
- 67.Bhullar S et al. Functional analysis of cauliflower mosaic virus 35S promoter: reevaluation of the role of subdomains B5, B4 and B2 in promoter activity. Plant Biotechnol. J 5, 696–708 (2007). [DOI] [PubMed] [Google Scholar]
- 68.Borello U, Ceccarelli E & Giuliano G Constitutive, light-responsive and circadian clock-responsive factors compete for the different I box elements in plant light-regulated promoters. Plant J. 4, 611–619 (1993). [DOI] [PubMed] [Google Scholar]
- 69.Glazebrook J, W. D Setting Up Arabidopsis Crosses. Cold Spring Harb. Protoc pdb.prot4623 (2006). doi: 10.1101/pdb.prot4623. [DOI] [PubMed] [Google Scholar]
- 70.Earley KW et al. Gateway-compatible vectors for plant functional genomics and proteomics. Plant J. 45, 616–629 (2006). [DOI] [PubMed] [Google Scholar]
- 71.Zhang X, Henriques R, Lin S-S, Niu Q-W & Chua N-H Agrobacterium-mediated transformation of Arabidopsis thaliana using the floral dip method. Nat. Protoc 1, 1–6 (2006). [DOI] [PubMed] [Google Scholar]
- 72.Iwai M et al. Light-harvesting complex Lhcb9 confers a green alga-type photosystem I supercomplex to the moss Physcomitrella patens. Nat. Plants 1, 1–7 (2015). [DOI] [PubMed] [Google Scholar]
- 73.Wittig I, Braun H & Scha H Blue native PAGE. (2006). doi: 10.1038/nprot.2006.62 [DOI] [PubMed]
- 74.Müller-Moulé P, Conklin PL & Niyogi KK Ascorbate deficiency can limit violaxanthin de-epoxidase activity in vivo. Plant Physiol. 128, 970–977 (2002). [DOI] [PMC free article] [PubMed] [Google Scholar]
- 75.Mcdonald KL Rapid embedding methods into epoxy and LR white resins for morphological and immunological analysis of cryofixed biological specimens. Microsc. Microanal 20, 152–163 (2014). [DOI] [PubMed] [Google Scholar]
- 76.Mitra PP & Loqué D Histochemical staining of Arabidopsis thaliana secondary cell wall elements. J. Vis. Exp 87, e51381 (2014). [DOI] [PMC free article] [PubMed] [Google Scholar]
Associated Data
This section collects any data citations, data availability statements, or supplementary materials included in this article.