

Abstract
Coronary and peripheral stents are implants that are inserted into blocked arteries to restore blood flow. After stent deployment, the denudation of the endothelial cell (EC) layer and the resulting inflammatory cascade can lead to restenosis, the renarrowing of the vessel wall due to the hyperproliferation and excessive matrix secretion of smooth muscle cells (SMCs). Despite advances in drug-eluting stents (DES), restenosis remains a clinical challenge and can require repeat revascularizations. In this study, we investigated how vascular cell phenotype can be modulated by nanotopographical cues on the stent surface, with the goal of developing an alternative strategy to DES for decreasing restenosis. We fabricated TiO2 nanotubes and demonstrated that this topography can decrease SMC surface coverage without affecting endothelialization. In addition, to our knowledge, this is the first study reporting that TiO2 nanotube topography dampens the response to inflammatory cytokine stimulation in both endothelial and smooth muscle cells. We observed that compared to flat titanium surfaces, nanotube surfaces attenuated tumor necrosis factor alpha (TNFα)-induced vascular cell adhesion molecule-1 (VCAM-1) expression in ECs by 1.8-fold and decreased TNFα-induced SMC growth by 42%. Further, we found that the resulting cellular phenotype is sensitive to changes in nanotube diameter and that 90 nm diameter nanotubes leads to the greatest magnitude in cell response compared to 30 or 50 nm nanotubes.
Keywords: nanotopography, restenosis, titanium oxide nanotubes, nanostructure, stent
Graphical Abstract
1. INTRODUCTION
Coronary stenting is a procedure for opening blocked arteries. Post-procedure, the renarrowing of the artery through restenosis is a persisting complication that requires repeat procedures.1 Restenosis is caused by injury to the vessel wall during stent deployment, which denudes the endothelium and triggers an inflammatory cascade, leading to the release of proinflammatory cytokines, chemokines, and the expression of adhesion molecules.2,3 Subsequently, the inflammation recruits smooth muscle cells (SMCs) to migrate to the vessel lumen, where the cells hyperproliferate and secrete excess extracellular matrix.4,5 This leads to the formation of the restenotic lesion, which renarrows the vessel and causes the failure of stents to maintain patency. Restenosis can present as recurrent angina or acute myocardial infarction in some patients and may require repeat revascularization.
Drug-eluting stents (DES) inhibit the proliferation of SMCs and decrease restenosis, thus reducing the risk for repeat vascularizations.6,7 However, they also inhibit endothelial cell (EC) function and delay endothelial healing, leading to an increased risk of thrombosis.8 Moreover, a meta-analysis of randomized clinical trials suggested that there is an increased mortality rate following application of paclitaxel-coated balloons and stents in patients with peripheral arterial disease.9 This study led the FDA to issue a warning letter to health care providers, cautioning them to weigh the relative risks and benefits of paclitaxel-coated stents and balloons for their patients. The risks of DES motivate the development of an alternative strategy to decrease restenosis in a safe and effective manner. The ideal stent surface would allow for rapid and functional reendothelialization and the suppression of SMC proliferation, in order to minimize the risks of restenosis and thrombosis.10
Nanomaterials have been widely explored as therapeutic agents for many biomedical applications, including drug delivery and regenerative medicine.11–17 In particular, nanoscale topographical cues have been engineered to modulate vascular cell adhesion and function for cardiovascular applications.18–21 Titanium, a common material used in medical devices and implants, can be patterned into vertically oriented, highly ordered nanotubes (NTs) through a simple process of electrochemical anodization.22 Studies have shown that TiO2 NT surfaces can promote bovine aortic EC adhesion and proliferation, while also downregulating murine vascular SMC proliferation.23 In an in vivo rabbit iliac artery model, titanium stents coated with 90 nm NTs led to a 17% decrease in restenosis rates as compared to flat titanium stents.24 This study demonstrated proof of concept that TiO2 NT coatings can decrease restenosis in vivo, but the mechanism through which TiO2 NTs decreases restenosis is not yet fully understood.
Therefore, we sought to investigate the effect of NT topography on primary human vascular cell phenotype on a cellular level, to explain the tissue-level responses observed in vivo. We cultured primary human coronary artery ECs and SMCs and quantified their relative coverage on the surface as well as their responses to inflammation. To our knowledge, this is the first study that quantifies the effect of TiO2 NT topography on the inflammatory responses in primary human vascular cells. We also investigated the cell–interface interactions by quantifying focal adhesion kinase (FAK) expression and phosphorylation. Last, we compared EC and SMC response to varying NT diameters, to determine whether cellular responses were dependent on the size and spacing of the surface features. The information revealed in this study can guide the design of new stent surfaces to decrease restenosis.
2. EXPERIMENTAL METHODS
2.1. TiO2 NT Anodization
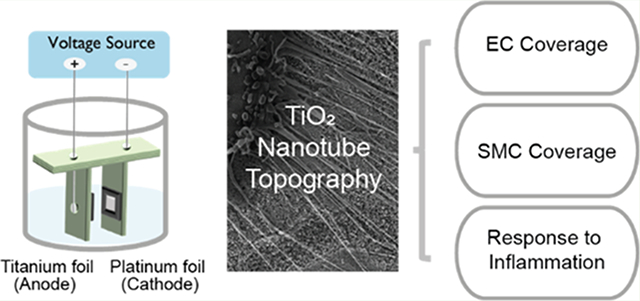
Titanium foil sheets (0.127 mm thickness, 99.7% trace metals basis), aluminum fluoride (ammonium fluoride, =99.99% trace metals basis), glycerol (ACS reagent, ≥99.5%), and ethylene glycol (ReagentPlus) were purchased from Sigma-Aldrich (Milwaukee, WI). Titanium foil sheets were cut into 2 cm × 2 cm squares and cleaned by sonication in a sequential bath of Micro-90 solution (International Products Corporation), 100% acetone, and 70% ethanol. To fabricate titanium NTs, the titanium foil and an equal-sized piece of platinum foil were secured in a custom-made, 3D-printed fixture (Figure 1A). The titanium and platinum foils were maintained parallel to each other and 19 mm apart. The foils were connected to electrodes using platinum wire, and the titanium foil served as the anode while the platinum foil served as the cathode. The foils in the fixture were submerged in an electrolyte solution, containing 90 wt % ethylene glycol, 9.1 wt % deionized (DI) water, and 0.9 wt % ammonium fluoride. An anodic voltage of 30 V was applied for 60 min in order to fabricate the titanium NT coating. The NT surfaces were then annealed in a furnace at 450 °C for 2 h and stored in a vacuum chamber until use.
Figure 1.

(A) Schematic of the electrochemical anodization of TiO2 NT coatings on titanium foil using a custom 3D printed fixture. (B) HIM images of flat and (C) NT90 surfaces. (D) AFM projections of flat and (E) NT90 surfaces. D = diameter; RMS = root mean squared roughness. Scale bar = 200 nm.
For fabricating 30 and 50 nm NTs (NT30 and NT50), the electrolyte solution was composed of 94.3 wt % glycerol, 4.3 wt % water, and 1.4 wt % ammonium fluoride. Figure S1 shows the optimization of anodization parameters for achieving the target NT diameters. A 10 or 15 V voltage was applied for 120 min for the NT30 and NT90 surfaces, respectively. To fabricate NT90* surfaces, the electrolyte solution was composed of 90.6 wt % glycerol, 8 wt % water, and 1.4 wt % ammonium fluoride. A voltage of 30 V was applied for 120 min. Following anodization, the foils were rinsed in DI water and then sonicated briefly in 70% ethanol to clean off the residual electrolyte solution. The foils were then annealed in a furnace at 350 °C for 1 h.
2.2. Helium Ion Microscopy
Anodized NT surfaces were imaged using a Zeiss helium ion microscope at the University of California Berkeley Biomolecular Nanotechnology Center (Berkeley, California). Foils were sputter coated with gold–palladium at 10 mA for 45 s prior to imaging.
Cells cultured for 2 days on 90 nm diameter NTs (NT90), and flat foils were fixed in glutaraldehyde SEM fixation buffer overnight (2.7% (v/v) glutaraldehyde, 0.1 M sodium cacodylate buffer) and then washed 3× with 0.1 M sodium cacodylate for 10 min each. The sample was then dehydrated in serial baths of 35, 50, 70, 85, 90, 95, and 100% ethanol, for at least 10 min each. The foils were then dried using a critical point dryer in 100% ethanol. The cells were sputter coated with the same settings as above and then imaged using helium ion microscopy (HIM).
2.3. Atomic Force Microscopy
Atomic force microscopy (AFM) was performed using a NanoWizard Ultra Speed A AFM in soft tapping mode, using a BudgetSensors All-In-One probe (BudgetSensors, Sofia, Bulgaria). Scans were performed in three different fields of view, and root mean squared roughness (RMS) values were calculated using the Gwyddion software (Czech Metrology Institute, Jihlava, Czechia).
2.4. Cell Culture and Cell Proliferation Assays
Primary human coronary artery ECs and primary human coronary artery SMCs were purchased from PromoCell (Heidelberg, Germany). SMCs were maintained in smooth muscle growth medium-2 (PromoCell), and ECs were maintained in EC growth medium-2 (PromoCell). ECs used for cell area measurements were cultured in EC growth medium-2 MV.
Cells were seeded onto NT90 or flat surfaces to measure the effect of surface topography on cell behavior. To measure cell proliferation, ECs were seeded on foils at 8000 cells/cm2 and cultured for 1, 2, or 3 days. SMCs were seeded on foils at 10,000 cells/cm2 and cultured for 1, 3, or 5 days. Cell numbers were quantified using a CyQUANT proliferation assay (Molecular Probes, Eugene, OR), using DNA content as a measurement of cell number. Experiments were performed in triplicate.
2.5. Cell Staining and Immunofluorescence
Cells were then fixed with 4% paraformaldehyde for 10 min at room temperature, washed three times with phosphate-buffered saline (PBS) for 5 min each, then permeabilized with 0.1% Triton X-100 for 5 min.
For immunofluorescence, fixed and permeabilized samples were blocked for 1 h at room temperature with 10% goat serum, then incubated with primary antibody overnight at 4 °C. Either antipaxillin [ab32084] (Abcam, Burlingame, CA) or anti-vinculin [V9131] (Thermo Fisher, Waltham, MA) antibodies were used to visualize focal adhesions. The antibodies were used at 1:250 and 1:400 dilutions, respectively. Cells were then washed and incubated with secondary antibodies for 30 min at room temperature. Cells were also counterstained with Alexa Fluor 488-tagged phalloidin (Invitrogen, Carlsbad, CA) at a 1:500 dilution and with DAPI at a 1:1000 dilution. Microscopy images were acquired using a Nikon 6D optical microscope (NIKON Instruments, Inc., Melville, NY) with 4–20× magnification. All image quantification was performed using ImageJ.
2.6. Cell Area Measurements
To measure cell area, EC and SMC were cultured for 24 h on NT90 or flat surfaces. The cells were fixed, permeabilized, and stained with phalloidin and DAPI as described previously. Cell area quantification was performed using ImageJ. The images were thresholded, then individual cells were selected and their areas were measured. Measurements were taken from at three foils per condition, with at least three fields of view measured per foil.
2.7. Quantitative Real-Time Polymerase Chain Reaction
To measure gene expression, the cells were cultured on NT90 or flat surfaces for 24 h. For ECs, the cells were then stimulated with 2 ng/mL of human tumor necrosis factor alpha (TNFα) for 4 h (R&D Systems, Minneapolis, MN). mRNA was extracted using the RNeasy Mini Kit (Qiagen, Hilden, Germany). Reverse transcription was performed using the iScript cDNA Synthesis Kit (Bio-Rad Laboratories, Hercules, CA). Quantitative polymerase chain reaction (qPCR) was performed using Fast SYBR Green Mastermix (Life Technologies, Grand Island, NY) and a Viia7 qPCR machine (Life Technologies, Carlsbad, CA). The relative transcript quantities were calculated using the ΔΔCt method and normalized to the housekeeping gene encoding RPL19. Custom-made DNA primers were purchased from Integrated DNA Technologies (Coralville, IA), and the sequences are shown in Table 1.
Table 1.
Primer Sequences Used for qPCR
| gene | primer sequence |
|---|---|
| RPL-19 | fwd: TCGCCTCTAGTGTCCTCCG |
| rev: GCGGGCCAAGGTGTTTTTC | |
| VCAM-1 | fwd: GGGAAGATGGTCGTGATCCTT |
| rev: TCTGGGGTGGTCTCGATTTTA | |
| CCL-2 | fwd: CAGCCAGATGCAATCAATGCC |
| rev: TGGAATCCTGAACCCACTTCT |
2.8. ELISA
Collagen production was measured using the Human Pro-Collagen I alpha 1 ELISA Kit (Abcam, Cambridge, UK). SMCs were cultured on NT90 or flat surfaces for 24 h. The conditioned media was collected to measure secreted pro-collagen I concentration, and the cell extract was collected to measure pro-collagen I concentration within the cells. Cell extracts were prepared using the extraction buffer and enhancer provided in the kit, following manufacturer instructions.
To measure monocyte chemoattractant protein-1 (MCP-1) secretion, SMCs were cultured on NT90 or flat surfaces for 24 h. Cells were treated with either 1 ng/mL of TNFα or an equal volume of PBS as a vehicle control. All cells were incubated for an additional 24 h. The conditioned media was then removed and MCP-1 concentration was measured using a Human CCL2/MCP-1 Quantikine ELISA Kit (R&D Systems) according to manufacturer instructions.
To measure FAK and phosphorylated FAK (pFAK) expression, SMCs or ECs were cultured on TiO2 NT and flat surfaces for 24 h. The foils were washed with PBS, and cells were lysed with cell extraction buffer (Invitrogen, Waltham, MA, USA) supplemented with Pierce Protease and Phosphatase Inhibitor Mini Tablets (Thermo Scientific, Waltham, MA, USA) for 10 min on ice. Cells were then scraped off the surface, transferred to centrifuge tubes, and spun down at 10,000 rpm for 10 min at 4 °C. The supernatant was removed and cell lysates were analyzed using the FAK (total) Human ELISA Kit and FAK (phospho) [pY397] Human ELISA Kit (Invitrogen, Waltham, MA, USA). The total FAK concentration was normalized to total protein concentration of the same sample, as measured using a BCA assay. The pFAK concentration was normalized to total FAK concentration of the same sample. Experiments were performed in triplicate or quadruplicate.
2.9. Statistical Analysis
All data are reported as mean ± standard deviation (SD). Statistical analysis was performed using GraphPad Prism 6 (San Diego, CA). Student’s t-tests were used to compare cell responses on flat versus NT90 surfaces. For the cell number assays performed at 3 time points, a multiple t-test was performed using the Holm–Sidak method for multiple comparisons correction.
For experiments comparing flat, NT30, NT50, and NT90 surfaces, one-way analysis of variance (ANOVA) was performed followed by Tukey’s method for multiple comparisons correction. For the cell number assays comparing cell numbers on these surfaces over multiple time points, a two-way ANOVA was performed, followed by Tukey’s method for multiple comparisons correction.
3. RESULTS
3.1. NT Surface Characterization and Cell Morphology
Helium ion microscopy (HIM) images revealed that TiO2 NT surfaces with 90 nm diameters (NT90) were successfully fabricated (Figure 1). The average NT diameter (Figure 1C) and RMS (Figure 1E) are reported.
Ridges can be observed on flat surfaces, likely due to draw marks formed during the process of casting the titanium sheets. AFM revealed that NT90 surfaces have greater roughness than the flat surfaces, with an RMS value of 55 nm as compared to 18 nm for flat (Figure 1). EC and SMC both adhere to the surfaces and can form cytoplasmic projections including filopodia on both the flat and NT90 surfaces (Figure 2).
Figure 2.

Representative HIM images of primary human coronary endothelial muscle cells on (A) flat (scale bar = 2 μm) and (B) NT90 surfaces (scale bar = 200 nm). Representative HIM images of primary human coronary SMCs on (C) flat (scale bar = 1 μm) and (D) NT90 surface (scale bar = 2 μm). Cells were fixed after 2 days of culture. Filopodia are indicated by white arrows.
3.2. NT Surface Decreases SMC Cell Coverage without Affecting EC Coverage
The cell number and cell area of ECs cultured on flat and NT90 surfaces were measured over the course of 3 days (Figure 3A,B). For both NT90 and flat surfaces, cell growth was negligible between days 1 and 2, before increasing after day 2. This delay may be due to the time needed for sufficient serum protein to adsorb onto the surface and allow for cell attachment and spreading. For ECs, the number of cells is about 1.5-fold greater on NT90 than flat surfaces after 1 day. By day 3, cell numbers were more similar between the two surfaces (Figure 3A). When we quantified EC spreading on NT90 surfaces, we found that the cell area decreased by about 40% on NT90 surfaces. We then quantified overall cell coverage by calculating the percent of the foil surface covered by EC cellular material to gauge the effect of NTs on endothelialization (Figure S2). We found that when accounting for both cell number and cell area, the overall cell coverage on flat and NT90 surfaces are similar over the course of 7 days (Figure S2.) Further, in confluent EC layers, we observed staining for circumferential actin bundles along cell–cell junctions on both flat and NT90 surfaces (Figure S4B,D,F,H). The accumulation of polymerized actin at cell–cell contacts have been shown to contribute to vascular endothelial-cadherin stabilization.34 Therefore, our results suggest that intact endothelial layers can be formed on both flat and NT90 surfaces. In summary, NT90 surfaces increase the number of ECs compared to flat surfaces but decrease the average cell area, leading to a similar extent of endothelialization as compared to flat titanium.
Figure 3.

EC and SMC cell coverage on flat and NT surfaces. (A) EC and (E) SMC cell numbers on flat and NT surfaces were measured using a CyQUANT assay, which quantifies DNA content in cell lysates. (B) EC and (F) SMC area were quantified using fluorescence microscopy and ImageJ. Representative images of (C,D) ECs and (G,H) SMCs cultured on flat and NT surfaces are shown. Green: phalloidin. Blue: DAPI. Scale bar: 150 μm.
The number of adherent SMCs on day 1 is similar on both flat and NT90 surfaces (Figure 3B). After 3 days, there is a trend of fewer SMCs on NT90 than flat surfaces. By day 5, there are 40% fewer SMCs on NT90 than flat surfaces (p < 0.05). In addition to the differences in cell number, we observed that SMCs are also approximately 40% smaller surface areas on NT90 as compared to flat surfaces (Figure 3C,D). This suggests that the cells are less spread on NT90 as compared to flat surfaces. For SMCs, the decrease in both cell number and cell area of SMCs on NT90 surfaces leads to a substantial decrease in overall SMC coverage (Figure 3G,H). In summary, we observe that NT90 surfaces can decrease SMC coverage without adversely affecting endothelialization.
3.3. NT Surfaces Decrease the Inflammatory Responses in Endothelial and Smooth Muscle Cells
Several cytokines are implicated in the development of restenosis, including MCP-1,25 IL-6,25,26 and TNFα.27 We chose TNFα as a model cytokine to simulate an inflammatory environment. We added TNFα to ECs and SMCs cultured on flat and NT90 surfaces to assess their reponses to inflammation.
To probe the effect of NT90 surfaces on the inflammatory response in ECs, we stimulated the cells with TNFα and then measured the gene expression of vascular cell adhesion molecule-1 (VCAM-1), which encodes an adhesion molecule that mediates immune cell binding and tissue inflammation.29 Increased levels of VCAM-1 expression are correlated with patients who develop restenosis.30,31 We used qPCR to measure the expression of VCAM-1 in ECs cultured on NT90 and flat surfaces and found that NT90 decreased the VCAM-1 expression by 1.8-fold (Figure 4A). This result suggests that NT90 has a protective effect against the stimulation of the inflammatory molecule TNFα on ECs. The decreased expression of adhesion molecules may dampen the inflammatory cascade and attenuate overall tissue inflammation in the area of stent deployment.
Figure 4.

Effect of NT topography on inflammatory response. (A) VCAM-1 gene expression in ECs. (B) SMC cell numbers when cultured on flat or NT90 surfaces in control media or under stimulation with 2 ng/mL TNFα, an inflammatory cytokine and known mitogen for SMCs. (C) MCP-1 secretion by SMCs cultured on flat or NT surfaces was measured in conditioned media using ELISA. Data are expressed as mean ± SD.
NT90 has a similar anti-inflammatory effect in SMCs stimulated with TNFα. This effect was seen in two ways: inflammation-induced cell growth and cytokine production. First, during the pathogenesis of restenosis, inflammatory cytokines induce the hyperproliferation of SMCs. TNFα is one of the mitogens that stimulates SMC proliferation.32,33 As expected, we observed that TNFα increases cell number on both flat and NT90 surfaces after 48 h, as compared to control media that does not contain TNFα. When cultured on flat surfaces, SMC numbers increased by 42% when stimulated with TNFα (Figure 4B). However, when cultured on NT90, SMC numbers increased by only 34%. In the presence of TNFα, there were 29% fewer SMCs on NT90 than those cultured on flat surfaces. These data indicate there is less inflammation-induced SMC proliferation when the cells are cultured on NT90 sufaces, and that NT90 may be protective against the mitogenic effects of TNFα.
Second, SMCs also respond to inflammation by producing their own cytokines, including MCP-1. We observed that the gene expression of CCL-2, the gene that encodes MCP-1, increased when SMCs were cultured on NT90 (Figure S3A). However, we that MCP-1 protein secretion decreased, which is potentially due to the decrease in the total cell number. Under standard media conditions, we observed that SMC cultured on NT90 secreted 39% less MCP-1 than those cultured on flat surfaces (Figure 4C). When stimulated with 1 ng/mL TNFα, SMCs secrete 18% less MCP-1 when cultured on NT90 (p = 0.055) (Figure S3B). These results indicate that NT surfaces can decrease SMC cytokine secretion, and may subsequently dampen the pathogenesis of restenosis by decreasing the inflammatory response of SMCs.
3.4. FAK Expression and Phosphorylation
Changes in FAK activity mediate numerous downstream signaling processes. Focal adhesions and the actin cytoskeleton in ECs cultured on flat and NT90 surfaces can be seen in Figure S4. We observed via vinculin staining that punctate focal adhesions can be formed on both flat and NT90 surfaces. We quantified FAK expression and phosphorylation via ELISA and found that ECs cultured on NT90 had a similar level of total FAK and pFAK protein levels as compared to flat surfaces (Figure 5A,B). This result suggests that FAK total expression and phosphorylation is not a mechanism that mediates the differences that we observe in EC behavior on NT90 surfaces.
Figure 5.

Total FAK and pFAK were quantified by ELISA using cell lysates from (A,B) ECs and (C,D) SMCs cultured on flat and NT90 surfaces. Total FAK concentration was normalized to the total protein content. The pFAK concentration was normalized to the total FAK concentration. Data are expressed as mean ± SD.
SMCs cultured on both flat and NT90 surfaces were also able to form punctate focal adhesions, as shown in Figure S4 with paxillin staining. We also observed a 5-fold decrease in total FAK expression, as quantified by ELISA, when the cells are cultured on NT90 (p < 0.001) (Figure 5C). Since NT surfaces have decreased available adhesive area compared to flat surfaces, this may have led to decreased focal adhesion formation. Interestingly, there was an increase in the ratio of pFAK on SMCs cultured on NT90 compared to those cultured on flat surfaces (Figure 5D). The increase in FAK phorphorylation could be a mechanism for the cells to compensate for traction forces lost due to the decrease in total FAK expression.
3.5. NT Effects on EC and SMC Response Is Diameter-Dependent
We fabricated TiO2 NTs with 30 and 50 nm diameters to investigate whether tuning TiO2 NT diameter has an effect on cell responses. To fabricate these smaller diameters, the electrolyte base was switched from ethylene glycol to glycerol, a more viscous liquid that changes the kinetics of the anodization process to result in different NT features. Anodization parameters including the electrolyte content and voltage were tuned to achieve these specified diameters, and the optimization of the parameters is shown in Figure S1. These surfaces were characterized using HIM and AFM as indicated above and representative images are shown (Figure 6).
Figure 6.

Fabrication and characterization of (A,C) NT30 and (B,D) NT50 surfaces. (A,B) HIM images and (C,D) AFM 3D-projections are shown. D = diameter; RMS = root mean squared roughness. Scale bar = 200 nm.
The number of ECs on all NT surfaces, regardless of diameter, was increased as compared to flat surfaces on day 1 (Figure 7A). All NT surfaces increased EC cell numbers over 3 days. For SMCs, all NT surfaces decreased SMC cell numbers compared to flat, but only NT90 led to a statistically significant decrease in cell number by day 5 (Figure 7C).
Figure 7.

Effect of varying NT diameter on EC and SMC response. Cell growth rates on flat and NT surfaces using (A) ECs and (D) SMCs. Significant values are represented as follows: x NT30; # NT50; *NT90. One symbol: p < 0.05; two symbols: p < 0.01. (B) Relative VCAM-1 mRNA expression in ECs cultured on flat and NT surfaces. Values are normalized to mRNA expression on flat surfaces. (C) SMC cell numbers cultured on flat and NT surfaces in control media and in media containing 2 ng/mL TNFα. (E) MCP-1 secretion by SMCs cultured on flat and NT surfaces. Note: data shown here for flat and NT90 surfaces are identical as those in previous figures. They are shown here as a reference for comparison purposes.
Next, we measured how response to inflammation changes with the NT diameter. All NT surfaces led to a decrease in VCAM-1 expression in ECs cultured with 2 ng/mL of TNFα (Figure 7B). Larger diameters led to increasingly greater reductions in VCAM-1 expression, with NT90 leading to the greatest reduction in adhesion molecule gene expression.
For SMCs under standard media conditions, all NT surfaces led to slight reductions in cell number as compared to flat, with the greatest magnitude of cell number reduction on NT90 (Figure 7D). These results agree with cell number results in Figure 4C. In the presence of 2 ng/mL TNFα, all NT surfaces led to decreased cell numbers as compared to flat surfaces.
When measuring SMC MCP-1 secretion, we observed that NT30 and NT50 led to similar levels of MCP-1 secretion as flat surfaces, and only NT90 led to a statistically significant decrease (p < 0.01) as compared to all other NT or flat surfaces (Figure 7E). These data demonstrate that NT90 led to the greatest reduction in anti-inflammation markers for both ECs and SMCs compared to flat and NT surfaces with smaller diameters.
We noted that NT surfaces with smaller diameters also had decreased overall surface roughness, possibly because the differences in the fabrication process led to different growth rates of the NTs on the surface. NT90 surfaces have an RMS of 58 nm, whereas NT30 and NT50 have a RMS of 24 and 29 nm respectively (Figures 1, 6). Therefore, we set out to change the roughness independently from the diameter to investigate whether roughness or diameter is the primary driving force behind these observed changes in cellular response. We fabricated NT90*, a NT surface with 90 nm diameter NTs (Figure S5A), but 33 nm RMS roughness (Figure S5B), which was more similar to the roughness of NT30 and NT50 surfaces. For SMCs cultured on NT90* surfaces, we obseved similar cell adhesion and cell areas compared to to those cultured on NT90 surfaces (Figure S5D,F). For ECs cultured on NT90* surfaces, we observed similar cell numbers as onNT90 (Figure S5C), but EC cell areas on NT90* was greater than on NT90, and more closely resembled cell areas of ECs cultured on flat surfaces (Figure S5E). This suggests that while roughness did not change SMC response, EC responses were affected by changes in surface roughness. When we then assayed the effect of NT90* on inflammatory responses in terms of EC VCAM-1 expression and cytokine-induced SMC growth, we found that NT90* did not have an anti-inflammatory response like NT90. In fact, there was no statistically significant difference in inflammation on NT90* surfaces as compared to flat surfaces (Figure S5G,H). Therefore, while a decrease in roughness in the NT90* surfaces may potentially improve EC surface coverage, the anti-inflammatory effects were diminished.
4. DISCUSSION
Tuning cell behavior on the stent surface using NT topography has several advantages: (1) the anodization process for patterning surfaces is simple and compatible with metallic substrates, (2) the surface topography can be modified without altering the bulk mechanical properties of the stent, and (3) it avoids the use of the toxic drugs commonly used in DES. In this study, we investigated how TiO2 NT topography can affect the responses of vascular endothelial and smooth muscle cells, with respect to their roles in restenosis. We quantified three major hallmarks of restenosis: EC coverage, SMC coverage, and inflammatory responses.
4.1. TiO2 NT Decrease SMC Coverage without Changing Endothelialization
When SMCs were cultured on NT surfaces, we found that cell numbers were 40% less on NT90 by day 5. We also found that cell area was 40% smaller on NT90. This results in an overall decrease in cell coverage when SMCs were cultured on NT surfaces. This result agrees with previous literature reporting that NT surfaces decrease mouse aortic vascular SMCs proliferation23 and decrease SMC coverage.35 A decrease in SMC coverage on the stent surface could lead to a decrease in restenosis in vivo.
For ECs, we found that NT surfaces resulted in a similar rate and extent of endothelialization compared to flat surfaces (Figure S2). While the cell number increased, the cell area decreased (Figure 3). Previous work has also shown that NT surfaces increase the human umbilical vein endothelial cell (HUVEC) number as compared to flat,35 which agrees with our results shown here. However, the study also shows that HUVEC cell spreading is not affected by NT surfaces, thus leading to an increase in total cell coverage attributed to the increase in cell number. The difference in our results may be due to different cell types used or due to distinctions in the fabrication of NT surfaces. In our study using primary human coronary artery ECs, we found that endothelialization was comparable on both NT90 and flat surfaces.
Because the restenotic lesion is composed of both cellular material and secreted matrix proteins, we also measured pro-collagen I secretion from SMCs. Collagen I is one of the major components of the restenotic lesion,39 and pro-collagen I is the un-crosslinked precursor to the crosslinked, insoluble collagen I. As shown in Figure S3C,D, SMCs cultured on flat and NT90 surfaces have similar pro-collagen I content per cell, as measured both internally in the cell lysate and externally in the conditioned media. This suggests that tissue-level changes in collagen I content would likely be driven by total cell number and not the level of production per cell.
4.2. Response to Inflammation
Inflammation plays a significant role in the development of restenosis.26,40,41 Therefore, we set out to assess how NT surfaces affect the responses of ECs and SMCs to the inflammatory cytokine TNFα, which is implicated in restenosis.27
Our data demonstrate that NT topography decreases the gene expression of VCAM-1 by 1.8-fold. VCAM-1 encodes adhesion molecules that contribute to the inflammation within the vessel wall. Their expression is induced by inflammation, and in turn, they increase EC activation and mediate immune cell binding and extravasation.28–31 In particular, VCAM-1’s role in restenosis has been previously reported, and its blockade can lead to decreased restenosis.42,43 For example, blocking VCAM-1 using monoclonal antibodies was demonstrated to reduce neointimal formation after periadventitial carotid artery injury in genetically hypercholesterolemic mice.42 In addition, siRNA inhibition of VCAM-1 reduced neointimal formation after surgical mechanical injury of the carotid artery in a rat model.43 Taken together, the decrease in VCAM-1 expression is likely a mechanism through which NT topography can decrease tissue-level inflammation and attenuate restenosis.
We also found that when SMCs are cultured on NT90, TNFα induced a smaller degree of hyperproliferation as compared to SMCs cultured on flat surfaces. This indicates that in an inflammatory environment, there is a significant decrease in SMC number when cells are cultured on NT90 surfaces. NT90 surfaces may act in concert with TNFα receptor signaling to attenuate SMC growth on the surface, because in the absence of TNFα, cell numbers on the two surface types are not statistically significantly different at the same time point.
NT90 also affects SMC response to inflammation by decreasing levels of MCP-1 produced. MCP-1 mediates monocyte recruitment and activation, which is a necessary contributor to restenosis.44 MCP-1 is produced by many cell types, including macrophages, ECs, fibroblasts, and SMCs. MCP-1 production is induced by other growth factors and cytokines, causing the cell to amplify the inflammatory cascade. We found that under both normal and inflammatory conditions, the total amount of secreted MCP-1 is lower on NT90 surfaces as compared to flat. The decreased numbers of SMC on NT surfaces likely contributes to the decrease in total MCP-1 concentration.
Our study indicates that TiO2 NTs can curb the inflammatory cascade surrounding restenosis in several ways: (1) decreasing EC expression of adhesion molecules, (2) decreasing SMC mitogenesis in response to inflammatory cytokines like TNFα, and (3) decreasing the production of inflammatory cytokines such as MCP-1 by SMC.
4.3. Effect of NT Surfaces on Focal Adhesion Expression and Phosphorylation
Cells sense mechanical signals via integrins, which physically engage the ECM and can become the nucleation points for focal contacts, and subsequently focal adhesions. Integrins also trigger intracellular signals that regulate the remodeling of the actin cytoskeleton and other downstream activities. FAK as well as Src, paxillin, and several other adaptor proteins are associated with integrins on the membrane45 and affect many physiological responses including proliferation, migration, and growth factor signaling.
We investigated how NT surfaces affect FAK expression and phosphorylation. For ECs, we found that NT90 surfaces do not cause a significant difference in FAK expression or levels of phosphorylation. However, because ECs do demonstrate different behavior on NT90 surfaces, as evidenced by smaller surface area, differences in cell numbers, and decreased VCAM-1 expression, we believe that the NT topography is regulating cell phenotype via a different mechanism. Some potential examples include the regulation of focal adhesion localization, composition of the plaque components, and focal adhesion size.36
In SMCs, NT topography led to decreased total FAK expression, but an increased ratio of FAK phorphorylation. Increased FAK expression is correlated with increased traction forces and cell spreading area,46,47 which agrees with our data illustrating that cells on flat surfaces, which had higher FAK expression, also had greater spreading area compared to NT90 surfaces. The decreased FAK expression could be explained by the decreased amount of available surface area on TiO2 NT surface because cells can only adhere to the walls of the tubes and not the void space in the middle of the NT. This means that there is less area for cells to attach and form focal adhesions. Despite the decrease in FAK protein expression, there is an increase in the ratio of FAK phosphorylation. This could be a compensatory mechanism through which the cells try to exert enough traction force despite the decreased total FAK expression. Further, there is a well-documented cross-talk between the growth factor receptor and integrin-mediated signaling in cells.48,49 The formation and phosphorylation of FAK is likely to affect growth factor signaling and other downstream cellular processes, which would contributes to the differences we observed in SMC response to TNFα stimulation when cultured on NT90 versus flat surfaces.
4.4. Vascular Cell Responses to TiO2 NTs Are Diameter-Dependent
The size, density, and regularity of nanotopographical features are factors that influence cell response.37,38,50,51,52 Cells attach to substrates via integrins and several studies have shown that ECM ligands and integrin spacing affect focal adhesion formation, growth factor signaling, proliferation, and more.36,50,53 The geometric constraints of the TiO2 NT surfaces affect the possible patterns of integrin clustering, focal adhesion activation, and subsequent downstream signaling events. Further, TiO2 NTs with varying diameters have been shown to exert different effects on cells. However, conflicting reports exist regarding the diameters that are optimal for eliciting the desired cellular response for a stent material.20,35 We tuned NT diameter to study how it affects cell–substrate interactions,ell growth and inflammation.
In terms of EC number, we found that there is no statistically significant difference in cell number amongst any of the TiO2 NT surfaces. These data suggest that while the presence of NTs has an effect on cell number, changing the NT size does not significantly affect EC cell adhesion and growth. For SMCs, the largest NTs, NT90, resulted in the greatest decrease in SMC cell number compared to flat and smaller diameter NT surfaces. One way that NT surfaces lead to differences in cell behavior is by changing the total amount of possible adhesive area, as well as the density of potential integrin binding locations. To study the effect of ligand density on cell behavior, Le Saux et al. fabricated surfaces with controlled RGD ligand density and size and measured the resulting EC adhesion and cell area.50 The study reported that with decreased RGD density, cell adhesion increased significantly until a certain threshold and then began to decrease. In our study, NT surfaces can be comparable to surfaces with decreased ligand density. We found that NT surfaces, like the surfaces with decreased ligand density, increased EC adhesion, agreeing with results of the aforementioned study. However, NTs decreased SMC number compared with flat surfaces. Thus, there likely exists an optimal range of ligand densities for cell adhesion, and this range varies depending on the cell type. We can take advantage of this differential cell response to engineer material surfaces to have cell-specific effects.
We also measured functional outputs in response to TiO2 NTs of varying diameters. In some cases, the presence of NTs of any diameter led to significant changes in cell behavior. For instance, SMC growth in response to TNFα stimulation was significantly decreased on all NT surfaces compared to flat titanium. In other cases, the response to diameter is a graded response. For example, increasing NT diameters led to greater decreases in VCAM-1 expression in ECs. Last, there are other cases in which only the largest NT90 surfaces had an effect on cell phenotype, while NT30 and NT50 cause no change compared to flat surfaces. This was the case of MCP-1 production in SMCs. Given these observations, there likely exists a threshold of ligand spacing and density that is necessary for eliciting a change in cell behavior. More importantly, this threshold is different depending on the cell type and the signaling pathways involved.
We also found that changing surface roughness independently of NT diameter led to changes in EC surface area but does not affect SMC area and cell number. NT90* surfaces with decreased surface roughness could potentially increase EC coverage by increasing EC spreading, but the surface had no the anti-inflammation effects. Thus, surface roughness is another important parameter to tune for modulating cell response. Our results show that NT90 surfaces are a promising combination of NT diameter and surface roughness to achieve an anti-restenotic phenotype in vascular endothelial and smooth muscle cells.
5. CONCLUSIONS
In this study, we fabricated TiO2 nanotubes with 90 nm diameters to investigate how NT nanotopography affects endothelial and smooth muscle cell response, with the goal of designing a surface coating for bare metal stents that can decrease restenosis. We observed that NT surfaces decreased SMC coverage by decreasing both cell adhesion and cell spreading area. In addition, we found significant reductions in the inflammatory responses of both cell types cultured on NTs compared to unmodified surfaces. TiO2 NT surfaces attenuated TNFα-induced SMC proliferation, as well as TNFα-induced EC adhesion molecule expression. NT90 surfaces also decrease SMC MCP-1 cytokine secretion. Further, we compared the 90 nm NTs with 30 and 50 nm NTs and found that 90 nm NTs led to the greatest decrease in SMC coverage and inflammatory response. Taken together, we show that TiO2 NT surface coatings on stents are a promising alternative to DES for decreasing restenosis.
Supplementary Material
ACKNOWLEDGMENTS
We thank Dr. Frances Allen at the UC Berkeley Biomolecular Nanotechnology Center for advice and assistance with HIM data acquisition. We thank the staff at the UC Berkeley Electron Microscope Laboratory for assistance with sample preparation. We gratefully acknowledge the use of the JPK Instruments AFM and supporting equipment at SF State. The JPK Instruments AFMs and supporting facilities were obtained under NSF MRI award # NSF MRI award #1626611. We would also like to thank Kayla Wolf and Katie Cabral for their scientific input and advice during this study.
Funding
We acknowledge the research support from the Alfred Mann Institute and the National Science Foundation Graduate Research Fellowship.
ABBREVIATIONS
- NT90
90 nm diameter nanotube surfaces
- NT30
30 nm diameter nanotube surfaces
- NT50
50 nm diameter nanotube surfaces
- NT90*
90 nm diameter nanotube surfaces with decreased root mean squared roughness
- SMC
smooth muscle cell
- EC
endothelial cell
- HIM
helium ion microscopy
- AFM
atomic force microscopy
- MCP-1
monocyte attractant protein-1
- FAK
focal adhesion kinase
- pFAK
phosphorylated focal adhesion kinase
- RMS
root mean squared roughness
- CCL-2
CC chemokine ligand 2 (the gene encoding MCP-1 protein)
Footnotes
The authors declare the following competing financial interest(s): TAD is a scientific advisor of Biothelium, Inc. which is developing pro-healing coatings for vascular applications.
ASSOCIATED CONTENT
Supporting Information
The Supporting Information is available free of charge at https://pubs.acs.org/doi/10.1021/acsbiomaterials.9b01475.
Optimization of anodization parameters to achieve controlled NT diameters; EC surface coverage on flat and NT90 surfaces over 7 days; effect of NT90 surfaces on CCL-2 expression and collagen I production in SMCs; focal adhesion staining of SMC and ECs on flat and NT90 surfaces; and effect of TiO2 NT surface roughness on EC and SMC phenotype (PDF)
Contributor Information
Yiqi Cao, UC San Francisco, San Francisco, California.
Tejal A. Desai, UC Berkeley—UCSF Graduate Group in Bioengineering, San Francisco, California
REFERENCES
- (1).Regan CP; Adam PJ; Madsen CS; Owens GK; Schofer J; Rau T; Schluter M; Mathey D; Radke P; Kastrati A; Owens G; Kocher O; Aikawa M; Weissberg P; Cary N; Shanahan C; Lindner V; Giachelli C; Schwartz S; Reidy M; Rutherford C; et al. Molecular Mechanisms of Decreased Smooth Muscle Differentiation Marker Expression after Vascular Injury. J. Clin. Invest 2000, 106, 1139–1147. [DOI] [PMC free article] [PubMed] [Google Scholar]
- (2).Dzau VJ; Braun-Dullaeus RC; Sedding DG Vascular Proliferation and Atherosclerosis: New Perspectives and Therapeutic Strategies. Nat. Med 2002, 8, 1249–1256. [DOI] [PubMed] [Google Scholar]
- (3).Cuneo A; Autieri M Expression and Function of Anti-Inflammatory Interleukins: The Other Side of the Vascular Response to Injury. Curr. Vasc. Pharmacol 2009, 7, 267–276. [DOI] [PMC free article] [PubMed] [Google Scholar]
- (4).Denes L; Entz L; Jancsik V Restenosis and Therapy. Int. J. Vasc. Med 2012, 2012, 406236. [DOI] [PMC free article] [PubMed] [Google Scholar]
- (5).Chung I.-M. o.; Gold HK; Schwartz SM; Ikari Y; Reidy MA; Wight TN Enhanced Extracellular Matrix Accumulation in Restenosis of Coronary Arteries after Stent Deployment. J. Am. Coll. Cardiol 2002, 40, 2072–2081. [DOI] [PubMed] [Google Scholar]
- (6).Kaiser C; Galatius S; Erne P; Eberli F; Alber H; Rickli H; Pedrazzini G; Hornig B; Bertel O; Bonetti P; De Servi S; Brunner-La Rocca H-P; Ricard I; Pfisterer M Drug-Eluting versus Bare-Metal Stents in Large Coronary Arteries. N. Engl. J. Med 2010, 363, 2310–2319. [DOI] [PubMed] [Google Scholar]
- (7).Sabate M; Cequier A; Iñiguez A; Serra A; Hernandez-Antolin R; Mainar V; Valgimigli M; Tespili M; den Heijer P; Bethencourt A; Vazquez N; Gómez-Hospital JA; Baz JA; Martin-Yuste V; van Geuns R-J; Alfonso F; Bordes P; Tebaldi M; Masotti M; Silvestro A; Backx B; Brugaletta S; van Es GA; Serruys PW Everolimus-Eluting Stent versus Bare-Metal Stent in ST-Segment Elevation Myocardial Infarction (EXAMINATION): 1 Year Results of a Randomised Controlled Trial. Lancet 2012, 380, 1482–1490. [DOI] [PubMed] [Google Scholar]
- (8).Nakazawa G; Finn AV; Joner M; Ladich E; Kutys R; Mont EK; Gold HK; Burke AP; Kolodgie FD; Virmani R Delayed Arterial Healing and Increased Late Stent Thrombosis at Culprit Sites after Drug-Eluting Stent Placement for Acute Myocardial Infarction Patients: An Autopsy Study. Circulation 2008, 118, 1138–1145. [DOI] [PubMed] [Google Scholar]
- (9).Katsanos K; Spiliopoulos S; Kitrou P; Krokidis M; Karnabatidis D Risk of Death Following Application of Paclitaxel-Coated Balloons and Stents in the Femoropopliteal Artery of the Leg: A Systematic Review and Meta-Analysis of Randomized Controlled Trials. J. Am. Heart Assoc 2018, 7, No. e011245. [DOI] [PMC free article] [PubMed] [Google Scholar]
- (10).Shuchman M Trading Restenosis for Thrombosis? New Questions about Drug-Eluting Stents. N. Engl. J. Med 2006, 355, 1949–1952. [DOI] [PubMed] [Google Scholar]
- (11).Kam KR; Walsh LA; Bock SM; Ollerenshaw JD; Ross RF; Desai TA The Effect of Nanotopography on Modulating Protein Adsorption and the Fibrotic Response. Tissue Eng., Part A 2014, 20, 130–138. [DOI] [PMC free article] [PubMed] [Google Scholar]
- (12).Walsh LA; Allen JL; Desai TA Nanotopography Applications in Drug Delivery. Expert Opin. Drug Delivery 2015, 12, 1823–1827. [DOI] [PMC free article] [PubMed] [Google Scholar]
- (13).Kim J; Schlesinger EB; Desai TA Nanostructured Materials for Ocular Delivery: Nanodesign for Enhanced Bioadhesion, Transepithelial Permeability and Sustained Delivery. Ther. Delivery 2015, 6, 1365–1376. [DOI] [PMC free article] [PubMed] [Google Scholar]
- (14).Uskoković V; Desai TA Nanoparticulate Drug Delivery Platforms for Advancing Bone Infection Therapies. Expert Opin. Drug Delivery 2014, 11, 1899–1912. [DOI] [PMC free article] [PubMed] [Google Scholar]
- (15).Zamecnik CR; Lowe MM; Patterson DM; Rosenblum MD; Desai TA Injectable Polymeric Cytokine-Binding Nanowires Are Effective Tissue-Specific Immunomodulators. ACS Nano 2017, 11, 11433–11440. [DOI] [PMC free article] [PubMed] [Google Scholar]
- (16).Zamecnik CR; Levy ES; Lowe MM; Zirak B; Rosenblum MD; Desai TA An Injectable Cytokine Trap for Local Treatment of Autoimmune Disease. Biomaterials 2020, 230, 119626. [DOI] [PMC free article] [PubMed] [Google Scholar]
- (17).Singh MK; Gracio J; LeDuc P; Goncalves PP; Marques PAAP; Gonçalves G; Marques F; Silva VS; Capela e Silva F; Reis J; Potes J; Sousa A Integrated Biomimetic Carbon Nanotube Composites for in Vivo Systems. Nanoscale 2010, 2, 2855. [DOI] [PubMed] [Google Scholar]
- (18).Miller DC; Thapa A; Haberstroh KM; Webster TJ Endothelial and Vascular Smooth Muscle Cell Function on Poly(Lactic-Co-Glycolic Acid) with Nano-Structured Surface Features. Biomaterials 2004, 25, 53–61. [DOI] [PubMed] [Google Scholar]
- (19).Chung T-W; Liu D-Z; Wang S-Y; Wang S-S Enhancement of the Growth of Human Endothelial Cells by Surface Roughness at Nanometer Scale. Biomaterials 2003, 24, 4655–4661. [DOI] [PubMed] [Google Scholar]
- (20).Park J; Bauer S; Schmuki P; von der Mark K Narrow Window in Nanoscale Dependent Activation of Endothelial Cell Growth and Differentiation on TiO2 Nanotube Surfaces. Nano Lett. 2009, 9, 3157–3164. [DOI] [PubMed] [Google Scholar]
- (21).Yim E; Reano R; Pang S; Yee A; Chen C; Leong K Nanopattern-Induced Changes in Morphology and Motility of Smooth Muscle Cells. Biomaterials 2005, 26, 5405–5413. [DOI] [PMC free article] [PubMed] [Google Scholar]
- (22).Roy P; Berger S; Schmuki P TiO2 Nanotubes: Synthesis and Applications. Angew. Chem., Int. Ed 2011, 50, 2904–2939. [DOI] [PubMed] [Google Scholar]
- (23).Peng L; Eltgroth ML; LaTempa TJ; Grimes CA; Desai TA The Effect of TiO2 Nanotubes on Endothelial Function and Smooth Muscle Proliferation. Biomaterials 2009, 30, 1268–1272. [DOI] [PubMed] [Google Scholar]
- (24).Nuhn H; Blanco CE; Desai TA Nanoengineered Stent Surface to Reduce In-Stent Restenosis in Vivo. ACS Appl. Mater. Interfaces 2017, 9, 19677–19686. [DOI] [PubMed] [Google Scholar]
- (25).Suzuki T; Kopia G; Hayashi S.-i.; Bailey LR; Llanos G; Wilensky R; Klugherz BD; Papandreou G; Narayan P; Leon MB; Yeung AC; Tio F; Tsao PS; Falotico R; Carter AJ Stent-Based Delivery of Sirolimus Reduces Neointimal Formation in a Porcine Coronary Model. Circulation 2001, 104, 1188–1193. [DOI] [PubMed] [Google Scholar]
- (26).Welt FGP; Rogers C Inflammation and Restenosis in the Stent Era. Arterioscler., Thromb., Vasc. Biol 2002, 22, 1769–1776. [DOI] [PubMed] [Google Scholar]
- (27).Monraats PS; Pires NMM; Schepers A; Agema WRP; Boesten LSM; de Vries MR; Zwinderman AH; de Maat MPM; Doevendans PAFM; de Winter RJ; Tio RA; Waltenberger J; ‘t Hart LM; Frants RR; Quax PHA; van Vlijmen BJM; Havekes LM; van der Laarse A; van der Wall EE; Jukema JW Tumor necrosis factor-α plays an important role in restenosis development. FASEB J. 2005, 19, 1998–2004. [DOI] [PubMed] [Google Scholar]
- (28).Lawson C; Wolf S ICAM-1 Signaling in Endothelial Cells. Pharmacol. Rep 2009, 61, 22–32. [DOI] [PubMed] [Google Scholar]
- (29).Cook-Mills JM; Marchese ME; Abdala-Valencia H Vascular Cell Adhesion Molecule-1 Expression and Signaling During Disease: Regulation by Reactive Oxygen Species and Antioxidants. Antioxid. Redox Signaling 2011, 15, 1607–1638. [DOI] [PMC free article] [PubMed] [Google Scholar]
- (30).Heider P; Wildgruber MG; Weiss W; Berger HJ; Henning EH; Wolf O Role of Adhesion Molecules in the Induction of Restenosis after Angioplasty in the Lower Limb. J. Vasc. Surg 2006, 43, 969–977. [DOI] [PubMed] [Google Scholar]
- (31).Bayata S; Arikan E; Yesil M; Postaci N; Tas A; Koseoglu M An important role for VCAM-1, but not for ICAM-1 in restenosis following coronary stent implantation. Anadolu Kardiyol. Derg./Anatolian J. Cardiol 2010, 10, 405–409. [DOI] [PubMed] [Google Scholar]
- (32).Choi S; Park M; Kim J; Park W; Kim S; Lee D-K; Hwang JY; Choe J; Won M-H; Ryoo S; Ha K-S; Kwon Y-G; Kim Y-M TNF-α elicits phenotypic and functional alterations of vascular smooth muscle cells by miR-155–5p-dependent down-regulation of cGMP-dependent kinase 1. J. Biol. Chem 2018, 293, 14812–14822. [DOI] [PMC free article] [PubMed] [Google Scholar]
- (33).Davis R; Pillai S; Lawrence N; Chellappan SP TNF-α-mediated proliferation of vascular smooth muscle cells involves Raf-1-mediated inactivation of Rb and transcription of E2F1-regulated genes. Cell Cycle 2012, 11, 109–118. [DOI] [PMC free article] [PubMed] [Google Scholar]
- (34).Noda K; Zhang J; Fukuhara S; Kunimoto S; Yoshimura M; Mochizuki N Vascular Endothelial-Cadherin Stabilizes at Cell-Cell Junctions by Anchoring to Circumferential Actin Bundles through α- and β-Catenins in Cyclic AMP-Epac-Rap1 Signal-activated Endothelial Cells. Mol. Biol. Cell 2010, 21, 584–596. [DOI] [PMC free article] [PubMed] [Google Scholar]
- (35).Zhong S; Luo R; Wang X; Tang L; Wu J; Wang J; Huang R; Sun H; Huang N Effects of Polydopamine Functionalized Titanium Dioxide Nanotubes on Endothelial Cell and Smooth Muscle Cell. Colloids Surf., B 2014, 116, 553–560. [DOI] [PubMed] [Google Scholar]
- (36).Cavalcanti-Adam EA; Volberg T; Micoulet A; Kessler H; Geiger B; Spatz JP Cell Spreading and Focal Adhesion Dynamics Are Regulated by Spacing of Integrin Ligands. Biophys. J 2007, 92, 2964–2974. [DOI] [PMC free article] [PubMed] [Google Scholar]
- (37).Yang W; Xi X; Shen X; Liu P; Hu Y; Cai K Titania Nanotubes Dimensions-Dependent Protein Adsorption and Its Effect on the Growth of Osteoblasts. J. Biomed. Mater. Res., Part A 2014, 102, 3598–3608. [DOI] [PubMed] [Google Scholar]
- (38).Yang W; Xi X; Ran Q; Liu P; Hu Y; Cai K Influence of the Titania Nanotubes Dimensions on Adsorption of Collagen: An Experimental and Computational Study. Mater. Sci. Eng., C 2014, 34, 410–416. [DOI] [PubMed] [Google Scholar]
- (39).Farb A; Kolodgie FD; Hwang J-Y; Burke AP; Tefera K; Weber DK; Wight TN; Virmani R Extracellular Matrix Changes in Stented Human Coronary Arteries. Circulation 2004, 110, 940–947. [DOI] [PubMed] [Google Scholar]
- (40).Kornowski R; Hong MK; Tio FO; Bramwell O; Wu H; Leon MB In-Stent Restenosis: Contributions of Inflammatory Responses and Arterial Injury to Neointimal Hyperplasia. J. Am. Coll. Cardiol 1998, 31, 224–230. [DOI] [PubMed] [Google Scholar]
- (41).Farb A; Sangiorgi G; Carter AJ; Walley VM; Edwards WD; Schwartz RS; Virmani R Pathology of Acute and Chronic Coronary Stenting in Humans. Circulation 1999, 99, 44–52. [DOI] [PubMed] [Google Scholar]
- (42).Oguchi S; Dimayuga P; Zhu J; Chyu K-Y; Yano J; Shah PK; Nilsson J; Cercek B Monoclonal Antibody Against Vascular Cell Adhesion Molecule-1 Inhibits Neointimal Formation After Periadventitial Carotid Artery Injury in Genetically Hypercholesterolemic Mice. Arterioscler., Thromb., Vasc. Biol 2000, 20, 1729–1736. [DOI] [PubMed] [Google Scholar]
- (43).Qu Y; Shi X; Zhang H; Sun W; Han S; Yu C; Li J VCAM-1 SiRNA Reduces Neointimal Formation after Surgical Mechanical Injury of the Rat Carotid Artery. J. Vasc. Surg 2009, 50, 1452–1458. [DOI] [PubMed] [Google Scholar]
- (44).Mori E; Komori K; Yamaoka T; Tanii M; Kataoka C; Takeshita A; Usui M; Egashira K; Sugimachi K Essential Role of Monocyte Chemoattractant Protein-1 in Development of Restenotic Changes (Neointimal Hyperplasia and Constrictive Remodeling) After Balloon Angioplasty in Hypercholesterolemic Rabbits. Circulation 2002, 105, 2905–2910. [DOI] [PubMed] [Google Scholar]
- (45).Bryant PW; Zheng Q; Pumiglia KM Focal Adhesion Kinase Is a Phospho-Regulated Repressor of Rac and Proliferation in Human Endothelial Cells. Biol. Open 2012, 1, 723–730. [DOI] [PMC free article] [PubMed] [Google Scholar]
- (46).Reinhart-King CA; Dembo M; Hammer DA Endothelial Cell Traction Forces on RGD-Derivatized Polyacrylamide Substrata. Langmuir 2003, 19, 1573–1579. [Google Scholar]
- (47).Tolić-Nørrelykke IM; Wang N Traction in Smooth Muscle Cells Varies with Cell Spreading. J. Biomech 2005, 38, 1405–1412. [DOI] [PubMed] [Google Scholar]
- (48).Wang F; Weaver VM; Petersen OW; Larabell CA; Dedhar S; Briand P; Lupu R; Bissell MJ Reciprocal Interactions between Beta1-Integrin and Epidermal Growth Factor Receptor in Three-Dimensional Basement Membrane Breast Cultures: A Different Perspective in Epithelial Biology. Proc. Natl. Acad. Sci. U.S.A 1998, 95, 14821–14826. [DOI] [PMC free article] [PubMed] [Google Scholar]
- (49).Mostafavi-Pour Z; Askari JA; Parkinson SJ; Parker PJ; Ng TTC; Humphries MJ Integrin-Specific Signaling Pathways Controlling Focal Adhesion Formation and Cell Migration. J. Cell Biol 2003, 161, 155. [DOI] [PMC free article] [PubMed] [Google Scholar]
- (50).Le Saux G; Magenau A; Gunaratnam K; Kilian KA; Böcking T; Gooding JJ; Gaus K Spacing of Integrin Ligands Influences Signal Transduction in Endothelial Cells. Biophys. J 2011, 101, 764–773. [DOI] [PMC free article] [PubMed] [Google Scholar]
- (51).Le Saux G; Magenau A; Böcking T; Gaus K; Gooding JJ The Relative Importance of Topography and RGD Ligand Density for Endothelial Cell Adhesion. PLoS One 2011, 6, No. e21869. [DOI] [PMC free article] [PubMed] [Google Scholar]
- (52).Chen W; Shao Y; Li X; Zhao G; Fu J Nanotopographical Surfaces for Stem Cell Fate Control: Engineering Mechanobiology from the Bottom. Nano Today 2014, 9, 759–784. [DOI] [PMC free article] [PubMed] [Google Scholar]
- (53).Arnold M; Cavalcanti-Adam EA; Glass R; Blümmel J; Eck W; Kantlehner M; Kessler H; Spatz JP Activation of Integrin Function by Nanopatterned Adhesive Interfaces. ChemPhysChem 2004, 5, 383–388. [DOI] [PubMed] [Google Scholar]
Associated Data
This section collects any data citations, data availability statements, or supplementary materials included in this article.