Abstract
Previous work has shown that hepatic levels of human glutathione transferase zeta 1 (GSTZ1) protein, involved in tyrosine catabolism and responsible for metabolism of the investigational drug dichloroacetate, increase in cytosol after birth before reaching a plateau around age 7. However, the mechanism regulating this change of expression is still unknown, and previous studies showed that GSTZ1 mRNA levels did not correlate with GSTZ1 protein expression. In this study, we addressed the hypothesis that microRNAs (miRNAs) could regulate expression of GSTZ1. We obtained liver samples from donors aged less than 1 year or older than 13 years and isolated total RNA for use in a microarray to identify miRNAs that were downregulated in the livers of adults compared with children. From a total of 2578 human miRNAs tested, 63 miRNAs were more than 2-fold down-regulated in adults, of which miR-376c-3p was predicted to bind to the 3′ untranslated region of GSTZ1 mRNA. There was an inverse correlation of miR-376c-3p and GSTZ1 protein expression in the liver samples. Using cell culture, we confirmed that miR-376c-3p could downregulate GSTZ1 protein expression. Our findings suggest that miR-376c-3p prevents production of GSTZ1 through inhibition of translation. These experiments further our understanding of GSTZ1 regulation. Furthermore, our array results provide a database resource for future studies on mechanisms regulating human hepatic developmental expression.
SIGNIFICANCE STATEMENT
Hepatic glutathione transferase zeta 1 (GSTZ1) is responsible for metabolism of the tyrosine catabolite maleylacetoacetate as well as the investigational drug dichloroacetate. Through examination of microRNA (miRNA) expression in liver from infants and adults and studies in cells, we showed that expression of GSTZ1 is controlled by miRNA. This finding has application to the dosing regimen of the drug dichloroacetate. The miRNA expression profiles are provided and will prove useful for future studies of drug-metabolizing enzymes in infants and adults.
Introduction
Glutathione transferase (GST) zeta 1 (GSTZ1), also known as maleylacetoacetate isomerase, is a primarily hepatic enzyme, present in cytosol and mitochondria, that is physiologically important in the tyrosine catabolism pathway (James et al., 2017). It is also the sole enzyme responsible for the metabolism of the experimental drug dichloroacetate (DCA), which has shown promise in the treatment of mitochondrial disorders, cancer, and pulmonary hypertension, among other diseases. Although humans are born with little to no hepatic GSTZ1 expression, its levels undergo an increase shortly after birth before plateauing around age 7 years in cytosol and 21 years in mitochondria (Li et al., 2012; Zhong et al., 2018). This age-related expression is clinically relevant, as dosage with DCA must be appropriate for the extent of GSTZ1-mediated metabolism [reviewed in James et al. (2017)]. To date, the regulatory mechanisms controlling GSTZ1 expression have gone undiscovered.
Across the proteome, protein expression is regulated at multiple stages [reviewed in Bina (2013)]. DNA and histone modifications determine the accessibility of genes. The expression levels, availability (i.e., the sequestration of the E2F transcription factor by retinoblastoma protein), and subcellular localization of transcription factors influence the rate at which mRNA is transcribed from an accessible gene. Posttranscriptional modifications to newly formed mRNA determine the rate at which it becomes suitable for translation, and alternative splicing modulates the distinct fate of the pre-mRNA. Even after translation, posttranslational modifications can have dramatic effects on the stability, and therefore observed expression levels, of proteins.
With the discovery of microRNAs (miRNAs) in the 1990s (Lee et al., 1993) and subsequent realization of their important role in gene regulatory mechanisms (Pasquinelli et al., 2000; Reinhart et al., 2000; Lagos-Quintana et al., 2001; Lau et al., 2001), an additional layer of regulation has become apparent. The mechanism of action of miRNAs has traditionally been thought of as the regulation of mRNA stability. In this pathway, binding of miRNA to complementary mRNA sequences leads to the recruitment of the RNA-induced silencing complex and degradation of the mRNA (Gurtan and Sharp, 2013). The subsequently lower mRNA levels result in lower protein expression.
Previous studies by our laboratory and others have failed to identify any transcriptional regulators or posttranslational modifications that would be expected to modulate stability of GTSZ1 (Ammini et al., 2003; Zhong et al., 2018). Additionally, there was no correlation between GSTZ1 mRNA levels and protein expression (Langaee et al., 2015). A possible explanation for this finding is related to a second function of miRNA. In addition to the canonical degradation pathway induced by miRNA binding, miRNAs also play an important role in gene regulation through the inhibition of translation (Gu and Kay, 2010; Dluzen and Lazarus, 2015). In this scenario, protein levels can be controlled without changing observed mRNA levels.
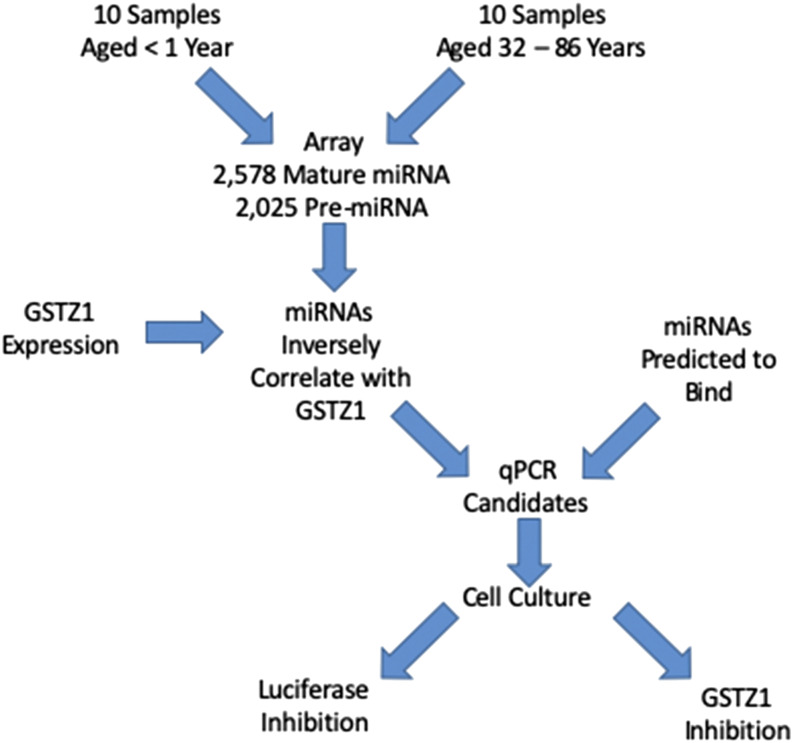
In the present study we tested the hypothesis that the differences in GSTZ1 enzyme expression that have been observed between young children and adults could be caused by differential expression of one or more miRNAs. We used a microarray to measure the expression of all known human miRNAs in liver from infants and adults and completed further studies on those that were downregulated in adults while also being predicted to bind to the GSTZ1 mRNA 3′ untranslated region (UTR). The experimental flowchart is presented in Fig. 1.
Fig. 1.
Flowchart showing the experimental design to identify and confirm miRNAs that regulate GSTZ1 protein expression.
Materials and Methods
Human Liver Samples.
Human liver samples were obtained under an exempt protocol that was approved by the University of Florida Institutional Review Board. Samples came from the University of Florida Clinical and Translational Science Institute Biorepository, the NIH Neurobiobank via the University of Maryland, and the Cooperative Human Tissue Network via Nationwide Children’s Hospital and the University of Alabama at Birmingham. Young samples were from 15 donors of both sexes aged 1–303 days (mean 69.1 ± 93.1), and adult samples were from 15 donors of both sexes aged 13–86 years (mean 53.2 ± 22.9).
Microarray Analysis.
Total RNA was isolated from a subset of the human liver samples comprising 10 young (range 1–303 days, mean 90.0 ± 108.1 days) and 10 adult (range 32–86 years, mean 62.4 ± 18.5 years) livers using the miRNeasy mini kit from Qiagen (Valencia, CA) according to the manufacturer’s instructions. A sample size of 10 in each age group would enable us to detect differences of 1.5-fold between groups with statistical power of 90% and P < 0.05. Previous studies showing 4-fold differences in expression of GSTZ1 protein between these age groups informed selection of this group size (Li et al., 2012; Zhong et al., 2018). The total RNA was delivered to the University of Florida Interdisciplinary Center for Biotechnology Research, where miRNA expression was determined using the GeneChip miRNA 4.0 array covering 2578 human mature miRNAs from ThermoFisher Scientific (Carlsbad, CA). The .CEL files that we received from the core facility were then analyzed using the Transcriptome Analysis Console 4.0 software from ThermoFisher Scientific. Specific filter settings are described in more detail in subsequent sections. In all cases, a filter of P ≤ 0.05 was applied.
Reverse-Transcription Quantitative Polymerase Chain Reaction Analysis.
Total RNA was isolated from all 30 human liver samples using the miRNeasy kit and then reverse transcribed using the miScript II RT kit. miScript primer assays for hsa-miR-376c-3p (MS00004046), hsa-miR-6738-5p (MS00046417), hsa-miR-23b-3p (MS00031647), and hsa-miR-152-3p (MS00003591) were then carried out in triplicate using Quantitect SYBR green on a QuantStudio 12K Flex Real-Time PCR System (ThermoFisher). All reagents were from Qiagen. ΔCt values were calculated for miR-376c-3p and miR-6738-5p by subtracting the geometric mean Ct value obtained from miR-23b-3p and miR-152-3p from the Ct value of the miRNA of interest (Lamba et al., 2014).
Generation of Stable Cell Lines.
The 293T and MDA-MB-231 cell lines were grown in high glucose Dulbecco’s modified Eagle’s medium + 10% FBS, and the HepG2 cell line was grown in low glucose Dulbecco’s modified Eagle’s medium + 10% FBS because high concentrations of glucose induce apoptosis in this cell line (Chandrasekaran et al., 2010). A lentiviral system was used to generate stable cell lines by transfecting 293T cells with the viral packaging plasmids PMD2.G and PsPax2 (Addgene, Cambridge, MA) along with the lentiviral vector pEZX-MR03 containing either a scrambled miRNA negative control or miR-376c-3p (Genecopoeia, Rockville, MD). The lentivirus that was produced was then used to transduce the MDA-MB-231 and HepG2 cell lines. All infected cell lines were then selected using puromycin from ThermoFisher Scientific.
Luciferase Assay.
The pGL3 firefly luciferase plasmid was modified to contain nucleotides 1016–1282 of hGSTZ1 mRNA, which is part of the 3′-UTR (Fang et al., 2006). Forward (5′-gccgtgtaattctagaTTGAGGAGATGGGAGACTCG-3′) and reverse (5′- gctcgaagcggccggccTGGAGTCACACACAACAAAAG-3′) primers were amplified from genomic DNA obtained from the BCBL-1 human cell line. The amplicon was further amplified with Phusion High-Fidelity DNA Polymerase (New England Biolabs, Ipswich, MA) and inserted into the pGL3 plasmid that had been linearized by Xho1 and FseI (New England Biolabs) using the Geneart Seamless Cloning and Assembly kit (ThermoFisher Scientific).
293T cell lines stably expressing either a negative control scrambled miRNA or miR-376c-3p were plated at 130,000 cells per well of a 24-well plate. The next day, the cells were transfected using lipofectamine 2000 (ThermoFisher Scientific) to introduce the pGL3-GSTZ1 3′-UTR plasmid along with a plasmid EF1α Renilla luciferase–expressing plasmid as a transfection control. The following morning, the cells were refed and then processed after an additional 24 hours had passed. Lysates were generated and analyzed using the Dual-Luciferase Reporter Assay System (Promega, Madison, WI). All transfections were done in quadruplicate, and firefly luciferase expression was normalized to Renilla luciferase expression.
Immunoblot Analysis.
Samples of liver, 100 mg, were homogenized in four volumes of 1.15% KCl/0.05 M potassium phosphate buffer pH 7.4 and centrifuged at 600g to sediment nuclei and unbroken cells. Western blots and subsequent immunoblots were carried out as described previously (Li et al., 2011). The primary antibody was a custom polyclonal product produced by Cocalico Biologicals (Stevens, PA) and raised in rabbits against whole, purified recombinant human GSTZ1C. The peroxidase-linked secondary antibody was purchased from Sigma Aldrich (St. Louis, MO). Wells of the sodium dodecyl sulfate-polyacrylamide gels were loaded with 30 µg of total protein from the 600g supernatant of each sample. After transfer, the Western blot was normalized using total protein loading as determined by staining with Ponceau dye (ThermoFisher Scientific). Blots were quantified using a Chemidoc (Biorad, Hercules, CA) and ImageJ software from the National Institutes of Health.
Statistical Analysis.
Student’s t tests and Pearson correlation coefficients were calculated using GraphPad Prism software (version 6.07; GraphPad Software, San Diego, CA).
Results
miRNA Expression Is Associated with Age.
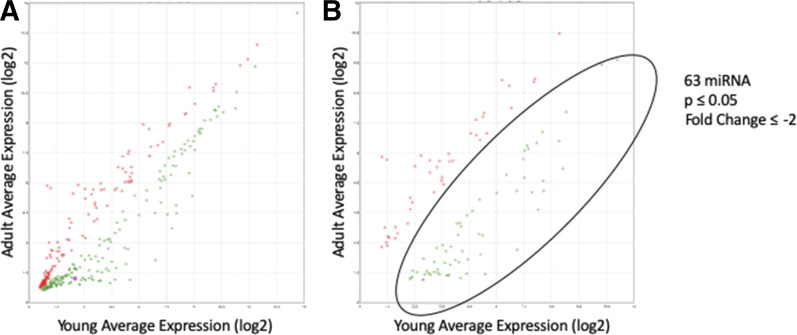
We previously showed that hepatic GSTZ1 expression is higher in adults than in children (Li et al., 2012; Zhong et al., 2018). To test our hypothesis that this change in expression is due to differential miRNA expression, we obtained liver samples from young (<1 year old) and adult donors. Microarray analysis of total RNA from 10 samples of each group, 20 samples total, yielded data showing the relative expression of 2578 miRNAs in these age groups. In total, 378 miRNAs were differentially regulated (P ≤ 0.05, Fig. 2A), with 104 miRNAs showing at least a 2-fold change in expression (Fig. 2B). Of these, 63 were downregulated, whereas 41 were upregulated in the adults. A list of these miRNAs is found in Supplemental Table 1. The values presented were calculated by the Transcriptome Analysis Console 4.0 software.
Fig. 2.
miRNA microarray results comparing expression in liver from young and adult populations. (A) miRNAs that showed statistically significant expression differences between the age groups (P ≤ 0.05). Each dot represents one miRNA. An miRNA expressed equally in both populations would fall directly on the y = x line. (B) miRNAs that showed a statistically significant change with a fold change of ≥2 or ≤ −2. The circled area contains 63 miRNAs that represented miRNAs of potential interest in the regulation of GSTZ1.
Identification of Candidate miRNAs Regulating GSTZ1.
Since GSTZ1 protein expression is higher in adults, an miRNA regulating its expression would be expected to be lower in this same group. Therefore, we focused our attention on the 63 miRNAs that showed at least a 2-fold decrease in expression and had P ≤ 0.05. Comparing this list to miRNAs predicted to bind to the GSTZ1 3′-UTR by the miRanda (John et al., 2004) or Targetscan (Lewis et al., 2005) algorithms, or that were found associated with GSTZ1 in the Tarbase 8.0 database (Karagkouni et al., 2018), yielded two candidate miRNAs: hsa-miR-376c-3p (previously known as miR-368) and hsa-miR-6738-5p. The list of downregulated miRNAs, together with those from the miRanda, Targetscan, and Tarbase databases, is in Supplemental Table 2.
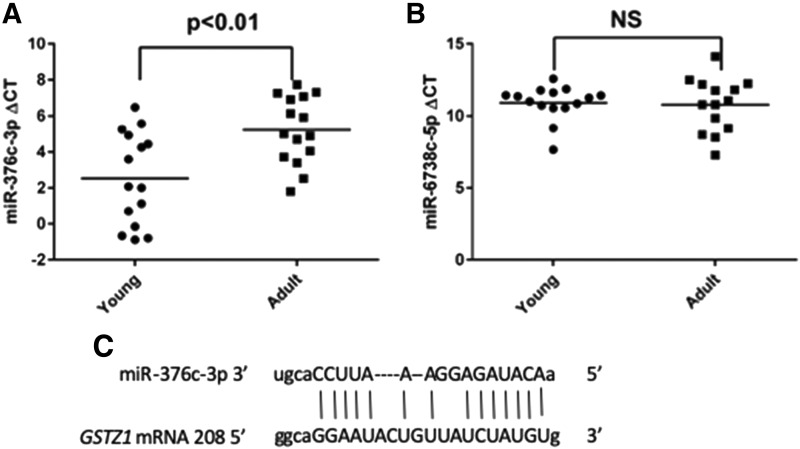
To verify the downregulation of these miRNAs in adults compared with children, we measured the expression of miR-376c-3p and miR-6738-5p using reverse-transcription (RT) quantitative polymerase chain reaction (qPCR) in the livers that were used for the microarray analysis, plus five additional young samples and five additional adult samples providing 15 samples for each age group. Basic demographic information for all samples can be found in Supplemental Table 3. Ct values for these miRNAs were compared with those obtained for miR-23b-3p and miR-152-3p, which have been shown to be suitable loading controls for analysis of miRNAs in the liver (Lamba et al., 2014). High ΔCt values represent low miRNA expression, and ΔCt values were significantly higher (P < 0.005, n = 15) in the adults, with mean values of 2.53 ± 2.56 and 5.23 ± 2.18 in the young and adult groups, respectively (Fig. 3A). miR-6738-5p showed Ct values in the low- to mid- thirties, indicating very low expression (Fig. 3B). Additionally, there was no difference seen between the age groups. We therefore determined that the differential expression seen for miR-6738-5p in the array was most likely a false positive with an unknown cause. The predicted complementarity between the GSTZ1 mRNA and miR-376c-3p is shown in Fig. 3C, beginning with nucleotide 208 of the GSTZ1 3′-UTR.
Fig. 3.
qPCR confirmation of array results for miR-376c-5p (A) and miR-6738-5p (B). Total RNA from young and adult livers was analyzed with RT-qPCR to identify expression levels of the indicated miRNA. Statistical differences were determined by Student’s t test, n = 15 in each group. (C) illustration of the binding of miR-376c-3p to the mRNA of GSTZ1.
miR-376c-3p Expression Correlates with GSTZ1 Protein Expression.
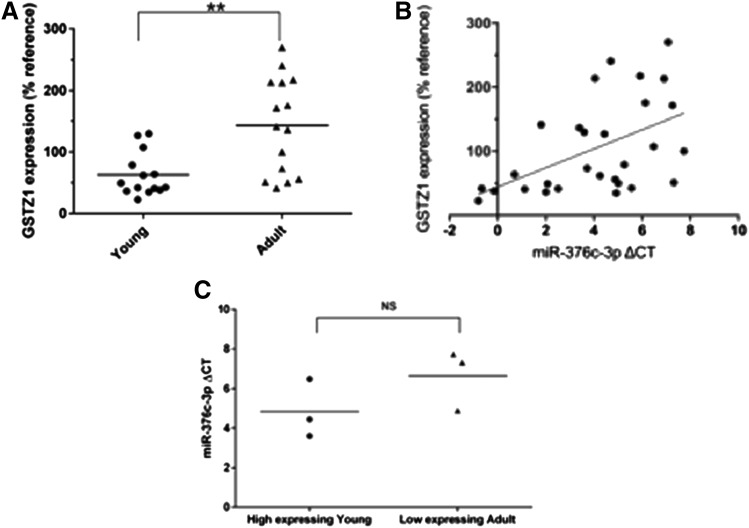
Whereas we have previously shown a large increase in GSTZ1 protein expression in adults compared with children, we sought to confirm that this difference was also present in the samples used in this study. Immunoblots to GSTZ1 were carried out on 600g supernatants of homogenates of these livers. GSTZ1 expression was then quantified using densitometry, and relative expression was calculated compared with a reference sample that was included on all blots. As expected, GSTZ1 protein expression was significantly higher in the adults (P < 0.01), with relative expressions of 62.4% ± 35.2% (n = 14) and 143% ± 77.8% (n = 15) in the young and adult groups, respectively (Fig. 4A). Generation of a scatterplot with miR-376c-3p ΔCt values and GSTZ1 protein expression in individual liver samples shows a direct correlation (Fig. 4B). A Pearson correlation coefficient analysis yielded r = 0.505 and P < 0.01.
Fig. 4.
Correlation of GSTZ1 protein expression with miR-376c-3p. (A) Relative expression of GSTZ1 protein, as determined by densitometry of Western blots, in livers from young and adult populations. Protein levels are expressed as a percentage compared with a single sample that was used as a reference on all blots. ** indicates a significant difference between groups, P < 0.01 as determined by Student’s t test, n = 14 in young and n = 15 in adult. (B) Scatterplot showing a direct correlation between GSTZ1 protein expression and miR-376c-3p ΔCt (and therefore an inverse correlation with miR-376c-3p expression). Each point represents one liver sample. (C) Comparison of miR-376-3p ΔCt values from the three young samples with the highest expression of GSTZ1 and three low-expressing adults revealed no difference.
There was overlap in GSTZ1 protein expression in samples from infants and adults. The GSTZ1 protein expression in the highest expressing young samples were similar to the lowest expressing adult samples. Comparison of ΔCt values measuring miR-376c-3p expression in these samples showed no difference between age groups (Fig. 4C).
miR-376c-3p Inhibits Protein Expression.
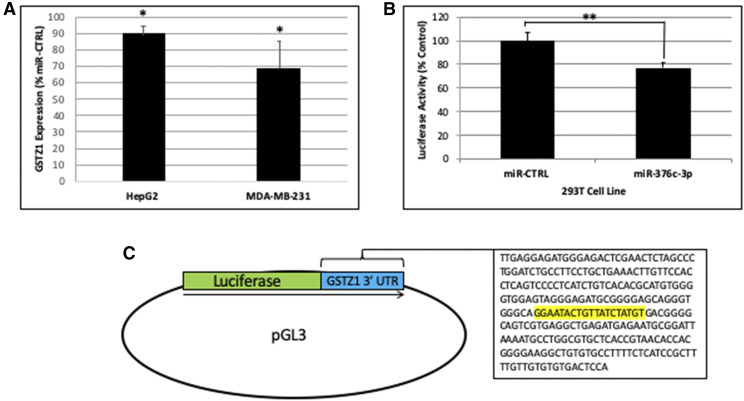
To show that miR-376c-3p can directly inhibit GSTZ1 protein expression, we used cell culture models. HepG2 (hepatocellular carcinoma) and MDA-MB-231 (breast cancer) cell lines, both of which express a small amount of GSTZ1 endogenously, were engineered to express either a scrambled negative control miRNA (miR-CTRL) or miR-376c-3p. Immunoblots of lysates obtained from these cell lines showed that the HepG2 cells expressing exogenous miR-376c-3p had approximately 90% as much GSTZ1 protein as did the cells expressing miR-CTRL (Fig. 5A, n = 3). The MDA-MB-231 cell line with exogenous miR-376c-3p showed a greater decrease, to below 60% of the cell line expressing miR-CTRL. The changes in both the HepG2 and MDA-MB-231 cell lines were significant, P < 0.05.
Fig. 5.
Regulation of GSTZ1 protein expression by miR-376c-3p (A) GSTZ1 protein expression in the indicated cell lines stably expressing transgenic miR-376c-3p. Values are expressed as a percentage of the GSTZ1 protein in a sister cell line expressing miR-CTRL derived from the same parental cells. N = 3 for each cell line. (B) Luciferase activity in 293T cells expressing miR-CTRL or miR-376c-3p stably and luciferase containing the 3′-UTR of GSTZ1 transiently. miR-CTRL was defined as 100% expression. N = 4 replicates for each cell line. (C) Scheme showing the construction of the luciferase plasmid. Into the pGL3 plasmid was inserted the luciferase coding sequence followed immediately by a portion of the GSTZ1 3′-UTR containing the predicted binding region for miR-376c-3p (highlighted). In all panels, values represent the mean of replicate measurements, error bars represent the S.D., *P < 0.05; P < 0.01, as determined by Student’s t test.
We also showed that miR-376c-3p could inhibit the expression of firefly luciferase that had been modified such that its mRNA contained a portion of the 3′-UTR from GSTZ1. 293T cell lines expressing either miR-CTRL or miR-376-3p were transfected with the firefly luciferase along with a second plasmid containing Renilla luciferase as a transfection control. The cell line expressing miR-376c-3p had roughly 75% the level of firefly luciferase expression when compared with the cell line expressing miR-CTRL (Fig. 5B, n = 4). A diagram showing the construction of the firefly luciferase reporter plasmid is shown in Fig. 5C.
Several Drug Metabolizing Enzymes are Targeted by miRNAs Differentially Regulated with Age.
A number of drug metabolizing enzymes are differentially regulated with age (Hines, 2008), but the mechanisms controlling such changes are currently not fully understood. To use our data more fully, we sought to identify which of these enzymes might be controlled by miRNAs. To do so, we used the results of our miRNA array to identify all miRNAs that were significantly up- or downregulated between the age groups (P < 0.05, fold change >2). This yielded 65 miRNAs that were expressed to a lesser degree in the adult group and 39 that showed higher expression in the adults.
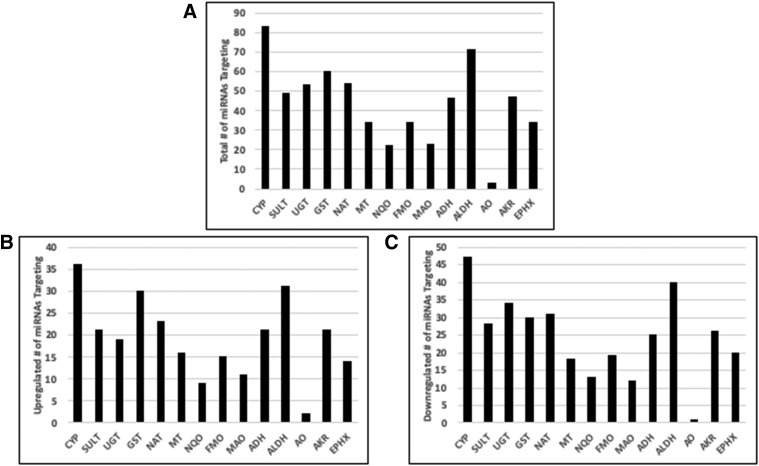
We made a list of all predicted target mRNAs for these miRNAs using the TargetScan and miRDB (Wang, 2016) prediction algorithms. This procedure allowed us to search this list for families of drug metabolizing enzymes that are potentially targeted by miRNAs that are differentially regulated with age. Figure 6A shows families of enzymes and the total number of differentially regulated miRNAs that were predicted to bind their target mRNA. Figure 6, B and C shows how many of that total number were upregulated and how many were downregulated.
Fig. 6.
miRNAs targeting several drug metabolizing enzymes are differentially expressed in young and adult populations. (A) The total number of miRNAs that were differentially regulated (P < 0.05, fold change ≥2 or ≤ −2) that were predicted to bind to any member of the indicated enzyme family. ADH, alcohol dehydrogenase; AKR, aldo-keto reductase; ALDH, aldehyde dehydrogenase; AO, aldehyde oxidase; CYP, cytochrome P450; EPHX, epoxide hydrolase; GST, glutathione transferase; MAO, monoamine oxidase; MT, methyl transferase; NAT, N-acetyltransferase; NQO, NAD(P)H quinone oxidoreductase; SULT, sulfotransferase. (B and C) show the number of miRNAs from the total that are up- or downregulated, respectively.
We then identified individual genes that had a differential of at least five between the targeting miRNAs that were up- and downregulated (i.e., six upregulated and one downregulated or two upregulated and seven downregulated) (Table 1), as we considered these genes most likely to be influenced by the changes in miRNA expression. Interestingly, this list of 28 genes contains six whose expression is known to be higher in adults than in children and showed a downregulation in miRNAs predicted to target them, giving a potential mechanism for the expression changes. These were CYP2B6 (Croom et al., 2009), GSTM (Strange et al., 1989), FMO3 (Dolphin et al., 1996) and UDP-glucuronosyltransferase (UGT) 1A1, 1A6, and 1A9 (Bhatt et al., 2019).
TABLE 1.
Gene candidates for miRNA regulation.
These genes showed a large differential (≥5, ≤ −5) in miRNAs predicted to target their mRNA and that are up- or downregulated in adult populations vs. young. This differential was calculated by subtracting the number of downregulated miRNA from the upregulated miRNA. A positive number would predict downregulated protein in adults, whereas a negative number would predict upregulated protein.
| Gene | miRNA Differential | Gene | miRNA Differential |
|---|---|---|---|
| CYP2B6 | −7 | CYP3A4 | 5 |
| CYP2S1 | −5 | CYP3A5 | 8 |
| CYP2U1 | −5 | CYP51A1 | 5 |
| CYP4F12 | −5 | GSTM4 | 10 |
| CYP4F22 | −6 | GSTO1 | 6 |
| FMO3 | −5 | SULT2A1 | 5 |
| GSTA2 | −5 | ||
| GSTM5 | −5 | ||
| GSTO2 | −9 | ||
| GSTT2 | −5 | ||
| mGST1 | −6 | ||
| UGT1A1, UGT1A3, UGT1A4, UGT1A6, UGT1A7 | −5 | ||
| UGT1A5, UGT1A8, UGT1A9, UGT1A10 | −6 |
Discussion
The hepatic expression of many drug metabolizing enzymes changes with age, but the mechanism by which these changes occur is often unknown, reviewed in Hines (2008). GSTZ1, the sole enzyme responsible for the metabolism of the investigational drug DCA, falls into this category. Although its increase in expression over the early years of life has been well characterized (Li et al., 2012; Zhong et al., 2018), efforts to identify mechanisms controlling its expression had been unsuccessful.
In this study we have demonstrated for the first time that an endogenous process is capable of modulating levels of GSTZ1 protein. Using an array containing all known human mature miRNAs, we identified 63 miRNAs that are downregulated in liver samples from adults compared with very young children. By comparing this list to those miRNAs predicted to bind to the 3′-UTR of GSTZ1 mRNA, we identified two potential miRNA regulators of GSTZ1.
RT-qPCR confirmed that miR-376c-3p expression decreased with age, and a significant correlation was found between miR-376c-3p and GSTZ1 protein expression in our samples. Cell culture experiments showed that introduction of miR-376c-3p caused a decrease in GSTZ1 expression. These data indicate that declining miR-376c-3p expression during the human maturation process likely results in increasing GSTZ1 protein levels. These experiments were carried out using HepG2, MDA-MB-231, and 293T cells. We believe that these are appropriate models since the cell culture experiments were intended as proof-of-principle experiments. The cells provided a vehicle for miRNA to bind either endogenous GSTZ1 mRNA or exogenous luciferase mRNA. Use of primary hepatocytes, or intact liver, would potentially provide more contextual data but would also introduce experimental complications that would make these experiments impractical.
In addition to GSTZ1’s role in the metabolism of DCA, it is also a critical enzyme in the tyrosine-catabolism pathway, where it is known as maleylacetoacetate isomerase. Although it is possible that increasing GSTZ1 expression is an evolutionary response to altered tyrosine consumption with age, it is also possible that the increase is simply a bystander effect. Since each miRNA regulates many mRNAs, if miR-376c-3p expression changes with age to change the expression of another gene, it would also affect the expression of GSTZ1. There is experimental evidence of miR-376c-3p interacting with 325 other mRNAs (Paraskevopoulou et al., 2016); therefore, elucidating the primary target(s) will require substantial future work.
Just as each miRNA regulates many mRNAs, many mRNAs are bound and controlled by multiple miRNAs. Although we showed that miR-376c-3p decreases GSTZ1 protein expression, the decreases seen in our cell culture studies were not as large as the changes seen with age in human liver. We identified miR-376c-3p due to its large expression change, but it is possible that other miRNAs, showing less than a 2-fold decrease with age, work in concert to regulate GSTZ1. Figure 7 shows the 3′-UTR binding locations of five miRNAs that were shown by our array to be downregulated (P < 0.05), regardless of the magnitude of the decrease. Due to the relatively small decreases in expression seen for the other miRNAs, there are likely other unknown factors that will need to be identified in future studies.
Fig. 7.
Binding of miRNAs to the GSTZ1 3′-UTR. 3′-UTR binding location of all miRNAs that showed a statistically significant downregulation (P < 0.05) in the adult population, regardless of fold change. The fold change (i.e., −1.14×) for each, along with its exact binding site (i.e., n. 47–69) are given for each.
Although the 3′-UTR of GSTZ1 has not been sequenced in a large number of samples, it is important to note that the predicted binding between all miRNAs discussed in this paper and the 3′-UTR are based off reference sequences. It is unknown if polymorphisms exist that would influence miRNA binding, but it would be expected that changes in the mRNA sequence at the miRNA binding site could increase or decrease the effects of miRNA expression of GSTZ1 protein expression. This could result in large variations in the population and is an interesting area for follow-up studies.
Previous experiments have noted that there is a lack of correlation between GSTZ1 mRNA and its protein. Therefore, miR-376c-3p likely does not regulate GSTZ1 through the canonical mRNA destruction pathway. In recent years it has become apparent that miRNAs function through multiple mechanisms, including the inhibition of translation (Gu and Kay, 2010). Upon binding to the 3′-UTR, the argonaute and glycine-tryptophan protein of 182 kDa protein complex is recruited. These large proteins may act to sterically block the circularization of mRNA that results from the binding of eukaryotic translation initiation factor 4E to the poly-A binding protein. These proteins may also prevent the binding of the ribosomal subunits or block them from progressing the full length of the coding sequence.
The results of our array may be useful for other studies examining changes in hepatic protein expression with age. The data are freely available from the Gene Expression Omnibus database (accession: GSE132763). Mining these data, we identified drug metabolizing enzymes whose mRNA are predicted to be bound by miRNA that showed altered regulation with age. Flavin-containing monooxygenases (FMOs), which show a very well documented, though poorly understood, switch in predominant expression from FMO1 to FMO3 during development (Dolphin et al., 1996; Yeung et al., 2000) may be candidates for further study. As shown in Table 1, FMO1 showed upregulation with age of more miRNAs targeting it than downregulating it, and FMO3 showed the opposite. Other genes whose targeting miRNA showed large changes consistent with known mRNA or protein levels were several members of the UGT family, where miRNAs including miR-376c-3p have previously been implicated (Papageorgiou and Court, 2017), and GSTs in the A and M families (Strange et al., 1989). For CYP3A4 and SULT2A1, however, the observed miRNA differential was not in accord with the known higher expression of these enzymes in adults compared with infants (Dubaisi et al., 2019).
It is possible that miRNAs influence the expression of many drug metabolizing enzymes and we have only begun to identify these cases. To our knowledge, this study is the first to report that expression of a member of the GST superfamily, GSTZ1, is regulated at least in part by an miRNA. Our data can be used in future studies examining not only the regulation of GSTZ1 and other drug metabolizing enzymes in human liver but also any protein that is differentially regulated with age.
Acknowledgments
Tissue samples were obtained from the University of Florida Clinical and Translational Science Institute (NIH National Center for Advancing Translational Sciences award number UL1TR001427), the NCI Cooperative Human Tissue Network (CHTN), and the NIH NeuroBioBank. HepG2A-MB-231, and 293T cells were a gift from Brian Law. We also thank Jacquelyn Serfecz for her help in obtaining the luciferase measurements.
Abbreviations
- DCA
dichloroacetate
- FMO
flavin-containing monooxygenase
- GST
glutathione transferase
- GSTZ1
glutathione transferase zeta 1
- miR-CTRL
negative control miRNA
- miRNA
microRNA
- qPCR
quantitative polymerase chain reaction
- RT
reverse transcription
- UGT
UDP-glucuronosyltransferase
- UTR
untranslated region
Authorship Contributions
Participated in research design: Jahn, Gay, Weaver, Stacpoole, James.
Conducted experiments: Jahn, Gay, Weaver.
Contributed new reagents or analytic tools: Renne, Langaee.
Performed data analysis: Jahn, Weaver, James.
Wrote or contributed to the writing of the manuscript: Jahn, Weaver, Langaee, James.
Footnotes
This work was funded by grants from the US Public Health Service, National Institutes of Health, National Institute of General Medical Sciences [Grant R01 GM 099871].
 This article has supplemental material available at dmd.aspetjournals.org.
References
- Ammini CV, Fernandez-Canon J, Shroads AL, Cornett R, Cheung J, James MO, Henderson GN, Grompe M, Stacpoole PW. (2003) Pharmacologic or genetic ablation of maleylacetoacetate isomerase increases levels of toxic tyrosine catabolites in rodents. Biochem Pharmacol 66:2029–2038. [DOI] [PubMed] [Google Scholar]
- Bhatt DK, Mehrotra A, Gaedigk A, Chapa R, Basit A, Zhang H, Choudhari P, Boberg M, Pearce RE, Gaedigk R, et al. (2019) Age- and genotype-dependent variability in the protein abundance and activity of six major uridine diphosphate-glucuronosyltransferases in human liver. Clin Pharmacol Ther 105:131–141. [DOI] [PMC free article] [PubMed] [Google Scholar]
- Bina M. (2013) Gene regulation. Methods Mol Biol 977:1–11. [DOI] [PubMed] [Google Scholar]
- Chandrasekaran K, Swaminathan K, Chatterjee S, Dey A. (2010) Apoptosis in HepG2 cells exposed to high glucose. Toxicol In Vitro 24:387–396. [DOI] [PubMed] [Google Scholar]
- Croom EL, Stevens JC, Hines RN, Wallace AD, Hodgson E. (2009) Human hepatic CYP2B6 developmental expression: the impact of age and genotype. Biochem Pharmacol 78:184–190. [DOI] [PubMed] [Google Scholar]
- Dluzen DF, Lazarus P. (2015) MicroRNA regulation of the major drug-metabolizing enzymes and related transcription factors. Drug Metab Rev 47:320–334. [DOI] [PMC free article] [PubMed] [Google Scholar]
- Dolphin CT, Cullingford TE, Shephard EA, Smith RL, Phillips IR. (1996) Differential developmental and tissue-specific regulation of expression of the genes encoding three members of the flavin-containing monooxygenase family of man, FMO1, FMO3 and FM04. Eur J Biochem 235:683–689. [DOI] [PubMed] [Google Scholar]
- Dubaisi S, Caruso JA, Gaedigk R, Vyhlidal CA, Smith PC, Hines RN, Kocarek TA, Runge-Morris M. (2019) Developmental expression of the cytosolic sulfotransferases in human liver. Drug Metab Dispos 47:592–600. [DOI] [PMC free article] [PubMed] [Google Scholar]
- Fang YY, Kashkarov U, Anders MW, Board PG. (2006) Polymorphisms in the human glutathione transferase zeta promoter. Pharmacogenet Genomics 16:307–313. [DOI] [PubMed] [Google Scholar]
- Gu S, Kay MA. (2010) How do miRNAs mediate translational repression? Silence 1:11. [DOI] [PMC free article] [PubMed] [Google Scholar]
- Gurtan AM, Sharp PA. (2013) The role of miRNAs in regulating gene expression networks. J Mol Biol 425:3582–3600. [DOI] [PMC free article] [PubMed] [Google Scholar]
- Hines RN. (2008) The ontogeny of drug metabolism enzymes and implications for adverse drug events. Pharmacol Ther 118:250–267. [DOI] [PubMed] [Google Scholar]
- James MO, Jahn SC, Zhong G, Smeltz MG, Hu Z, Stacpoole PW. (2017) Therapeutic applications of dichloroacetate and the role of glutathione transferase zeta-1. Pharmacol Ther 170:166–180. [DOI] [PMC free article] [PubMed] [Google Scholar]
- John B, Enright AJ, Aravin A, Tuschl T, Sander C, Marks DS. (2004) Human microRNA targets. PLoS Biol 2:e363. [DOI] [PMC free article] [PubMed] [Google Scholar]
- Karagkouni D, Paraskevopoulou MD, Chatzopoulos S, Vlachos IS, Tastsoglou S, Kanellos I, Papadimitriou D, Kavakiotis I, Maniou S, Skoufos G, et al. (2018) DIANA-TarBase v8: a decade-long collection of experimentally supported miRNA-gene interactions. Nucleic Acids Res 46:D239–D245. [DOI] [PMC free article] [PubMed] [Google Scholar]
- Lagos-Quintana M, Rauhut R, Lendeckel W, Tuschl T. (2001) Identification of novel genes coding for small expressed RNAs. Science 294:853–858. [DOI] [PubMed] [Google Scholar]
- Lamba V, Ghodke-Puranik Y, Guan W, Lamba JK. (2014) Identification of suitable reference genes for hepatic microRNA quantitation. BMC Res Notes 7:129. [DOI] [PMC free article] [PubMed] [Google Scholar]
- Langaee TY, Zhong G, Li W, Hamadeh I, Solayman MH, McDonough CW, Stacpoole PW, James MO. (2015) The influence of human GSTZ1 gene haplotype variations on GSTZ1 expression. Pharmacogenet Genomics 25:239–245. [DOI] [PMC free article] [PubMed] [Google Scholar]
- Lau NC, Lim LP, Weinstein EG, Bartel DP. (2001) An abundant class of tiny RNAs with probable regulatory roles in Caenorhabditis elegans. Science 294:858–862. [DOI] [PubMed] [Google Scholar]
- Lee RC, Feinbaum RL, Ambros V. (1993) The C. elegans heterochronic gene lin-4 encodes small RNAs with antisense complementarity to lin-14. Cell 75:843–854. [DOI] [PubMed] [Google Scholar]
- Lewis BP, Burge CB, Bartel DP. (2005) Conserved seed pairing, often flanked by adenosines, indicates that thousands of human genes are microRNA targets. Cell 120:15–20. [DOI] [PubMed] [Google Scholar]
- Li W, Gu Y, James MO, Hines RN, Simpson P, Langaee T, Stacpoole PW. (2012) Prenatal and postnatal expression of glutathione transferase ζ 1 in human liver and the roles of haplotype and subject age in determining activity with dichloroacetate. Drug Metab Dispos 40:232–239. [DOI] [PMC free article] [PubMed] [Google Scholar]
- Li W, James MO, McKenzie SC, Calcutt NA, Liu C, Stacpoole PW. (2011) Mitochondrion as a novel site of dichloroacetate biotransformation by glutathione transferase zeta 1. J Pharmacol Exp Ther 336:87–94. [DOI] [PMC free article] [PubMed] [Google Scholar]
- Papageorgiou I, Court MH. (2017) Identification and validation of microRNAs directly regulating the UDP-glucuronosyltransferase 1A subfamily enzymes by a functional genomics approach. Biochem Pharmacol 137:93–106. [DOI] [PMC free article] [PubMed] [Google Scholar]
- Paraskevopoulou MD, Vlachos IS, Hatzigeorgiou AG. (2016) DIANA-TarBase and DIANA suite tools: studying experimentally supported microRNA targets. Curr Protoc Bioinformatics 55:12.14.1-12.14.18. [DOI] [PubMed] [Google Scholar]
- Pasquinelli AE, Reinhart BJ, Slack F, Martindale MQ, Kuroda MI, Maller B, Hayward DC, Ball EE, Degnan B, Müller P, et al. (2000) Conservation of the sequence and temporal expression of let-7 heterochronic regulatory RNA. Nature 408:86–89. [DOI] [PubMed] [Google Scholar]
- Reinhart BJ, Slack FJ, Basson M, Pasquinelli AE, Bettinger JC, Rougvie AE, Horvitz HR, Ruvkun G. (2000) The 21-nucleotide let-7 RNA regulates developmental timing in Caenorhabditis elegans. Nature 403:901–906. [DOI] [PubMed] [Google Scholar]
- Strange RC, Howie AF, Hume R, Matharoo B, Bell J, Hiley C, Jones P, Beckett GJ. (1989) The development expression of alpha-, mu- and pi-class glutathione S-transferases in human liver. Biochim Biophys Acta 993:186–190. [DOI] [PubMed] [Google Scholar]
- Wang X. (2016) Improving microRNA target prediction by modeling with unambiguously identified microRNA-target pairs from CLIP-ligation studies. Bioinformatics 32:1316–1322. [DOI] [PMC free article] [PubMed] [Google Scholar]
- Yeung CK, Lang DH, Thummel KE, Rettie AE. (2000) Immunoquantitation of FMO1 in human liver, kidney, and intestine. Drug Metab Dispos 28:1107–1111. [PubMed] [Google Scholar]
- Zhong G, James MO, Smeltz MG, Jahn SC, Langaee T, Simpson P, Stacpoole PW. (2018) Age-related changes in expression and activity of human hepatic mitochondrial glutathione transferase Zeta1. Drug Metab Dispos 46:1118–1128. [DOI] [PMC free article] [PubMed] [Google Scholar]


