

Abstract
Tau hyperphosphorylation is an early step in tau-mediated neurodegeneration and is associated with intracellular aggregation of tau as neurofibrillary tangles, neuronal and synaptic loss, and eventual cognitive dysfunction in Alzheimer’s disease. Sleep loss increases the cerebrospinal fluid concentration of amyloid-β and tau. Using mass spectrometry, we measured tau and phosphorylated tau concentrations in serial samples of cerebrospinal fluid collected from participants who were sleep-deprived, treated with sodium oxybate, or allowed to sleep normally. We found that sleep loss affected phosphorylated tau differently depending on the modified site. These findings suggest a mechanism for sleep loss to increase risk of Alzheimer’s disease.
Introduction:
Deposition of amyloid-β (Aβ) in the brain as insoluble plaques and intracellular aggregation of hyperphosphorylated tau as neurofibrillary tangles (NFTs) are pathological hallmarks of Alzheimer’s disease (AD)1. Tau is a microtubule-associated protein that is abundant in neurons, and is regulated by phosphorylation to control interaction with microtubules2. Hyperphosphorylation of tau is an early step in tau-mediated neurodegeneration and is associated with intracellular aggregation of tau as NFTs, neuronal and synaptic loss, and eventual cognitive dysfunction in AD.
Substantial evidence supports that sleep disturbances increase the risk of AD3. Levels of cerebrospinal fluid (CSF) Aβ are influenced by neuronal activity4 and increase ~30% with sleep deprivation in humans via increased production and release5. Increased CSF Aβ concentrations due to chronic sleep disturbances have been hypothesized to be a mechanism mediating this increased risk3. Tau is also released via neuronal activity6 and was recently found to increase with sleep deprivation in both the interstitial fluid of mice and human CSF7. How sleep deprivation and pharmacologically increased sleep affects CSF phosphorylated tau (p-tau) is unknown. To address these questions, we measured tau and p-tau peptide residues 151 to 406 in CSF samples collected in a previous published pilot study5. We found that unphosphorylated tau increases with sleep deprivation, while change at specific phosphorylation sites are variable.
Methods:
Participants
Participant characteristics and the study protocol were previously published5. To briefly summarize, eight cognitively normal, Aβ-negative participants age 30–60 years old were randomized to sleep deprivation for 36 hours, increased sleep with sodium oxybate, or normal sleep (control). Sodium oxybate was selected because it increases slow wave sleep (SWS)8. We hypothesized that neuronal activity, and therefore the release of Aβ and tau, would be lowest during SWS9. Each participant was invited to repeat the study at 4–6 month intervals to allow for adequate recovery time after the lumbar catheter placement. Four participants repeated the study once, and 4 participants completed all 3 groups (Table 1). The study protocol was approved by the Washington University Institutional Review Board and an independent safety committee oversaw the entire study with regular review of adverse events and approval to continue. All participants completed written informed consent and were compensated for their participation in the study.
TABLE 1.
Participant Characteristics and Samples Available for Each Assay
| Characteristic | Control, n = 7 | Sleep-Deprived, n = 7 | Drug, n = 6 | |||||||||
|---|---|---|---|---|---|---|---|---|---|---|---|---|
| Age, yr | ||||||||||||
| Mean | 47.6 | 48.1 | 51 | |||||||||
| SD | 9.2 | 10 | 9.8 | |||||||||
| Sex, M/F | 2/5 | 3/4 | 3/3 | |||||||||
| Race, C/AA | 3/4 | 3/4 | 2/4 | |||||||||
| Samples Available for Each Assay | ||||||||||||
| Participant | Control | Sleep-Deprived | Drug | |||||||||
| Aβ | Tau/p-tau | α-synuclein | pS129-α-synuclein | Aβ | Tau/p-tau | α-synuclein | pS129-α-synuclein | Aβ | Tau/p-tau | α-synuclein | pS129-α-synuclein | |
| 1 | X | X | X | BLD | X | X | X | BLD | X | X | X | BLD |
| 2 | X | X | X | BLD | X | X | X | BLD | X | X | X | BLD |
| 3 | X | X | X | X | X | X | X | X | X | X | X | X |
| 4 | X | X | X | BLD | X | X | X | BLD | X | X | X | BLD |
| 5 | X | X | — | — | X | X | — | — | — | — | — | — |
| 6 | X | X | X | BLD | X | X | — | — | — | — | — | — |
| 7 | X | X | X | X | — | — | — | — | X | X | X | X |
| 8 | — | — | — | — | X | X | X | X | X | X | X | X |
AA = African American; Aβ = amyloid-β; BLD = below detection limit; C = Caucasian; F = female; M = male; p-tau = phosphorylated tau;
Sample Collection and Analysis
All samples were collected and processed as previously described5, 10, 11. Since previous studies have shown a linear rise in serially sampled CSF Aβ concentrations in Aβ-negative individuals that is dependent on sampling frequency and volume12–14, 6 ml of CSF was sampled every 2 hours in all groups. After one milliliter of CSF at each time point and media standards were thawed, tau was purified and processed for mass spectrometry (MS) by immunoprecipitation (IP) as reported10. The IP mixture was comprised of 1 milliliter of CSF, 5 ng of 15N-441 tau internal standard, 5 mM Guanidine, and 1% NP-40 and 1X protease inhibitor cocktail (Roche). Twenty microliters of sepharose beads crosslinked to Tau1 (tau epitope 192–199) and HJ8.5 (tau epitope 27–35) antibodies were added to the IP mixture and samples were incubated 2 hours at room temperature. After rinsing, immobilized samples were digested overnight at 37°C with 400 ng of trypsin Gold (Promega, Madison, WI) then extracted on TopTip C18 tips. Unphosphorylated and phosphorylated tau peptides were separated using a nano-liquid chromatography (nanoAcquity UPLC, Waters, Milford, MA) on a Waters HSS T3 column (75 µm x 100 mm, 1.8 µm) operating at a flow rate of 400 ng/µl and measured on Fusion Tribrid mass spectrometer (Thermo Scientific, San Jose, CA) operating in Parallel Reaction Monitoring using HCD fragmentation as reported10. Skyline software (MacCoss lab, University of Washington) was used to collect and quantify MS data.
As a control protein, we measured total and phosphorylated α-synuclein using enzyme linked immunosorbent assays (ELISA). Total α-synuclein was measured in CSF using a sandwich ELISA (BioLegend, San Diego, CA) in accordance with the guidelines provided in the kit manual. The interassay coefficient of variation was 8.2%. α-synuclein phosphorylated at serine-129 (pS129-α-synuclein) was measured in CSF using a sandwich ELISA (MyBioSource, San Diego, CA) according to the manufacturer’s instructions. The interassay coefficient of variation was 8.1%. To address the potential confounder of α-synuclein from red blood cells due to blood contamination from the lumbar catheter, hemoglobin levels in CSF from all timepoints from all participants were quantified using the Human Hemoglobin ELISA Quantitation Set (Bethyl Laboratories, Montgomery, TX) according to the kit’s instructions. For each participant and assay, CSF from all time points were run in duplicate on the same ELISA plate.
Statistics
Statistical analyses were performed using SPSS version 25 (IBM, Armonk, NY). Differences in tau truncation profiles at hours 6, 22, and 34 and all serial CSF data were analyzed with general linear mixed models using a compound symmetry covariance structure as previously described5. Linear mixed models account for the dependencies among the longitudinal and repeated measurements. Intervention group and time of day were treated as fixed effects. Random intercepts and slopes for time were used to accommodate individual variation. When assessing for the difference in concentrations between hours 18–28, linear mixed models were used as with the tau models but with the average baseline concentration over hours 0–12 included as a covariate. Statistical significance was set at p<0.05. Bonferroni correction was used when making comparison between the 3 intervention groups. The normality assumption was verified through residual plots.
Results:
In CSF samples from all groups, peptides corresponding to truncated forms of tau and p-tau from the mid-domain region (151–221) were the major tau fragments found (Fig 1). From residues 226 to 290, tau peptides level gradually decrease and no signal was detected for peptides after residue 290 including the 396–406 peptide. Thus, regardless of intervention group, detectable CSF tau was consistently C-terminally truncated as we have previously shown11.
Figure 1:
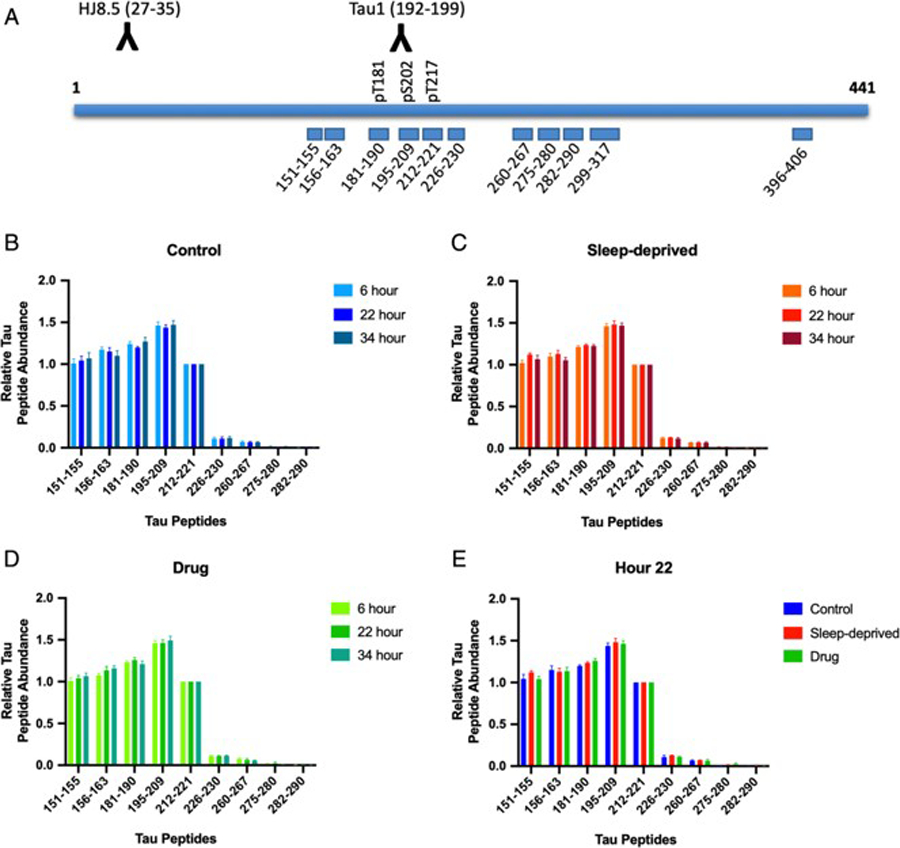
Cerebrospinal fluid (CSF) tau isoforms are consistently truncated regardless of time of day or intervention. (A) Tau peptides monitored by the mass spectrometry (MS) tau assay are shown. CSF tau isoforms are immunoprecipitated using the combination of HJ8.5 and Tau1 antibodies. Absolute amounts of tau peptides obtained after trypsin digestion are measured by comparison with a labeled internal standard. Phosphorylated peptides at T181, S202 and T217 levels are measured and compared to corresponding unmodified peptides. (B-E) Tau peptides 151–290 (x-axis) were measured at three time points: 1) hour 6 during the baseline period; 2) hour 22 during the intervention; 3) hour 34 during the post-intervention period. Peptides levels were normalized to the level of 212–221 peptide (y-axis) and the truncation profiles were not significantly different for participants in the control group (B), the sleep-deprived group (C), and the drug group (D) (all p>0.05). During the intervention period at hour 22 (E), the truncation profiles were also not significantly different between groups (p>0.05). Levels of tau peptides after residue 221 markedly decrease and peptides monitored after residue 290 are not detected.
In order to assess for intervention effects, tau and p-tau were measured for threonine 181 (T181), serine 202 (S202), and threonine 217 (T217) and their concentrations normalized to a baseline for each subject before each group’s intervention (average of hours 07:00–19:00). Mean overnight concentrations for unphosphorylated T181, S202, and T217 increased 30–50% above baseline levels in sleep-deprived participants compared to control and drug groups (Fig 2A–C, Table 2). T181, S202, and T217 showed no statistically significant differences between the control and drug groups. Complete results of these analyses, including estimated differences and 95% confidence intervals, are in Table 2 and Supplemental Table 1.
Figure 2:
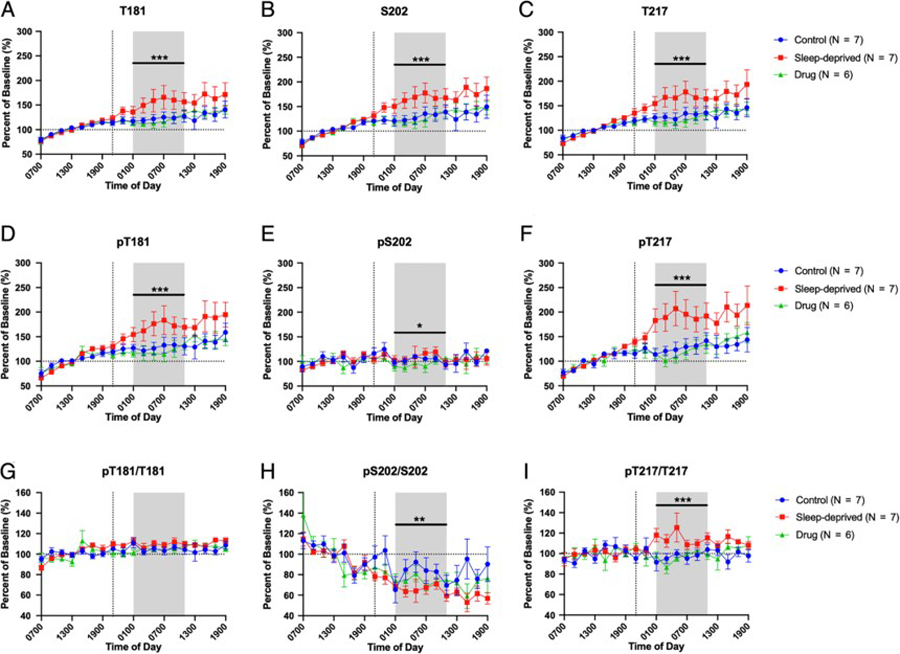
Overnight cerebrospinal fluid (CSF) tau and phosphorylated tau (p-tau). Eight subjects participated in the study. Four participants repeated the study in the control, sleep-deprived, and drug intervention groups; four participants repeated the study in 2 groups. In all graphs, concentrations and ratios were normalized to the baseline 07:00 to 19:00. The overnight period during the intervention night was defined as hours 18 to 28 (01:00–11:00) to account for transit time of CSF from the brain to lumbar catheter (shaded area). (A-C) Sleep deprivation increased overnight non-phosphorylated T181, S202, and T217 by 30–50% over the baseline compared to participants in the control and drug groups; however, the control and drug groups were not significantly different. (D-F) Phosphorylated T181 (pT181) and phosphorylated T217 (pT217) were increased during sleep deprivation. pT217 increased 60–80% in the sleep-deprived group compared to the control and drug groups while pT181 showed a similar increase as the unphosphorylated tau forms. Phosphorylated S202 (pS202) was decreased during drug treatment only but did not change with sleep deprivation compared to control. (G-I) Ratio of p-tau/tau for each truncated form. pT181/T181 showed no significant difference between groups during the overnight period. pS202/S202 was decreased in the sleep deprived group compared to control but was not significantly different from the drug group. pT217/T217 was increased in the sleep-deprived group compared to both the control and drug groups. Blue: control; Red: sleep-deprived; Green: drug. Error bars indicate standard error. The vertical dashed line is the intervention start time. The horizontal dashed line is at 100% of baseline. *p<0.05; **p<0.001; ***p<0.0001.
TABLE 2.
Change in Overnight (01:00–11:00) Cerebrospinal Fluid Tau and Phosphorylated Tau from Baseline
| Site | Factor | Pairwise Comparison | Estimated Difference, % (95% CI) | F (df ) | p |
|---|---|---|---|---|---|
| T181 | Intervention | 16.6 (2, 99) | <0.0001a | ||
| Sleep-deprived vs control | +33.04 (+15.9 to +50.2) | <0.0001a,b | |||
| Sleep-deprived vs drug | +38.48 (+20.3 to +56.6) | <0.0001a,b | |||
| Control vs drug | +5.44 (−12.7 to +23.6) | 1.0b | |||
| pT181 | Intervention | 18.3 (2, 99) | <0.0001a | ||
| Sleep-deprived vs control | +41.9 (+20.8 to +63.0) | <0.0001a,b | |||
| Sleep-deprived vs drug | +50.3 (+28.0 to +72.6) | <0.0001a,b | |||
| Control vs drug | +8.4 (−13.9 to +30.7) | 1.0b | |||
| pT181/T181 | Intervention | 2.89 (2, 102) | 0.06 | ||
| Sleep-deprived vs control | +4.16 (−0.80 to +9.1) | 0.131b | |||
| Sleep-deprived vs drug | +4.47 (−0.74 to +5.5) | 0.118b | |||
| Control vs drug | +0.31 (−4.9 to +5.5) | 1.0b | |||
| S202 | Intervention | 18.98 (2, 99) | <0.0001a | ||
| Sleep-deprived vs control | +37.73 (+20.0 to +55.4) | <0.0001a,b | |||
| Sleep-deprived vs drug | +41.38 (+22.6 to +60.2) | <0.0001a,b | |||
| Control vs drug | +3.65 (−15.1 to +22.4) | 1.0b | |||
| pS202 | Intervention | 4.79 (2, 99) | 0.01 | ||
| Sleep-deprived vs control | +10.1 (−1.6 to +21.8) | 0.112b | |||
| Sleep-deprived vs drug | +15.06 (+2.8 to +27.3) | 0.01a,b | |||
| Control vs drug | +4.96 (−7.3 to +17.2) | 0.981b | |||
| pS202/S202 | Intervention | 6.3 (2, 98) | 0.003a | ||
| Sleep-deprived vs control | −14.19 (−23.9 to −4.5) | 0.002a,b | |||
| Sleep-deprived vs drug | −7.35 (−17.6 to +2.9) | 0.254b | |||
| Control vs drug | +6.85 (−3.4 to +17.1) | 0.324b | |||
| T217 | Intervention | 23.2 (2, 98) | <0.0001a | ||
| Sleep-deprived vs control | +37.42 (+19.8 to +55.1) | <0.0001a,b | |||
| Sleep-deprived vs drug | +48.72 (+30.0 to +67.4) | <0.0001a,b | |||
| Control vs drug | +11.31 (−7.4 to +30.0) | 0.433b | |||
| pT217 | Intervention | 33.82 (2, 98) | <0.0001a | ||
| Sleep-deprived vs control | +64.33 (+39.7 to +89.0) | <0.0001a,b | |||
| Sleep-deprived vs drug | +81.52 (+55.4 to +107.7) | <0.0001a,b | |||
| Control vs drug | +17.19 (−9.0 to +43.3) | 0.338a | |||
| pT217/T217 | Intervention | 19.3 (2, 100) | <0.0001a | ||
| Sleep-deprived vs control | +16.84 (+8.7 to +25.0) | <0.0001a,b | |||
| Sleep-deprived vs drug | +19.66 (+11.1 to +28.2) | <0.0001a,b | |||
| Control vs drug | +2.83 (−5.8 to +11.4) | 1.0b |
Statistically significant.
Bonferroni corrected for multiple comparisons.
CI = confidence interval; df = degrees of freedom; pS202 = phosphorylated serine 202; pT181 = phosphorylated threonine 181; pT217 = phosphorylated threonine 217; S202 = serine 202; T181 = threonine 181; T217 = threonine 217.
Mean overnight changes in tau phosphorylated at T181 (pT181) were similar to unphosphorylated T181 with pT181 increased 40–50% above baseline levels in sleep-deprived participants compared to the control and drug groups. In contrast, phosphorylated S202 (pS202) showed no differences between the sleep-deprived and control groups or the drug and control groups. For tau phosphorylated at T217 (pT217), there was a large increase of 60–80% in the sleep-deprived group compared to the control with no change in the drug group (Fig 2D–F, Table 2). To assess the phosphorylation occupancy on each site, the ratio of phospho-tau to the unphosphorylated form was calculated10. Each phospho-tau species responded to sleep deprivation in opposite directions (Fig 2G–I, Table 2). The mean overnight phosphorylation ratio of pT217/T217 increased 15–20% above baseline with sleep deprivation. However, the pT181/T181 ratio was not significantly different between groups and the mean overnight ratio of pS202/S202 decreased from baseline more during sleep deprivation compared to controls. Complete results of these analyses, including estimated differences and 95% confidence intervals, are in Table 2 and Supplemental Table 1.
Normalization of tau and p-tau concentrations to a baseline assists with comparisons between groups, but obscures the differences in concentrations between groups. Figure 3 shows the average concentrations without normalization for T181 (3A), S202 (3B), T217 (3C), pT181 (3D), pS202 (3E), and pT217 (3F). Individual time courses for each participant are shown for T181 and pT181 (Fig 4), S202 and pS202 (Fig 5), and T217 and pT217 (Fig 6). When using the average concentration of tau or p-tau forms during the baseline period 0–12 hours (07:00–19:00) as a covariate, the change in concentration between groups for the tau or p-tau forms ranged from 0.001–0.12 ng/ml. Complete results of these analyses, including estimated differences and 95% confidence intervals, are in Supplemental Table 2.
Figure 3:
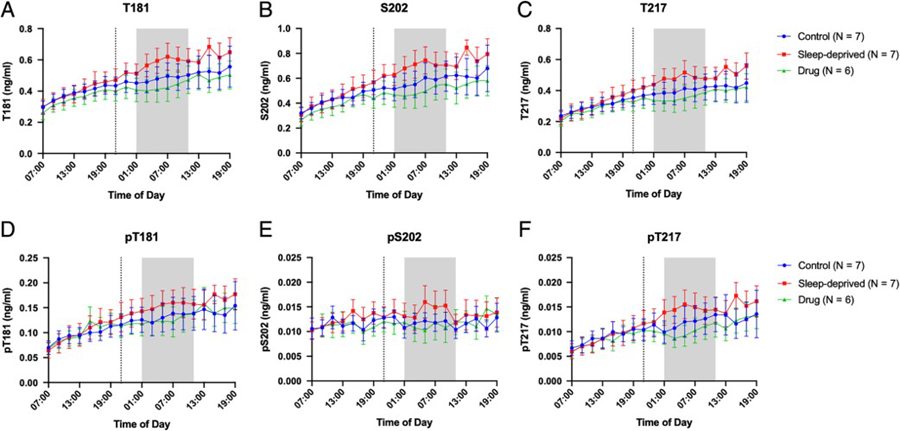
Tau and P-tau concentrations over 36-hours for the control, sleep-deprived, and drug groups. Average T181 (A), S202 (B), T217 (C), pT181 (D), pS202 (E), and pT217 (F) concentrations in ng/ml are shown over 36-hours between 07:00–19:00 and are not normalized to baseline. The overnight period during the intervention night was defined as hours 18 to 28 (01:00–11:00) to account for transit time of CSF from the brain to lumbar catheter (shaded area). Blue: control; Red: sleep-deprived; Green: drug. Error bars indicate standard error. The vertical dashed line is the intervention start time.
Figure 4:

Within-subject changes in CSF concentration of T181 and pT181 (ng/ml) in the control (A, D), sleep-deprived (B, E), and drug (C, F) groups. Participants are shown individually. The overnight period during the intervention night was defined as hours 18 to 28 (01:00–11:00) to account for transit time of CSF from the brain to lumbar catheter (shaded area). The vertical dashed line is the intervention start time.
Figure 5:

Within-subject changes in CSF concentration of S202 and pS202 (ng/ml) in the control (A, D), sleep-deprived (B, E), and drug (C, F) groups. Participants are shown individually. The overnight period during the intervention night was defined as hours 18 to 28 (01:00–11:00) to account for transit time of CSF from the brain to lumbar catheter (shaded area). The vertical dashed line is the intervention start time.
Figure 6:

Within-subject changes in CSF concentration of T217 and pT217 (ng/ml) in the control (A, D), sleep-deprived (B, E), and drug (C, F) groups. Participants are shown individually. The overnight period during the intervention night was defined as hours 18 to 28 (01:00–11:00) to account for transit time of CSF from the brain to lumbar catheter (shaded area). The vertical dashed line is the intervention start time.
To test the effect of sleep deprivation on phosphorylation of another control protein, we measured the concentrations of total α-synuclein and pS129-α-synuclein in 17 of 20 participant time courses with sufficient remaining sample (Table 1). Consistent with prior work15, we did not find a correlation between α-synuclein and hemoglobin (Fig 7A). In a pattern similar to Aβ5 and unphosphorylated tau, we found that overnight CSF α-synuclein concentrations increased during sleep deprivation by ~80% compared to controls (Fig 7B). pS129-α-synuclein, however, showed no significant difference between the sleep-deprived and control groups (Fig 7C). Complete results of these analyses, including estimated differences and confidence intervals, are in Supplemental Table 1; complete results of the analyses using average concentrations without normalization are shown in Supplemental Table 2. Further, pS129-α-synuclein was below the limit of detection in 4 of 7 participants regardless of intervention group. These findings indicate that sleep deprivation affects the level of nonphosphorylated α-synuclein in CSF but does not affect the level of pS129-α-synuclein.
Figure 7:
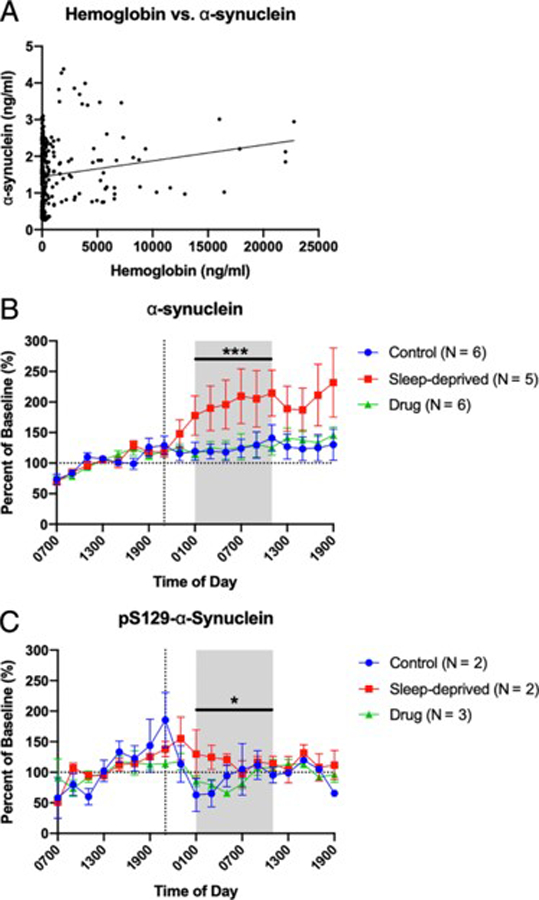
Overnight cerebrospinal fluid (CSF) α-synuclein and pS129-α-synuclein. Seven participants who completed control (N=6), sleep-deprived (N=5), and drug (N=6) groups underwent measurement of hemoglobin, α-synuclein, and pS129-α-synuclein. Concentrations of α-synuclein and pS129-α-synuclein were normalized to the baseline 07:00 to 19:00. The overnight period during the intervention night was defined as hours 18 to 28 (01:00–11:00) to account for transit time of CSF from the brain to lumbar catheter (shaded area). (A) α-synuclein concentration does not increase with increased hemoglobin concentration. For each time point, the graph shows the concentration of α-synuclein (ng/ml) to hemoglobin (ng/ml). The best fit line for all time points is shown. (B) Sleep deprivation increased overnight α-synuclein by ~80% over baseline compared to participants in the control and drug groups; however the control and drug groups were not significantly different. (C) pS129-α-synuclein was not increased in the sleep-deprived group compared to controls, although the sleep-deprived groups was significantly increased compared to the drug group by ~30%. pS129-α-synuclein was below the limit of detection in four participants regardless of group. Blue: control; Red: sleep-deprived; Green: drug. Error bars indicate standard error. The vertical dashed line is the intervention start time. The horizontal dashed line is at 100% of baseline. *p<0.05; ***p<0.0001
Discussion:
Extracellular levels of Aβ, tau, and α-synuclein are regulated by neuronal activity in vivo4, 6, 16 and increase with sleep deprivation or chemogenetically-induced increased wakefulness5, 7. Prolonged wakefulness is hypothesized to increase the concentration of these proteins via increased production and/or release. The half-life of Aβ is ~9 hours in the human central nervous system (CNS) as measured in CSF17 and we have recently shown that CSF Aβ increases during sleep deprivation from increased production5. Tau in the CNS of humans has a half-life of ~23 days11 from the time of translation; however, once tau is released into the brain ISF or CSF its half-life is on the order of hours18. Therefore, we hypothesize that increased release rather than increased production accounts for the rise in tau concentration during sleep deprivation. Release of full-length tau is associated with neuronal injury, such as from traumatic brain injury, while neuronal activity releases truncated forms of tau11. Since no full-length tau was measured in our samples, this provides further supportive evidence that increased processing and release during sleep deprivation is the mechanism for the rise in tau concentration that we observed. However, further studies, such as with stable isotope labeling kinetics11, will be necessary to demonstrate if the production or clearance rates of tau and p-tau are affected by sleep-wake activity.
We found that unphosphorylated tau increases with sleep deprivation, while changes in phosphorylation are site-specific. The magnitude of these changes in terms of concentration depended upon the tau or p-tau form ranging from 0.001–0.12 ng/ml (Fig 3–6; complete results from these analyses, including estimated differences and 95% confidence intervals, are in Supplemental Table 2). Further, sleep deprivation showed different effects on unphosphorylated α-synuclein and pS129-α-synuclein. Since the pS129 ELISA sensitivity is 0.1 ng/ml, sleep-related changes in pS129 may have been below the limit of detection. Different sites of tau, including S202 and T217, are phosphorylated by a variety of kinases, such as CDK5 and GSK-3β19. Sleep deprivation may alter physiologic processes that modulate site-specific phosphorylation of tau and lead to tau hyperphosphorylation. Variation in both site-specific tau phosphorylation, including increased pT217, as well as kinase and phosphatase activity has been previously reported in the hippocampus of fasting mice20, 21. Further, recent work in mice found that sleep loss increased phosphorylation of the brain proteome, including kinases such as microtubule affinity regulating kinase 2 (MARK2)22. MARK2 is activated by phosphorylation and in turn phosphorylates tau23. Sleep was also recently shown to alter protein phosphorylation at synapses24. Therefore, differential activation of kinases and phosphatases during sleep-wake activity may drive tau hyperphosphorylation and account for the observed differences in truncated p-tau forms.
Alternatively, release of p-tau from neurons may be dependent on the specific site of phosphorylation. In a study comparing phospho-tau at 20 sites in the brains of individuals with AD and age-matched controls, pS202 was increased in AD patients compared to controls whereas there was no increase of pT21725. Phosphorylation of S202 was also recently found to be a key site that promoted tau aggregation into fibrils and was shown to drive the aggregation of tau26. We hypothesize that pS202 could be retained within neurons during sleep deprivation and lead to a decrease in the concentration of CSF pS202. If there is greater intraneuronal retention of pS202, this may promote aggregation of NFTs.
A major limitation of our study is the low number of participants. Despite the low number of participants, a strength of the study is that we were able to recruit participants who repeated the study in different groups allowing for intra-participant comparisons. A second limitation is that the small sample size limits the exploration of age- and sex-related effects as well as potential interactions. Finally, this study is also a secondary analysis of samples collected in another study whose primary outcome was not to measure the effect of sleep on tau phosphorylation.
Extensive evidence supports that pathological forms of tau spread through synaptically-linked networks once tau begins to accumulate within neurons27 and is a possible mechanism for how sleep deprivation may promote AD pathogenesis7. Since our participants were Aβ-negative based on their CSF Aβ42/40 ratios, future investigations will be needed to determine how CSF p-tau is affected by sleep deprivation at different stages of AD pathology. Although CSF tau and pT181 increase in individuals who are Aβ-positive or who have symptomatic AD28, 29, the effect of sleep deprivation on CSF tau and p-tau in similar participants is unknown and requires further study. Furthermore, the relationship of S202, pS202, T217, and pT217 to other AD biomarkers and the onset of cognitive symptoms is not defined. Future studies measuring different p-tau forms in the participants of longitudinal cohorts of aging and AD are needed. Finally, factors such as time of day and overnight sleep quality preceding lumbar puncture should be considered when interpreting p-tau levels depending on the site of phosphorylation.
Supplementary Material
Acknowledgements
This study was supported by the following grants from the NIH: UL1 TR000448 and KL2 TR000450 (National Center for Advancing Translational Sciences, Washington University Institute of Clinical and Translational Sciences); R03 AG047999 (National Institute on Aging); K76 AG054863 (National Institute on Aging); R01 NS065667 (National Institute of Neurological Disorders and Stroke); R01 NS097799 (National Institute of Neurological Disorders and Stroke); P50 AG05681 (National Institute on Aging), and P01 AG26276 (National Institute on Aging). Additional support was provided by the McDonnell Center for Systems Neuroscience at Washington University School of Medicine (B.P.L) and Alzheimer’s Association Research Fellowship (AARF-16–443265) (N.R.B). The funding sources had no role in the study design, data collection, management, analysis, interpretation of the data, or manuscript preparation.
We thank the participants for their time. The 15N-441 tau internal standard was a generous gift from Guy Lippens. Dr. Nicholas Kanaan generously provided the Tau1 antibody that is a tau epitope 192–199. HJ8.5 antibody to tau epitope 27–35 was generously given by Dr. David Holtzman. We thank Dr. David Holtzman and Jack Baty for their helpful comments on the manuscript.
Footnotes
Publisher's Disclaimer: This article has been accepted for publication and undergone full peer review but has not been through the copyediting, typesetting, pagination and proofreading process which may lead to differences between this version and the Version of Record.
Potential Conflicts of Interest:
Washington University, with N.R.B. and R.J.B. as coinventors, has submitted the U.S. nonprovisional patent application “Cerebrospinal fluid (CSF) Tau Rate of Phosphorylation Measurement to Define Stages of Alzheimer’s Disease and Monitor Brain Kinases/Phosphatases Activity.”
References
- 1.Morris JC, Price JL. Pathologic correlates of nondemented aging, mild cognitive impairment, and early-stage Alzheimer’s disease. J Molec Neurosci 2001; 17 (2): 101–18. [DOI] [PubMed] [Google Scholar]
- 2.Spillantini MG, Goedert M. Tau pathology and neurodegeneration. Lancet Neurol 2013; 12 (6): 609–22. [DOI] [PubMed] [Google Scholar]
- 3.Ju Y-E, Lucey BP, Holtzman DM. Sleep and Alzheimer disease pathology-a bidirectional relationship. Nat Rev Neurol 2014; 10 (2): 115–9. [DOI] [PMC free article] [PubMed] [Google Scholar]
- 4.Cirrito JR, Yamada KA, Finn MB, Sloviter RS, Bales KR, May PC, Schoepp DD, Paul SM, Mennerick S, Holtzman DM. Synaptic activity regulates interstitial fluid amyloid-β levels in vivo. Neuron 2005; 48: 913–22. [DOI] [PubMed] [Google Scholar]
- 5.Lucey BP, Hicks TJ, McLeland JS, Toedebusch CD, Boyd J, Elbert DL, Patterson BW, Baty J, Morris JC, Ovod V, Mawuenyega KG, Bateman RJ. Effect of sleep on overnight CSF amyloid-β kinetics. Ann Neurol 2018; 83 (1): 197–204. [DOI] [PMC free article] [PubMed] [Google Scholar]
- 6.Yamada K, Holth JK, Liao F, Stewart FR, Mahan TE, Jiang H, Cirrito JR, Patel TK, Hochgräfe K, Mandelkow E-M, Holtzman DM. Neuronal activity regulates extracellular tau in vivo. J Exp Med 2014; 211 (3): 387–93. [DOI] [PMC free article] [PubMed] [Google Scholar]
- 7.Holth JK, Fritschi SK, Wang C, Pedersen NP, Cirrito JR, Finn MB, Manis M, Geerling JC, Fuller PM, Lucey BP, Holtzman DM. The sleep-wake cycle regulates extracellular tau in mice and humans. Science. 2019; 363 (6429): 880–4. [DOI] [PMC free article] [PubMed] [Google Scholar]
- 8.Walsh JK, Hall-Porter JM, Griffin KS, Dodson ER, Forst EH, Curry DT, Eisenstein RD, Schweitzer PK. Enhancing slow wave sleep with sodium oxybate reduces the behavioral and physiological impact of sleep loss. Sleep. 2010; 33 (9): 1217–25. [DOI] [PMC free article] [PubMed] [Google Scholar]
- 9.Maquet P, Dive D, Salmon E, Sadzot B, Franco G, Poirrier R, Frenckell Rv, Franck G. Cerebral glucose utilization during sleep-wake cycle in man determined by positron emission tomography and [18F]2-fluoro-2-deoxy-D-glucose method. Brain Res 1990; 513 (1): 136–43. [DOI] [PubMed] [Google Scholar]
- 10.Barthélemy NR, Mallipeddi N, Moiseyev P, Sato C, Bateman RJ. Tau phosphorylation rates measured by mass spectrometry differ in the intracellular brain vs. extracellular cerebrospinal fluid compartments and are differentially affected by Alzheimer’s disease. Front Aging Neurosci 2019; 11: 121. [DOI] [PMC free article] [PubMed] [Google Scholar]
- 11.Sato C, Barthélemy NR, Mawuenyega KG, Patterson BW, Gordon BA, Jockel-Balsarotti J, Sullivan M, Crisp MJ, Kasten T, Kirmess KM, Kanaan NM, Yarasheski KE, Baker-Nigh A, Benzinger TL, Miller TM, Karch CM, Bateman RJ. Tau kinetics in neurons and the human central nervous system. Neuron 2018; 97 (6): 1284–98. [DOI] [PMC free article] [PubMed] [Google Scholar]
- 12.Lucey BP, Gonzales C, Das U, Li J, Siemers ER, Slemmon JR, Bateman RJ, Huang Y, Fox GB, Claassen JA, Slats D, Verbeek MM, Tong G, Soares H, Savage MJ, Kennedy M, Forman M, Sjögren M, Margolin R, Chen X, Farlow MR, Dean RA, Waring JF. An integrated multi-study analysis of intra-subject variability in cerebrospinal fluid amyloid-β concentrations collected by lumbar puncture and indwelling lumbar catheter. Alzheimers Res Ther 2015; 7: 53. [DOI] [PMC free article] [PubMed] [Google Scholar]
- 13.Li J, Llano DA, Ellis T, LeBlond D, Bhathena A, Jhee SS, Ereshefsky L, Lenz R, Waring JF. Effect of human cerebrospinal fluid sampling frequency on amyloid-β levels. Alzheimer’s & Dementia 2012; 8 (4): 295–303. [DOI] [PubMed] [Google Scholar]
- 14.Huang Y, Potter R, Sigurdson W, Santacruz A, Shih S, Ju Y-E, Kasten T, Morris JC, Mintun M, Duntley S, Bateman RJ. Effects of age and amyloid deposition on Aβ dynamics in the human central nervous system. Arch Neurol 2012; 69 (1): 51–8. [DOI] [PMC free article] [PubMed] [Google Scholar]
- 15.Buddhala C, Campbell MC, Perlmutter JS, Kotzbauer PT. Correlation between decreased CSF α-synuclein and Aβ1–42 in Parkinson disease. Neurobiol Aging 2015; 36 (1): 476–84. [DOI] [PMC free article] [PubMed] [Google Scholar]
- 16.Yamada K, Iwatsubo T. Extracellular α-synuclein levels are regulated by neuronal activity. Mol Neurodegener 2018; 13 (1): 9. [DOI] [PMC free article] [PubMed] [Google Scholar]
- 17.Patterson BW, Elbert DL, Mawuenyega KG, Kasten T, Ovod V, Ma S, Xiong C, Chott R, Yarasheski K, Sigurdson W, Zhang L, Goate A, Benzinger T, Morris JC, Holtzman D, Bateman RJ. Age and amyloid effects on human CNS amyloid-beta kinetics. Ann Neurol 2015; 78 (3): 439–53. [DOI] [PMC free article] [PubMed] [Google Scholar]
- 18.Yanamandra K, Patel TK, Jiang H, Schindler S, Ulrich JD, Boxer AL, Miller BL, Kerwin DR, Gallardo G, Stewart F, Finn MB, Cairns NJ, Verghese PB, Fogelman I, West T, Braunstein J, Robinson G, Keyser J, Roh J, Knapik SS, Hu Y, Holtzman DM. Anti-tau antibody administration increases plasma tau in transgenic mice and patients with tauopathy. Sci Transl Med 2017; 9 (386): eaal2029. [DOI] [PMC free article] [PubMed] [Google Scholar]
- 19.Liu F, Iqbal K, Grundke-Iqbal I, Gong C-X. Involvement of aberrant glycosylation in phosphorylation of tau by cdk5 and GSK-3β. FEBS Lett 2002; 530 (1–3): 209–14. [DOI] [PubMed] [Google Scholar]
- 20.Planel E, Yasutake K, Fujita SC, Ishiguro K. Inhibition of protein phosphatase 2A overrides tau protein kinase I/glycogen synthase kinase 3 and cyclin-dependent kinase 5 inhibition and results in tau hyperphosphorylation in the hippocampus of starved mouse. J Biol Chem 2001; 276 (36): 34298–306. [DOI] [PubMed] [Google Scholar]
- 21.Li X, Lu F, Wang J-Z, Gong C-X. Concurrent alterations of O-GlcNAcylation and phosphorylation of tau in mouse brains during fasting. Eur J Neurosci 2006; 23 (8): 2078–86. [DOI] [PubMed] [Google Scholar]
- 22.Wang Z, Ma J, Miyoshi C, Li Y, Sato M, Ogawa Y, Lou T, Ma C, Gao X, Lee C, Fujiyama T, Yang X, Hotta-Hirashima SZ, Klewe-Nebenius D, Ikkyu A, Kakizaki M, Kanno S, Cao L, Takahashi S, Peng J, Yu Y, Funato H, Yanagisawa M, Liu Q. Quantitative phosphoproteomic analysis of the molecular substrates of sleep need. Nature. 2018; 558 (7710): 435–9. [DOI] [PMC free article] [PubMed] [Google Scholar]
- 23.Kosuga S, Tashiro E, Kajioka T, Ueki M, Shimizu Y, Imoto M. GSK-3β directly phosphorylates and activates MARK2/PAR-1. J Biol Chem 2005; 280 (52): 42715–22. [DOI] [PubMed] [Google Scholar]
- 24.Brüning F, Noya SB, Bange T, Koutsouli S, Rudolph JD, Tyagarajan SK, Cox Jr, Mann M, Brown SA, Robles MS. Sleep-wake cycles drive daily dynamics of synaptic phosphorylation. Science. 2019; 366 (6462). [DOI] [PubMed] [Google Scholar]
- 25.Duka V, Lee J-H, Credle J, Wills J, Oaks A, Smolinsky C, Ketul, Shah, Mash DC, Masliah E, Sidhu A. Identification of the sites of tau hyperphosphorylation and activation of tau kinases in synucleinopathies and Alzheimer’s diseases. PLoS ONE. 2013; 8 (9): e75025. [DOI] [PMC free article] [PubMed] [Google Scholar] [Retracted]
- 26.Despres C, Byrne C, Qi H, Cantrelle F-X, Huvent I, Chambraud B, Baulieu E-E, Jacquot Y, Landrieu I, Lippens G, Smet-Nocca C. Identification of the tau phosphorylation pattern that drives its aggregation. Proc Natl Acad Sci USA. 2017; 114 (34): 9080–5. [DOI] [PMC free article] [PubMed] [Google Scholar]
- 27.Wu JW, Hussaini SA, Bastille IM, Rodriguez GA, Mrejeru A, Rilett K, Sanders DW, Cook C, Fu H, Boonen RACM, Herman M, Nahmani E, Emrani S, Figueroa YH, Diamond MI, Clelland CL, Wray S, Duff KE. Neuronal activity enhances tau propagation and tau pathology in vivo. Nat Neurosci 2016; 19 (8): 1085–92. [DOI] [PMC free article] [PubMed] [Google Scholar]
- 28.Fagan AM, Mintun MA, Shah AR, Aldea P, Roe CM, Mach RH, Marcus D, Morris JC, Holtzman DM. Cerebrospinal fluid tau and ptau(181) increase with cortical amyloid deposition in cognitively normal individuals: implications for future clinical trials of Alzheimer’s disease. EMBO Mol Med 2009; 1 (8–9): 371–80. [DOI] [PMC free article] [PubMed] [Google Scholar]
- 29.Xiong C, Jasielec MS, Weng H, Fagan AM, Benzinger TL, Head D, Hassenstab J, Grant E, Sutphen CL, Buckles V, Moulder KL, Morris JC. Longitudinal relationships among biomarkers for Alzheimer disease in the Adult Children Study. Neurology. 2016; 86 (16): 1499–506. [DOI] [PMC free article] [PubMed] [Google Scholar]
Associated Data
This section collects any data citations, data availability statements, or supplementary materials included in this article.