Abstract
The common CT imaging signs of lung diseases (CISLs) which frequently appear in lung CT images are widely used in the diagnosis of lung diseases. Computer-aided diagnosis (CAD) based on the CISLs can improve radiologists’ performance in the diagnosis of lung diseases. Since similarity measure is important for CAD, we propose a multi-level method to measure the similarity between the CISLs. The CISLs are characterized in the low-level visual scale, mid-level attribute scale, and high-level semantic scale, for a rich representation. The similarity at multiple levels is calculated and combined in a weighted sum form as the final similarity. The proposed multi-level similarity method is capable of computing the level-specific similarity and optimal cross-level complementary similarity. The effectiveness of the proposed similarity measure method is evaluated on a dataset of 511 lung CT images from clinical patients for CISLs retrieval. It can achieve about 80% precision and take only 3.6 ms for the retrieval process. The extensive comparative evaluations on the same datasets are conducted to validate the advantages on retrieval performance of our multi-level similarity measure over the single-level measure and the two-level similarity methods. The proposed method can have wide applications in radiology and decision support.
Keywords: Common CT imaging signs of lung diseases(CISL), Medical image retrieval, Lung CT image, Multi-level, Similarity measure
1. Introduction
Lung cancer is the leading cause of cancer death worldwide [1]. In the USA, cancers of lung and bronchus account for about one quarter (27%) of all cancer deaths [2]. Early detection and curative treatment of lung cancers are crucially important to improve the survival of patients. Computer-aided diagnosis (CAD) systems can be used to assist radiologists to identify abnormal lesions from a large number of lung images in an earlier stage for an improvement of cancer identification [3, 4]. Content-based image retrieval (CBIR) can support computer-aided medical image analytics by indexing and mining images that contain similar content [5, 6]. For CBIR, the similarity measure is an important part. We focus and collect the retrieval methods for the medical images. The existing similarity measure methods can be classified into two types based on the used levels.
Single-level similarity methods, such as the visual- and semantic-level similarity methods: some methods measured the visual-level similarity based on the distance metric of visual features. The shorter distances corresponded to higher similarity. To obtain a good performance, they chose the favorable metric according to the descriptors, like the city-block distance [7], the Mahalanobis distance [8], Manhattan distance [9], cosine distance [10], and Euclidian distance [11]. The other methods measured the semantic-level similarity based on the classification information. If two images had the same semantic class, then they were similar. If two images had the different classes, then they were non-similar. They actually converted the similarity measure problem into the classification problem. They used the learning methods or annotation models to get the class of image for retrieval, like the boosted with decision trees and EM clustering [12], neural network [13–15]. support vector machines (SVM) [16–24], k-nearest neighbor (k-NN) [25], linear discriminant analysis (LDA) [26], random forests [27], CCAPairLDA feature learning method [28], a heuristic method [29], fuzzy c-mean clustering [30], deep convolutional neural network [31, 32], controlled vocabulary annotation [33], CMRM and CRM annotation models [34], and the SEMI-SECC annotation method [35].
Two-level similarity methods: texture and boundary features were extracted as the visual features, and an image annotation device was used to obtain semantic features. Based on the visual and semantic features, the combined similarity was computed in a weighted sum for the retrieval of 30 CT images of liver lesions [36]. A boosting framework was proposed for distance metric learning that aimed to preserve both visual and semantic similarities [37], which had higher retrieval accuracy compared with other retrieval methods for mammograms and had a comparable accuracy with the best approach for X-ray images from the ImageCLEF. A new deep Boltzmann machine-based multimodal medical image retrieval method was developed based on the integration of the visual and textual information from medical images [38]. A new fused context-sensitive similarity (FCSS) which fused the semantic and visual similarities as the pairwise similarities and obtained a global similarity through the manifold was proposed for the retrieval of lung CT images [39]. A multi-feature fusion method for the classification of cavity was proposed which fused the mid-level CNN features from the pre-trained model, and the low-level histograms of oriented gradients (HOG) and local binary pattern (LBP) features, and reduced the dimensionality of the fused features using principal components analysis [40].
In the medical field, sometimes the visually similar images have different diseases while the images with the same disease have different appearances. Hence, calculating the similarity by considering the multi-level similarity is useful for the medical image retrieval. However, current similarity measure methods for the medical images involved the one- or two-level similarities. The one-level similarity measure methods could not only drop the potentially useful information but also lose the opportunity of mining the correlated complementary advantage across multiple levels. The two-level similarity measure methods involved the visual- and sematic-level information had been proved to perform better than the single-level-based retrieval method. The attribute-level information can provide an intermediate representation between low-level visual information and the high-level semantic information, for improving the description of object. The use of attribute information in computer vision problems has gained increased popularity in recent years [41, 42]. Besides, because the relevant details of images exist only over a restricted range of scales, it is important to study the dependence of image structure at the level of resolution and to treat images on several levels of resolutions simultaneously [43]. Partially inspired by those, we present our multi-level similarity method, not only considering the visual- and semantic-level information but also fusing the attribute-level information. By maximizing correlated complementary benefits of multi-level description, the proposed method can achieve good retrieval performance of the common CT imaging signs of lung diseases (CISLs). The CISLs are the imaging signs that frequently appear in lung CT images from patients with lung diseases, which are often encountered and widely used in the diagnosis of lung diseases [44].
The contributions of this paper are as follows: (1) We investigate the multi-level similarity for the measure of CISLs. This is significantly different from typical existing methods considering only single- or two-level information. The attribute-level similarity is first fused to maximize complementary benefits across multiple levels for accurate similarity measure of CISLs. (2) Our similarity method is a generic framework in the scope of similarity measure, where some related work can be viewed as an instance of our generic formulation. (3) Extensive comparative evaluations demonstrate the superiority of the proposed multi-level similarity measure method over the other similarity methods on lung image data from human clinical patients.
2. Method
The architecture of the proposed multi-level similarity method (MLS) is shown in Fig. 1. Two main stages are incorporated: (1) training procedure and (2) multi-level similarity retrieval procedure. In the training procedure, the visual representation of the CISLs is extracted, the attribute representation is abstracted by performing the auto-encoder (AE) neural networks, and the semantic representation is achieved by learning with distribution of optimized features (DOF) [45]. According to the multi-level representation of CISLs, the similarities at multiple levels are computed and combined in a weighted sum form as the final similarity. To maximize the correlated complementary benefits of multi-scale similarity, the best weight of each level is obtained according to the smallest ratio of intra-class distance to inter-class distance. In the multi-level similarity retrieval procedure, given a query CISLs, we describe it at multiple levels, involving the visual, attribute, and semantic levels and calculate the multi-level similarity between it and the CISLs in the database. According to the similarities, we rank the CISLs in the database and re-rank for better retrieval performance. In the next sections, we describe the method, MLS, in details.
Fig. 1.
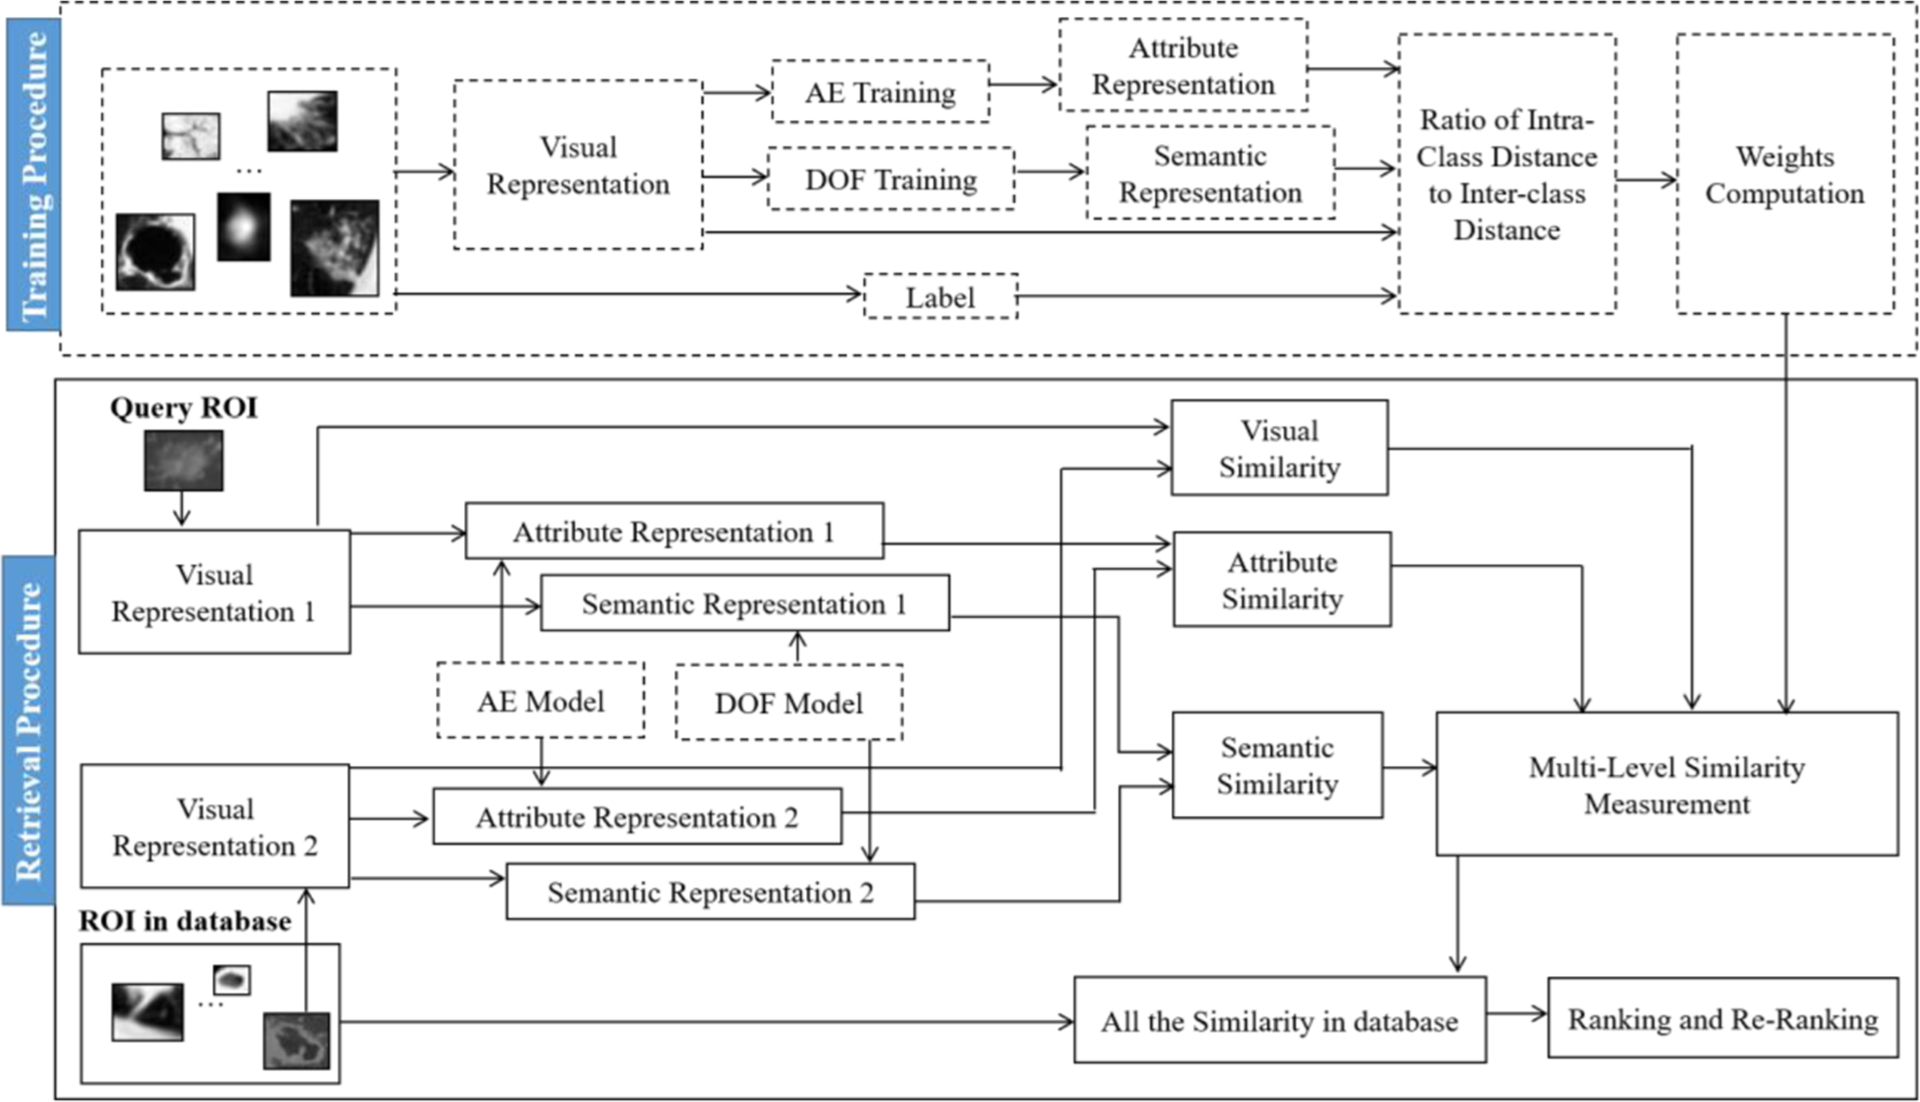
An overview of the proposed multi-level similarity retrieval method
2.1. Multi-level representation
2.1.1. Visual-level representation
To describe the ROI at visual level, we extract multiple types of low-level texture features. We use the local binary pattern (LBP), the wavelet features, the bag of visual words based on the HOG (B-HOG), and the histogram of CT values (CVH).
LBP is gray-scale invariant texture primitive statistic. It produces a binary code by comparing a circularly symmetric neighborhood with the value of the center pixel and transformed it into an integer. We compute multi-scale LBP features by varying the sample radius and numbers of neighbors.
Wavelet feature is the energy of wavelet-decomposed detail images. It can present the spatial and frequency information effectively. Wavelet feature is a common spectral texture feature, which is calculated from the image transformed into the frequency domain. It can capture localized spatial and frequency information and multi-resolution characteristics effectively. In this paper, by using two-dimensional symlets wave-let, the ROIs are decomposed to four levels. Then the horizontal, vertical, and diagonal detailed coefficients are extracted from the wavelet decomposition structure. Finally, we get the wavelet features by calculating the mean and variance of these wavelet coefficients.
B-HOG is bag of visual words based on the HOG feature. We firstly extract the common HOG feature. We partition a ROI into blocks of 8 × 8 pixels and divide each block into four cells. Then, we compute the orientation histogram for each cell and link the orientation histograms of cells in each block as the HOG feature vector of the block. However, this widely used strategy is not applicable in this work because the size of ROIs in lung CT images varies in different patients and different pathological lesions. Hence, we adopt the bag of visual words on HOG features as the ROI representation. We generate the visual words of lung CT by employing a Gaussian mixture modeling. The HOG feature vector of each block is mapped to the visual word to obtain the B-HOG feature vector.
CVH feature is the histogram of CT values. In lung CT images, the CT values of pixels are expressed in Hounsfield units (HU). We compute the histogram of CT values over each ROI. The number of bins in the histogram is 40 because it can lead to the highest classification accuracy among different numbers [46].
We extract the four different types of features to better character the ROI. Since these features may contain complementary or irrelevant information, we adopt a feature selection method [45] to select the more compact and discriminative features for the description of ROIs at visual level.
2.1.2. Attribute-level representation
Attribute feature is a mid-level knowledge. It is between low-level description and high-level concept. A category often simultaneously exhibits multiple distinct attributes, whereas an attribute can appear in the different categories. We can express inter- and intra-category variations by learning the attribute-based representation. To extract the attribute feature better, we apply auto-encoder (AE), which is one of the deep architecture-based models, to learn the attribute features with a minimum loss of original information.
The AE [47] is an unsupervised neural network that tries to set the values of the target layer to be equal to the inputs. An AE has one visible layer of l inputs, one hidden layer of d units, one reconstruction layer of l units, and an activation function. We illustrate an AE in Fig. 2.
Fig. 2.

Illustration of AE
AE contains two parts, encoder and decoder. Encoder is to map the input X ∈ Rl to the hidden layer and produce the latent activity Y ∈ Rd. Decoder is to map Y to an output layer which has the same size of the input layer and reconstruct X as Z ∈ Rl. We can get the Y and Z by
| (1) |
where w1 and w2 are the weight of input to hidden and the hidden to output, and b1 and b2 are their bias, f(p) is the activation function. In our method, it is a sigmoid function like:
| (2) |
Based on the structure of AE, we use the visual feature as its input and train the network by iteratively updating the weights and biases to minimize the error between input and reconstruction. After obtaining the trained network, the reconstruction layer with its parameters is removed. The learned features that lie in the hidden layer are the deeper features. Since the deeper features can be reconstructed into the input, they can be viewed as an abstract of input and each feature can be viewed as a necessary part of the abstract. Hence, we use the deeper feature as the attribute feature. We determine the dimension of attribute feature, which is the value of d, according to the minimum error between the visual feature (input) and reconstructed feature (output).
2.1.3. Semantic-level representation
The semantic features are considered high-level clinical information in contrast with the low-level visual features and mid-level attribute features. It can express the semantically meaningful clinical knowledge. We automatically extract the semantic feature by training visual features into semantic concepts based on the learning method, DOF [45].
DOF is a hierarchical learning method. It can divide the images into k groups according to their distribution of features, and train a classifier in each cluster, then it fuses the several classifiers with different distributions for the final classification decision. Since the same CISL may have different distributions and same distribution may exist in the different CISLs, it is desirable to decompose the features into classes with different distributions and DOF is effective for the classification of CISLs.
We adopt the DOF to achieve the probability of belonging to each semantic concept and link them into a vector as the semantic feature.
2.2. Multi-level similarity
In this paper, we regard the visual feature as a signal, and the AE and DOF are used to represent more abstract information to achieve the multiple level-space information. We combine them together for the MLS measurement. Let x, y be two samples, VF(x), VF(y), AF(x), AF(y), SF(x), and SF(y) be their visual feature, attribute feature, and semantic feature, respectively. We use Euclidean distance as their similarity measure, represented by EV(x, y), EA(x,y), and ES(x, y). They are calculated by
| (3) |
where VL, AL, and SL are the dimension of feature vectors at the three levels, respectively. We then fuse them together to obtain the MLS measure, like
| (4) |
where wV, wA, and wS are the weights of similarity measure at different levels.
A similarity measure is good if it can minimize the intra-class distance and maximize the inter-class distance. We define a vector (wV, wA, wS) as the weight vector (w). We calculate the average distance between any two samples with the same category Ci as the intra-class distance in the class i with w:
| (5) |
where MLS(li, lj, w) is the multi-level similarity value of the two samples li and lj belonging to the same category Ci under a specific w and is the number of samples in the category Ci.
Then, we compute the inter-class distance between the class Ci and class Cj with w like:
| (6) |
where and are the number of samples in the category Ci and Cj.
Hence, if we have C classes, we choose the best weight vector w* according to the smallest ratio.
| (7) |
Our similarity method is a generic framework in the scope of similarity measure. Not only the visual-, attribute-, and semantic-level representation can be self-defined according to different tasks but also the similarity measure at each level can use any distance metric to replace the Euclidean distance in this paper. In addition, the different similarity frameworks can be generated by adjusting the weights, as shown in Eq. (4). If we set the wA and wS to be zeros and wV to be 1, then MLS(x, y) = EV(x, y). It means our similarity measure method is one of the visual similarity measure method. If we set wV and wA to be zeros and wS to be 1, then MLS(x, y) = ES(x, y). Our method is one of semantic similarity measure method. If we set wA to be zeros, we can obtain a combination of visual and semantic similarities. Hence, we can formulate different frameworks by adjusting the weights.
2.3. Property of MLS
A set of fundamental requirements was given for a distance measure [48]. Let X and Y be the two samples, we will prove that our similarity measure meets the basic requirements.
Property 1 Non-negativity:
The distance between X and Y is always a value which is greater than or equal to zero.
| (8) |
Because our distance measure method is the weighted sum of three Euclidean distances and each Euclidean distance value is certainly not negative because of the definition in Eq. (3), our distance value is bigger than or equal to zero for sure.
Property 2 Identity of indiscernibles:
The distance between X and Y is equal to zero if and only if X is equal to Y.
| (9) |
We use reductio ad absurdum. Suppose X is not equal to Y, then the Euclidean distance value between X and Y is larger than zero. Since the weight of any Euclidean distance is a positive number, the product of the Euclidean distance and its weight must be a positive number. So that the value of MLS(X,Y) must be a positive number, contrary with the hypothesis that the value of MLS(X,Y) is zero. Accordingly, since the initial commensurability assumption engendered a contradiction, we have no alternative but to reject it. Therefore, if the MLS between X and Y equals zero, then X must equal Y.
Property 3 Symmetry:
The distance between X and Y is equal to the distance between Y and X.
| (10) |
Since Euclidean distance is the square root of the sum of the paired differences squared, it is symmetrical. So the sum of weighted Euclidean distance is still symmetrical. Hence, MLS satisfies the symmetry requirement.
Property 4 Triangle inequality:
The distance between X and Z is smaller than or equal to the sum of the distance between X and Y and the distance between Y and Z.
| (11) |
Let E(X, Y) be the Euclidean distance of X and Y. Since Euclidean distance satisfies the triangle inequality [49], so E(X, Z) ≤ E(X, Y) + E(Y, Z). Accordingly, MLS(X, Z) is derived as follows:
| (12) |
Hence, MLS satisfies the triangle inequality requirement.
2.4. CISL retrieval based on MLS
The CISLs are the well-known categories of CT imaging signs of lung diseases that frequently appear in patients’ lung CT images and play important roles in the diagnosis of lung diseases. The nine categories of CISLs have been summarized by radiologists, including ground-glass opacity (GGO), lobulation, cavity and vacuolous (CV), spiculation, pleural indentation (PI), obstructive pneumonia (OP), calcification, air bronchogram (AB), and bronchial mucus plugs (BMP) [44]. Although this taxonomy is not complete, these CT image signs are often encountered in the lung CT images and are widely used by radiologists for the diagnosis of lung diseases. The nine categories of CISLs are illustrated in Fig. 3.
Fig. 3.
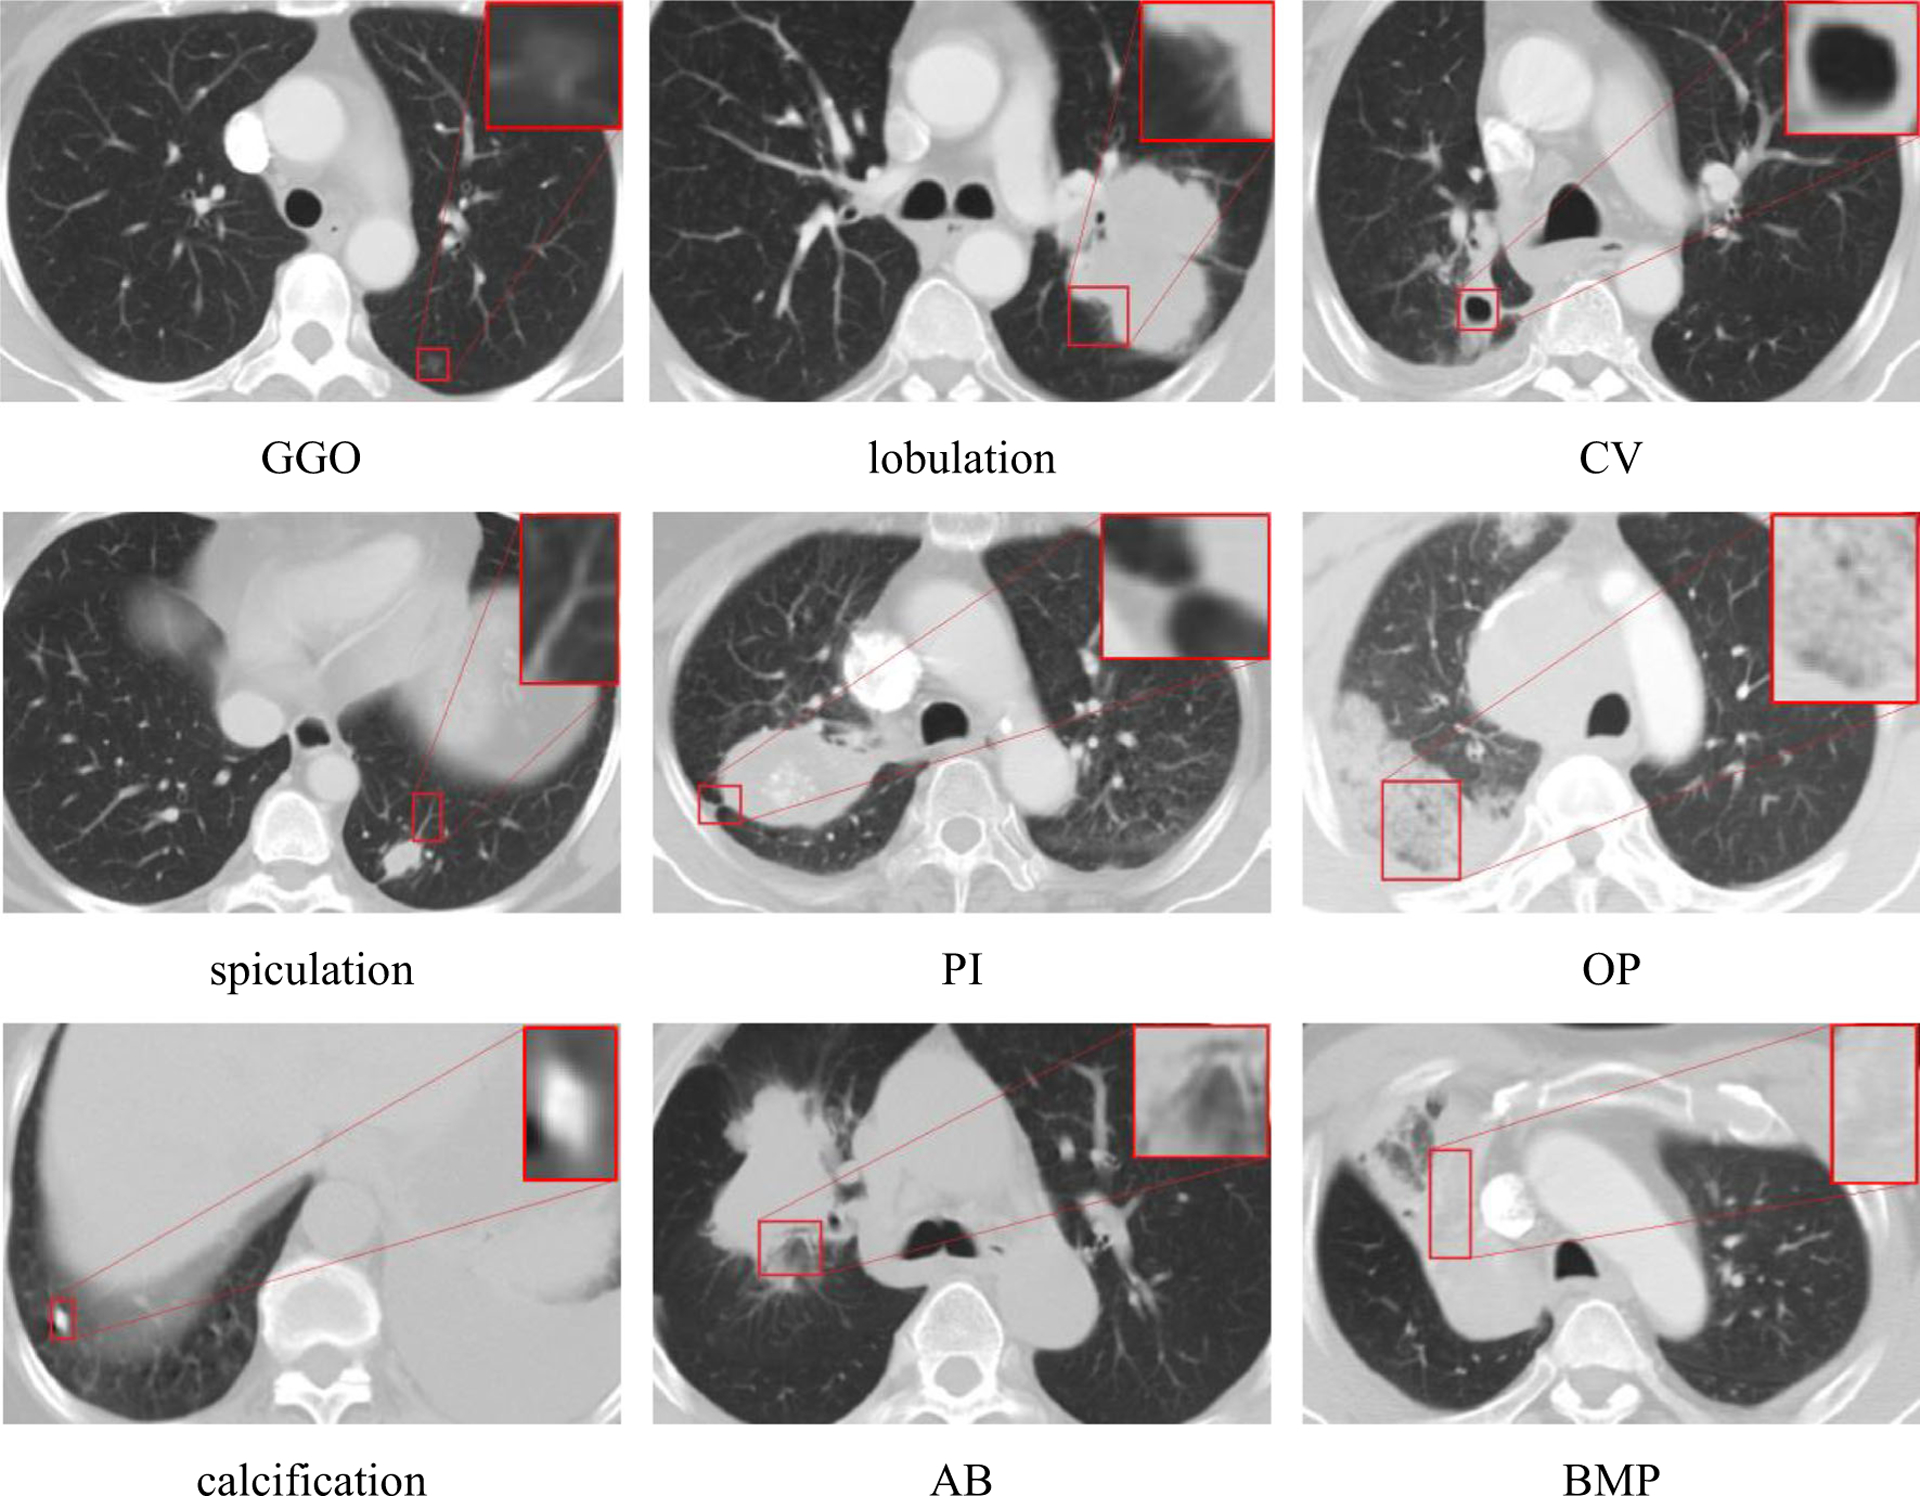
The instances of nine CISLs categories; the smaller rectangular boxes in lung CT images are magnified to show the details of the images
In this paper, we apply the proposed MLS similarity measure method to search the similar CISLs in the regions of interest (ROIs) in lung CT images. Given a query ROI, the multi-level similarity between the query ROI and the ROIs in the database can be calculated. Based on the similarity, the retrieved images are ranked. After receiving the initial results, the re-ranking process based on relevance feedback from users is executed to reorder the initially retrieved images for more accurate retrieval. The users provide the relevance feedback by specifying the retrieved image is relevant or irrelevant. The relevant images are taken as the query images to search the similar images and the most frequent retrieved images will replace the irrelevant images marked by users. The re-ranking process can further refine the retrieval results to improve the retrieval performance.
3. Results
3.1. Databases
The instances of nine categories of CISLs were collected from clinical patients in the Cancer Institute and Hospital at Chinese Academy of Medical Sciences. The lung CT images were acquired by CT scanners of GE LightSpeed VCT 64 and Toshiba Aquilion 64 and saved slice by slice according to DICOM 3.0 standard. The slice thickness is 5 mm, the image resolution is 512 × 512, and the in-plane pixel spacing ranges from 0.418 to 1 mm (the mean is 0.664 mm). The rectangular 2D ROIs wrapping CISLs in lung CT images are manually annotated by a qualified radiologist to produce a gold standard. In order to reduce the differences, the radiologist read all the cases twice with a more than 1-month interval to ensure the effectiveness of the recheck. The resultant numbers of ROIs are 511. More details about the database can be found in the paper [44]. To conduct fivefold cross-validation experiments, we split the available instances into five disjoint subsets nearly evenly and guarantee that the instances in different subsets come from different patients for avoiding the bias in measuring performance. Table 1 lists the numbers of ROI instances in five data subsets and the numbers of patients for each CISL category, where D1–D5 denote the first to the fifth subsets, respectively, and NoP means the number of patients. Actually, each of the five data subsets is taken as the test set in turn, and the four subsets in the remaining data are the training set.
Table 1.
The distribution of ROIs
| CISL | D1 | D2 | D3 | D4 | D5 | Total | NoP |
|---|---|---|---|---|---|---|---|
| GGO | 9 | 9 | 9 | 9 | 9 | 45 | 25 |
| Lobulation | 9 | 8 | 8 | 8 | 8 | 41 | 21 |
| Calcification | 10 | 10 | 9 | 9 | 9 | 47 | 20 |
| CV | 30 | 30 | 29 | 29 | 29 | 147 | 75 |
| Spiculation | 6 | 6 | 6 | 6 | 5 | 29 | 18 |
| PI | 16 | 16 | 16 | 16 | 16 | 80 | 26 |
| AB | 5 | 5 | 5 | 4 | 4 | 23 | 22 |
| BMP | 17 | 16 | 16 | 16 | 16 | 81 | 29 |
| OP | 4 | 4 | 4 | 3 | 3 | 18 | 16 |
| Total | 106 | 104 | 102 | 100 | 99 | 511 | 252 |
3.2. Evaluation criteria
To evaluate the retrieval performance of the proposed similarity measure, we adopt the most commonly used p@n(q) and Precision-Recall Graph (PR Graph) as the evaluation criterion.
- Let p@n(q) be the precision at position n, which measures the proportion of the relevant samples in the n returned samples for the query q. It is determined by
where rele(q, i) indicates the relevancy between sample q and the ith-returned sample:(13) (14) PR Graph is a line graph plotted from the precision-recall values. Precision is the fraction of retrieved images that are relevant, while recall is the fraction of relevant images which have been retrieved.
3.3. Parameter tuning
The two kinds of parameters in our approach are set up through experiments. The first parameter is the number of attribute feature. The second one is the best weights of similarities at multiple levels.
3.3.1. The number of attribute features
We have extracted the 180-dimension visual features and selected the discriminative visual features with 92-D, 139-D, 78-D, 69-D, and 83-D, respectively, in each round of fivefold cross-validation experiments. Then we test the number of attribute features gotten by AE from 10 to NF-10, where NF is the dimension of discriminative visual features. We record the mini-batch mean-squared error on training set with a different number in fivefold evaluation and show them in Fig. 4. In Fig. 4, we choose 38, 23, 29, 11, and 41 as the number of attribute features in the five rounds of experiments according to the minimum error. We can see that the dimensions of the attribute features are between the dimension of the visual feature and the dimension of the semantic feature, which again indicates that the AE can obtain the abstract representation in the mid-level scale.
Fig. 4.
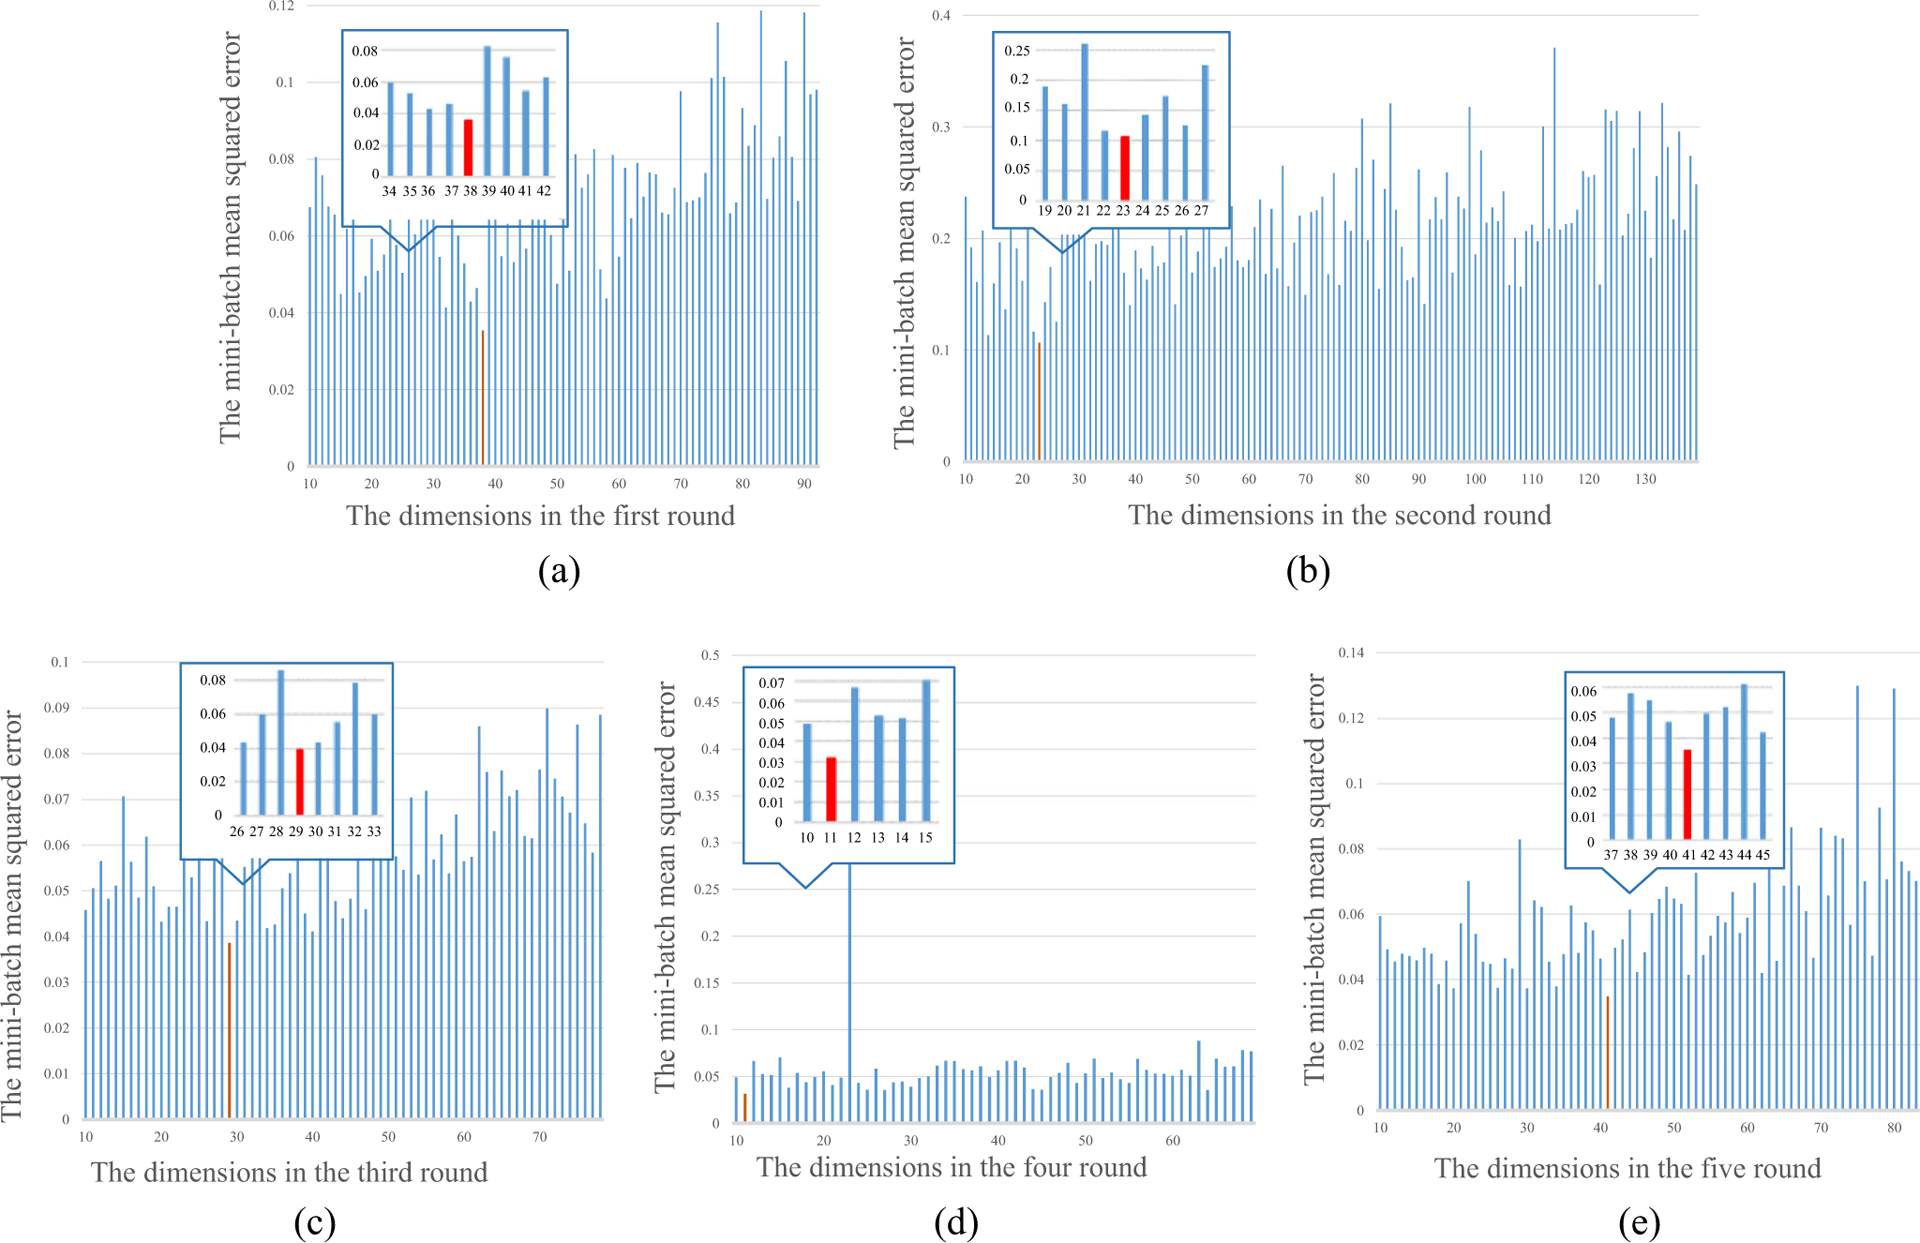
The mini-batch mean-squared error with the different dimensions of attribute features in fivefold evaluation
3.3.2. The weights at the multiple levels
We perform a grid search on the training data to select the optimal weights over the range of {0.1, 0.2, 0.3… 0.9, 1} and under the condition of their sum equaling 1. We compute the ratios of intra-class distance to inter-class distance based on the different weights and show the average results in Fig. 5, where x-axis and y-axis labels indicate the weights of wVand wA, and z-axis indicates the ratio of intra-class distance to inter-class distance corresponding to the wV and wA. In order to ensure that each level similarity can work, the value of each weight must be greater than or equal to 0.1 and less than or equal to 0.8. Since the sum of wV, wA, and wS is 1, we just show the wVand wA because wS can be calculated by 1 − wV − wA. According to Eq. (7), we choose the (0.1, 0.1, 0.8) as the weight of visual, attribute, and semantic similarities, because it can make the ratios to be the smallest one. We use the red point to show it, and it was used in the following fivefold cross-validation experiments, respectively.
Fig. 5.
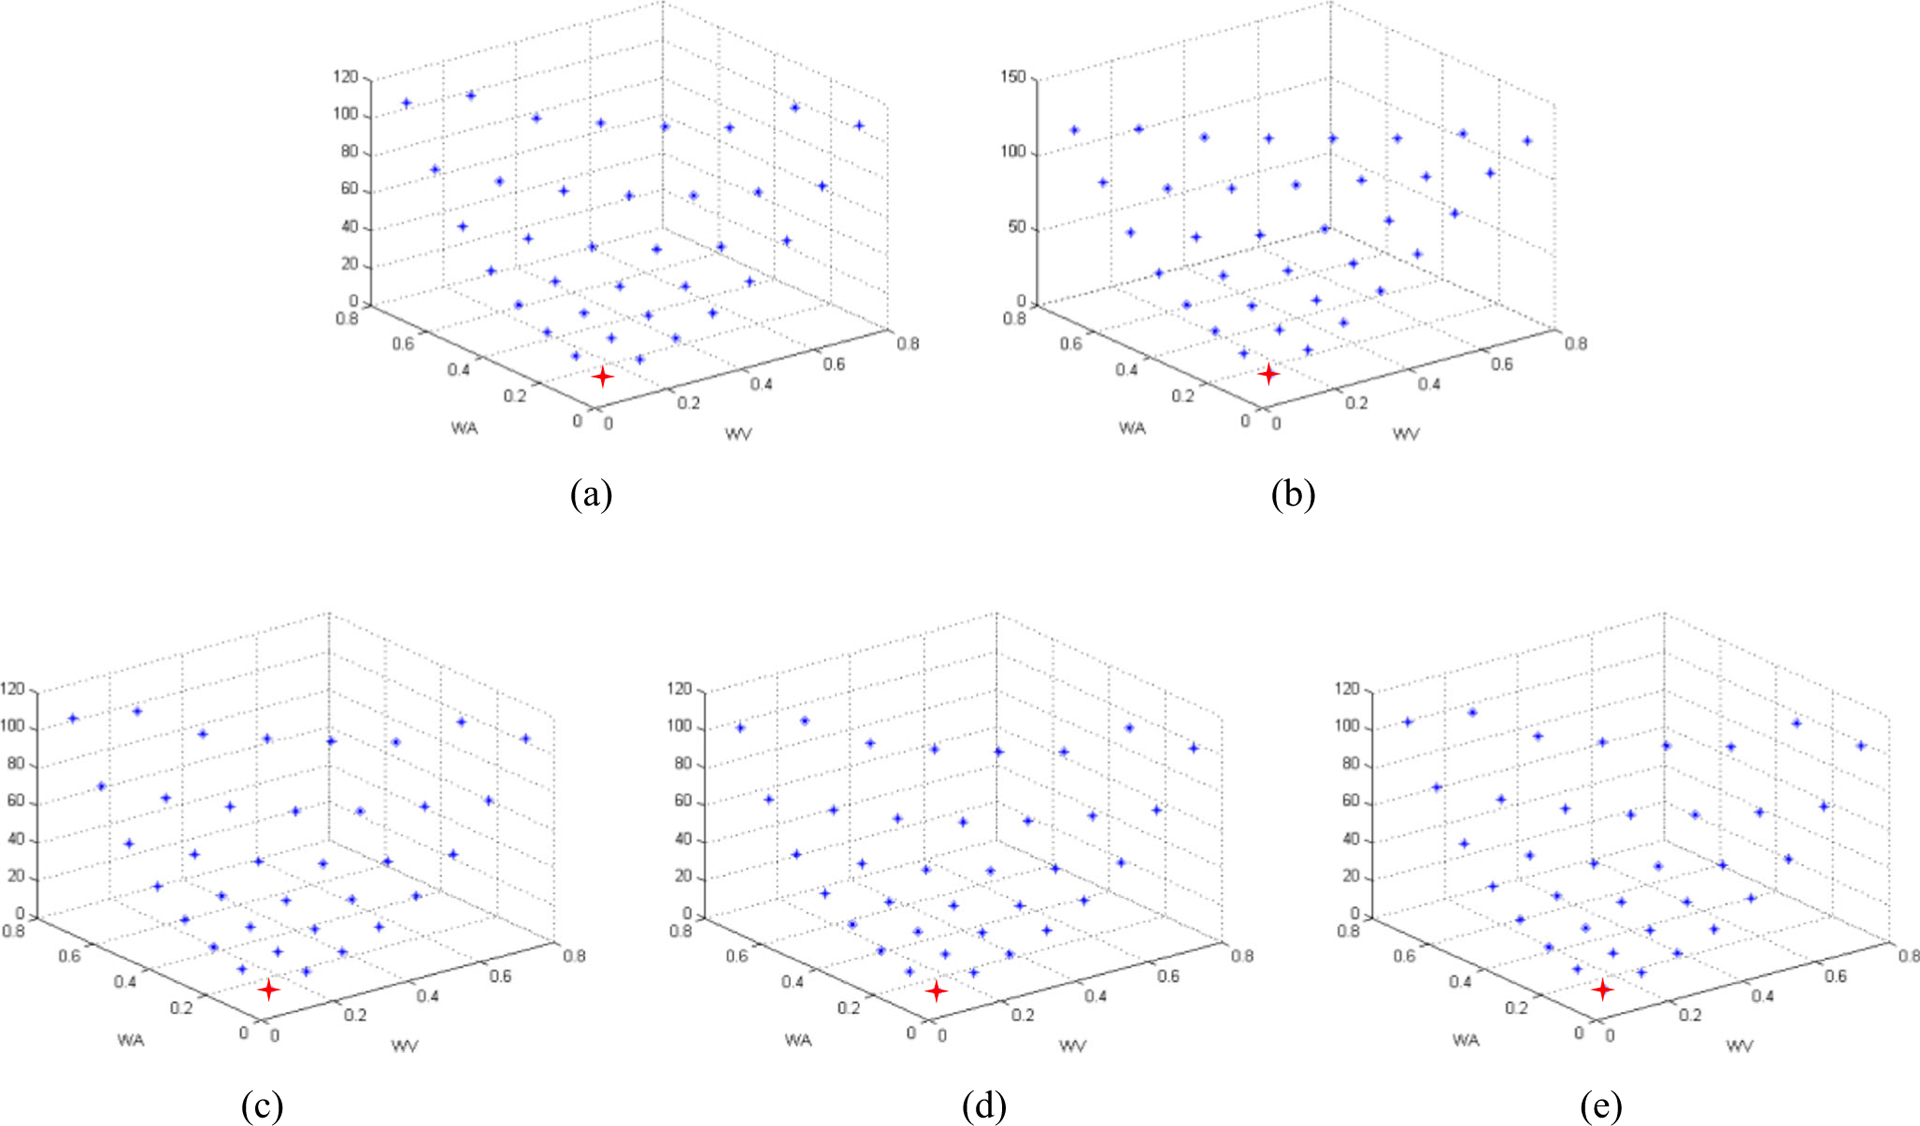
The ratios of intra-class distance to inter-class distance based on the different weights of the visual similarity (wV) and attribute similarity (wA) in the fivefold cross-validation experiments
3.4. Experiment results
We use the pre-designated training data for the model training, the acquirement of the multiple-level information, and the selection of optimal parameters. Then, on the pre-designated testing set, we evaluate the retrieval performance of the proposed MLS method.
3.4.1. Retrieval performance
We use the pre-designated testing data as a search system. We select every example in the testing database as a query example and search the similar examples in the search system. We show the average p@n at each of ten top ranks from one to ten for the similarity measure based on the proposed MLS in the five founds in Table 2. In Table 2, we can see our precision can achieve 100% when returning to one image. As the number of returned images increases, the precision reduces. When returning ten images, the MLS-based search method still obtains a precision of more than 74%. Therefore, we can say that the proposed MLS similarity measure method is effective.
Table 2.
The average p@n values from 1 to 10 obtained by MLS in five founds
| Founds top n | 1 | 2 | 3 | 4 | 5 |
|---|---|---|---|---|---|
| 1 | 1.0 | 1.0 | 1.0 | 1.0 | 1.0 |
| 2 | 0.930 | 0.931 | 0.948 | 0.956 | 0.965 |
| 3 | 0.900 | 0.888 | 0.915 | 0.935 | 0.931 |
| 4 | 0.878 | 0.844 | 0.906 | 0.913 | 0.911 |
| 5 | 0.862 | 0.826 | 0.898 | 0.895 | 0.887 |
| 6 | 0.850 | 0.812 | 0.888 | 0.882 | 0.875 |
| 7 | 0.829 | 0.792 | 0.872 | 0.874 | 0.860 |
| 8 | 0.816 | 0.774 | 0.860 | 0.862 | 0.850 |
| 9 | 0.803 | 0.754 | 0.831 | 0.830 | 0.828 |
| 10 | 0.778 | 0.747 | 0.808 | 0.806 | 0.800 |
3.4.2. Effectiveness of MLS
On the one hand, to prove the advantage of multi-level similarity, we perform the retrieval task using the similarity measure with different levels, including the single level, two levels, and our three levels. We record the p@n at each of the ten top ranks over the fivefold cross-validation and show the average p@n in Fig. 6. In Fig. 6, MV, MA, and MS mean the similarity measure with only visual, attribute, and semantic levels, respectively, MVA, MVS, and MAS mean the similarity measure with two levels, visual and attribute levels, visual and semantic levels, and attribute and semantic levels, respectively, and MLS is our similarity method, representing the similarity measure with multiple level together. In Fig. 6, we can see that the similarity methods involved two levels perform better than those involving one level. MVA obtains higher precision at any position n from one to ten than MVand MA. MVS and MAS greatly improves the precision when n is smaller than six compared with MS but perform worse when n is bigger than 6. It illustrates that the similarity measure with two levels is sensitive to the number n and could gain unstable improvement compared with the similarity measure with one level, although it can obtain more information. Our MLS method by involving three levels can achieve the best result no matter what n is, which proves our similarity method can give a good and robust retrieval result for CISLs.
Fig. 6.
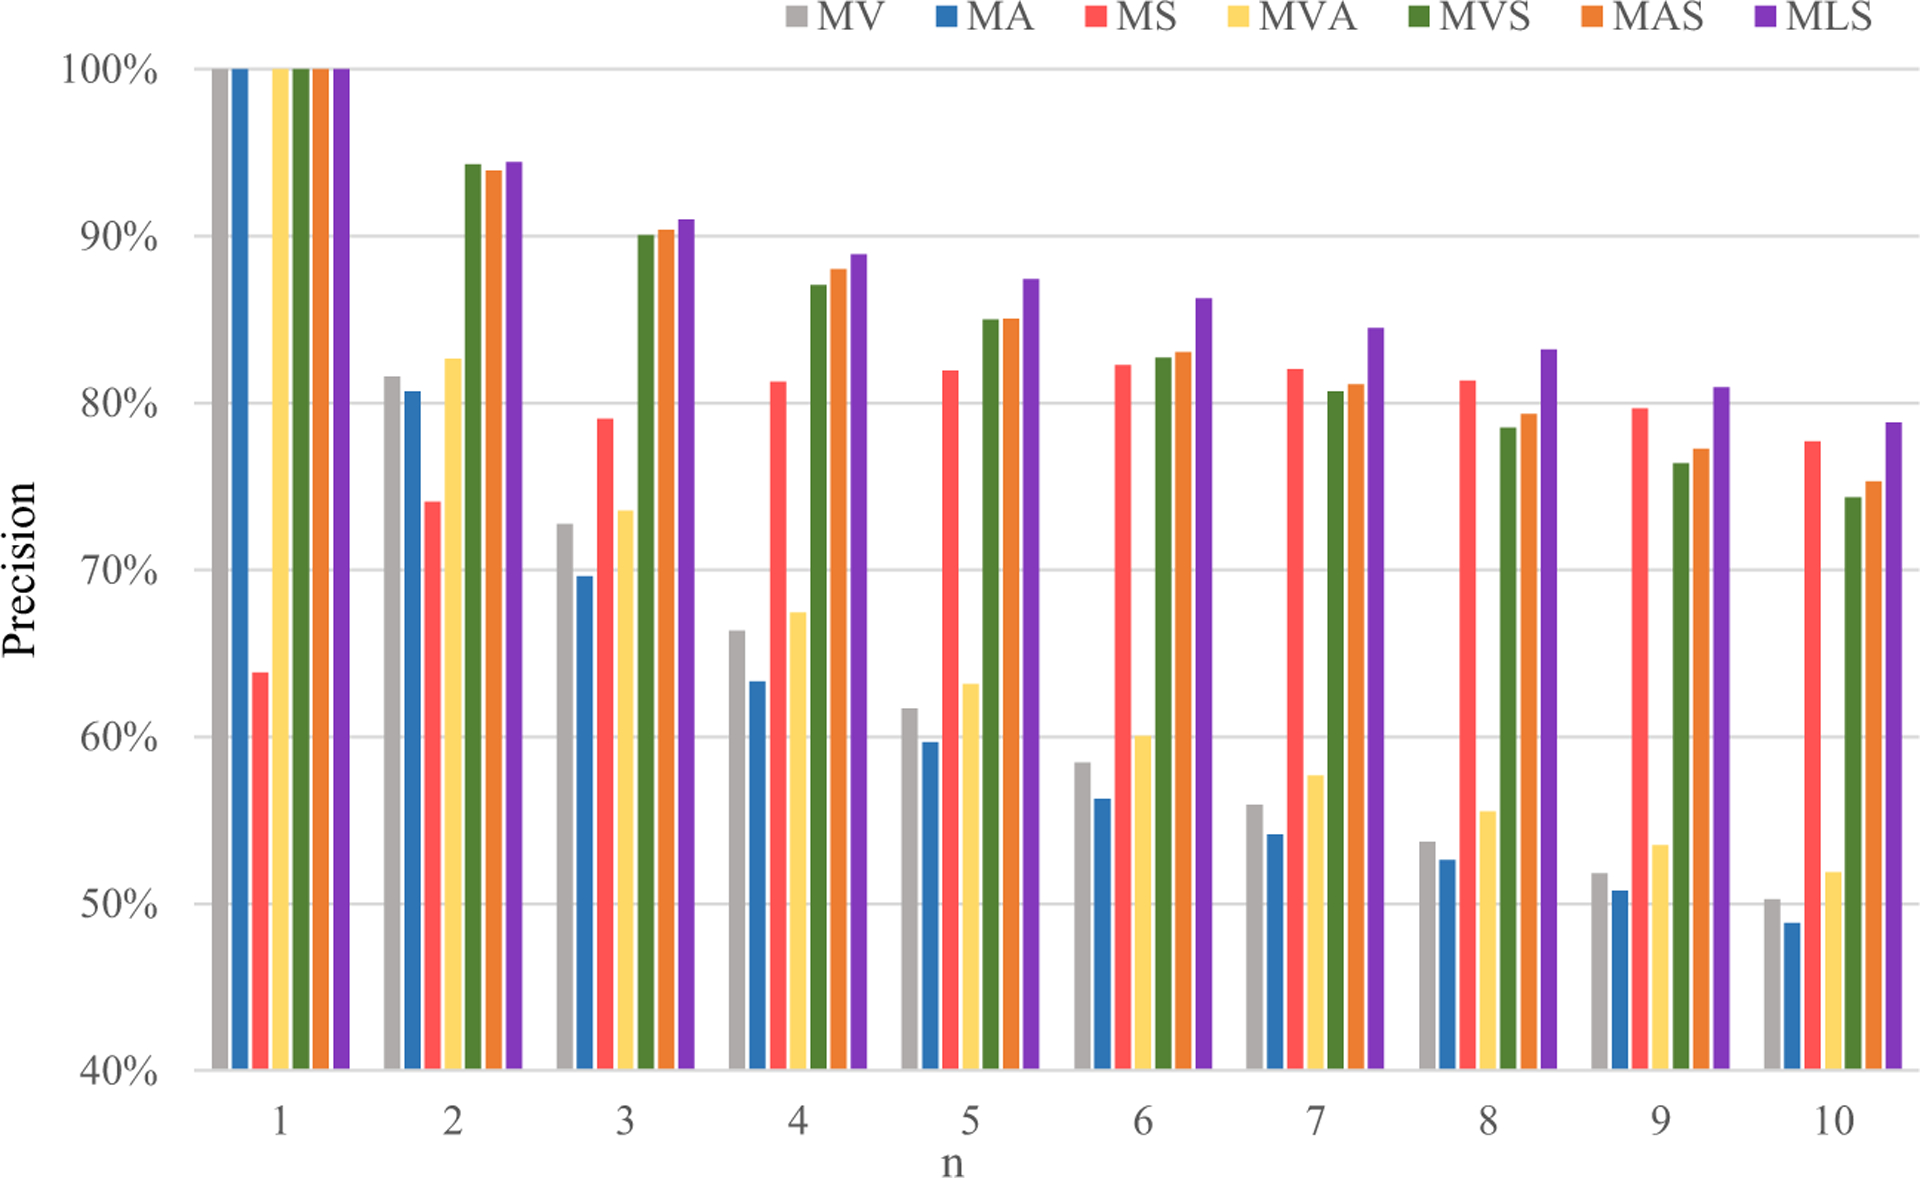
Average p@n values obtained by the similarity measure with the single level (MV, MA, and MS), two levels (MVA, MVS, and MAS), and our multiple levels (MLS)
On the other hand, we compare our proposed MLS with the state-of-the-art retrieval method of CISLs, FCSS [39], which is one of the two-level similarity method, to highlight the effectiveness of our MLS method.
Firstly, we compute the average p@n at each of the ten top ranks for the method FCSS and our MLS. The results are shown in Fig. 7. In Fig. 7, we can see our MLS method by involving three levels which can achieve a significant improvement in retrieval precision. The highest increase rate brought by our MLS is 29.8% compared with FCSS.
Fig. 7.
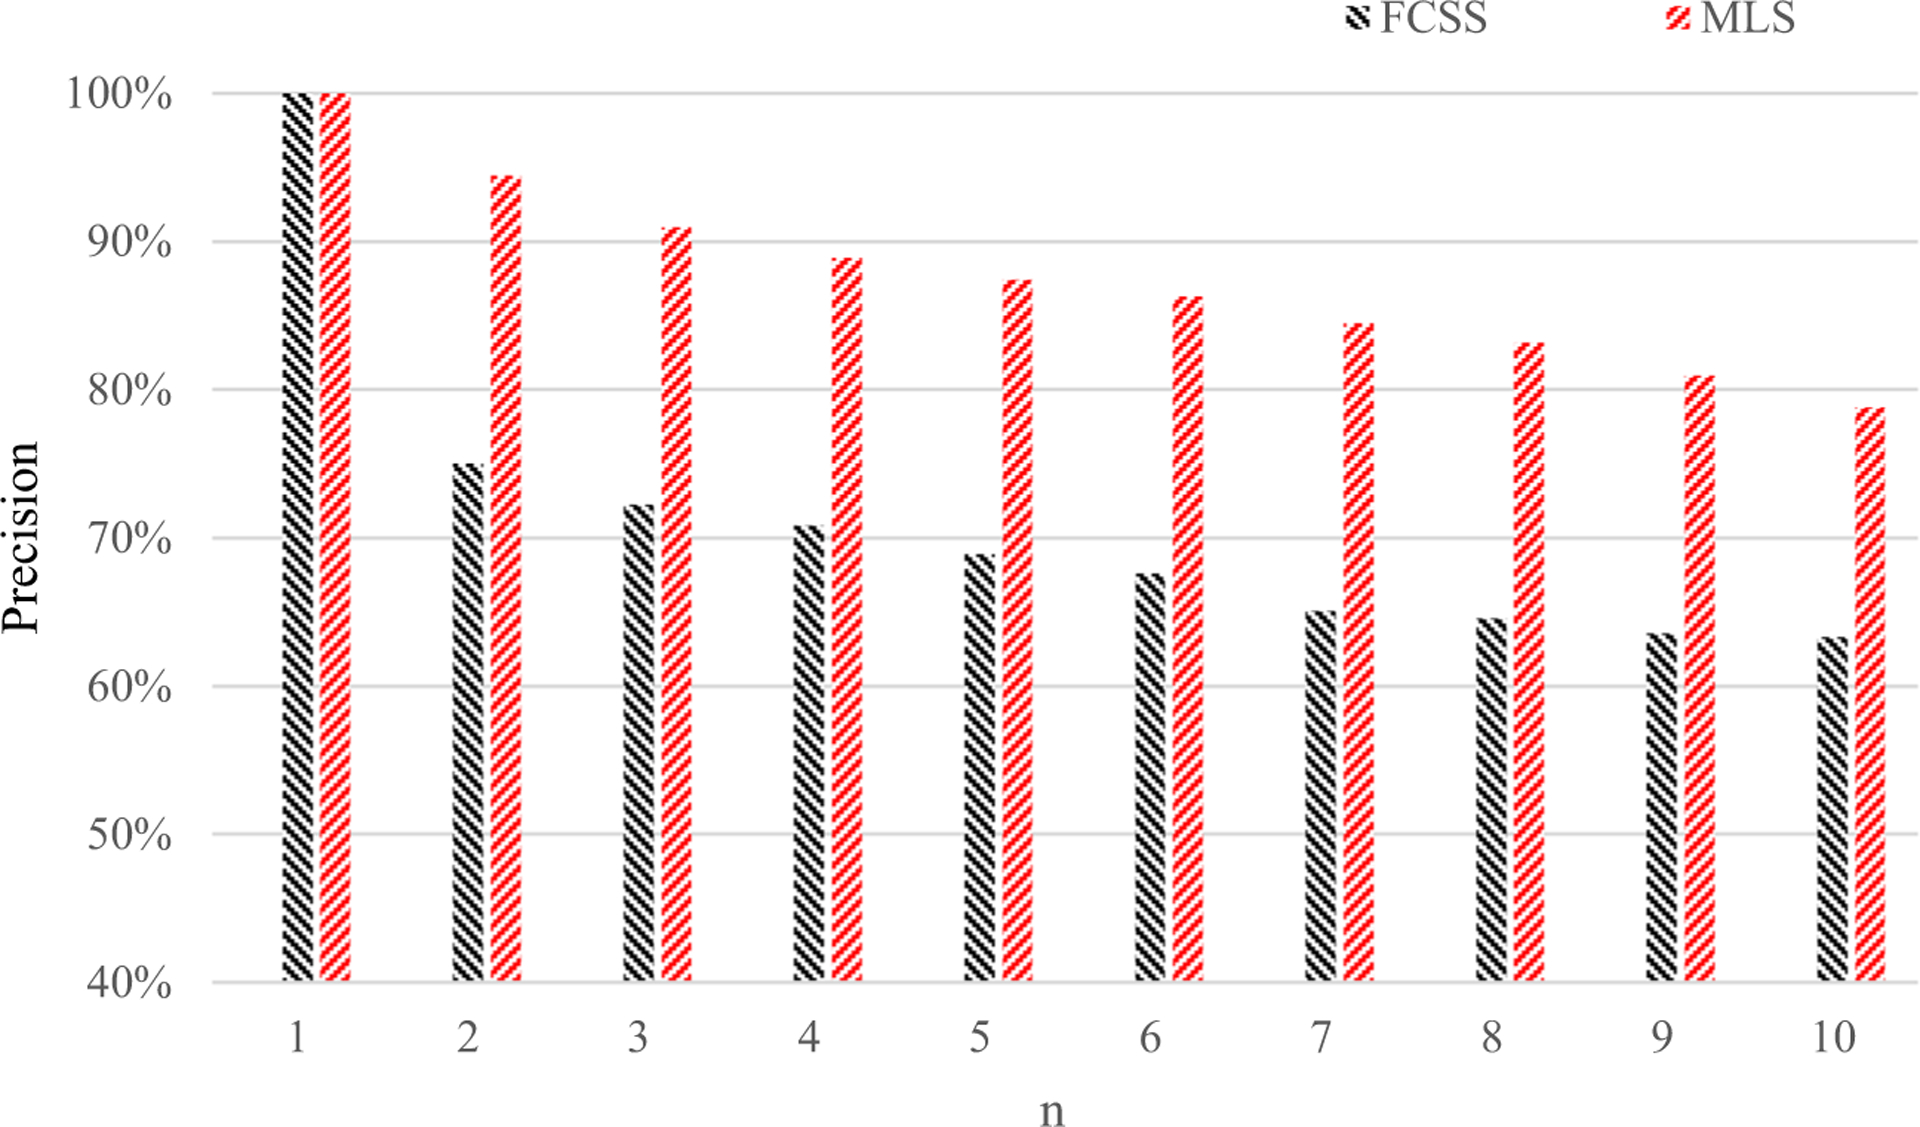
Average p@n values by our method MLS and the compared method FCSS [39]
Secondly, we give the PR graphs for our MLS and the FCSS [39] in Fig. 8, where the solid red curve represents the PR curve obtained by our MLS and the dotted black curve represents the PR curve obtained by FCSS. In Fig. 8, we can see that the PR curve of our MLS involving multiple levels is higher than FCSS. We compute the areas under these curves (AUC) for these methods. Our AUC is 0.71, which is significantly higher than the 0.49 obtained by FCSS. It proves our method by combining multiple levels which can give better retrieval performance again.
Fig. 8.
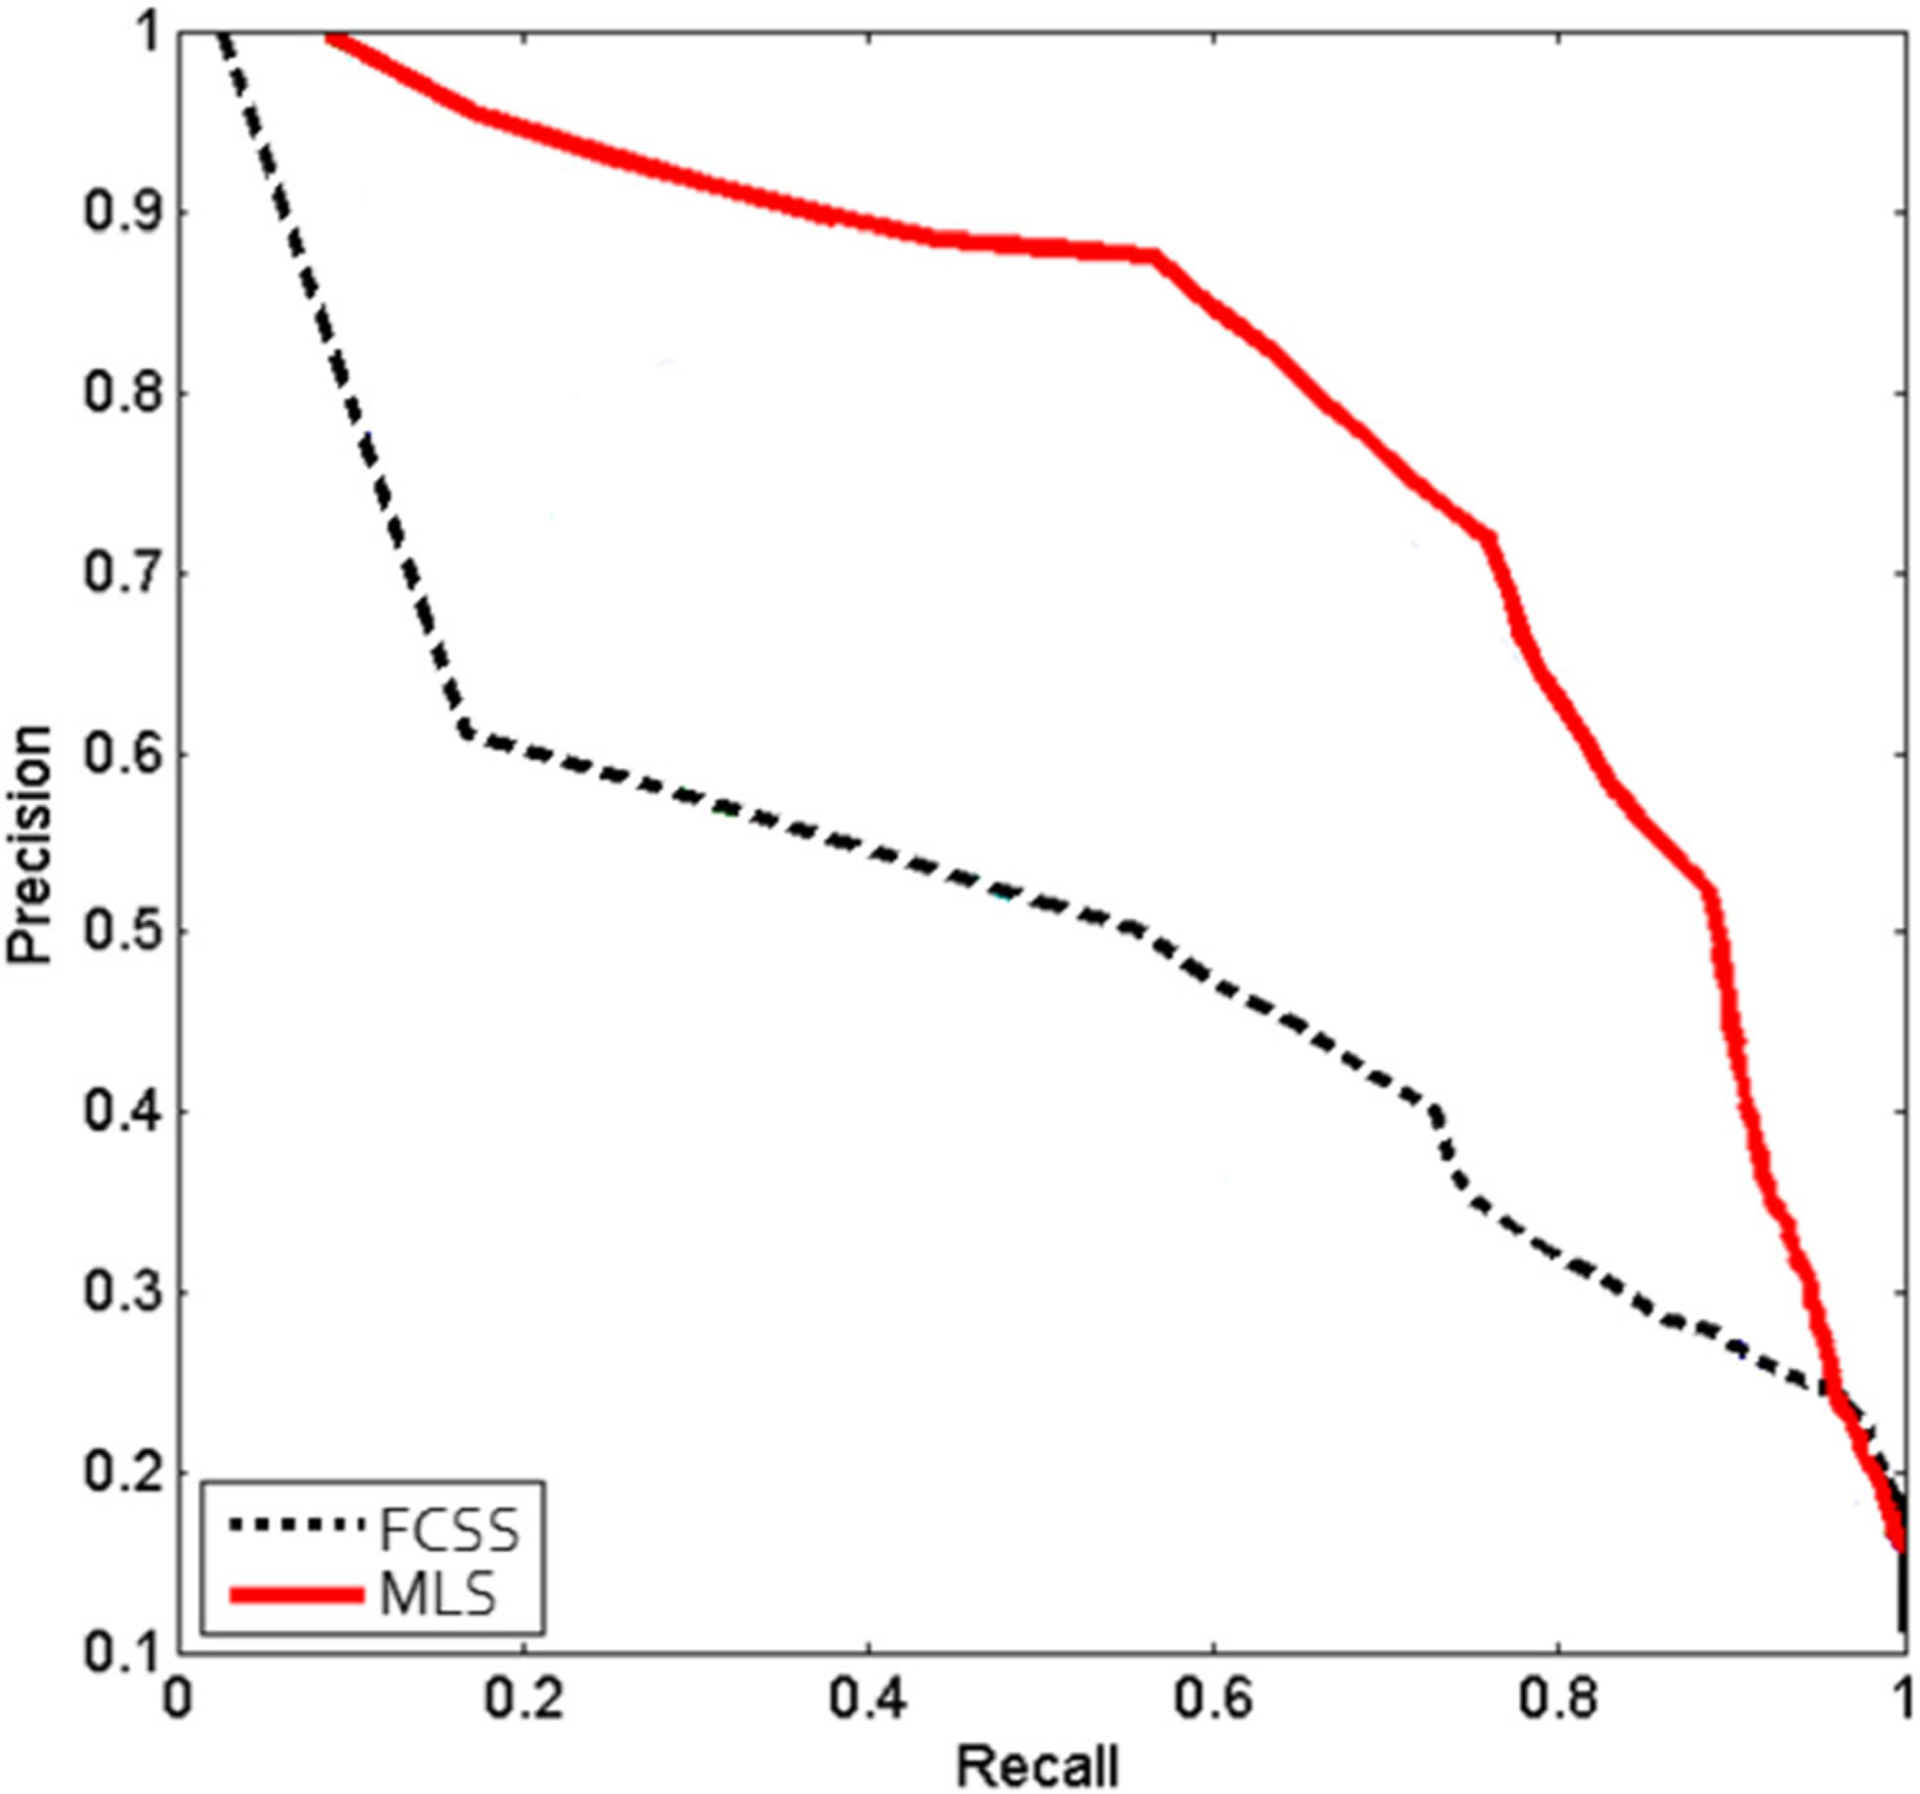
PR graph from our MLS and the compared method FCSS
Lastly, we give the retrieval results for two query examples by using the compared method FCSS and our MLS. We show the top 10 retrieval results in Fig. 9, where the red boxes indicate irrelevant images and the others are relevant. In Fig. 9, we can see that FCSS and our MLS can search the most similar images successfully. However, FCSS is sensitive to the visually similar images, such as the returned eighth image for the first query image whose category is GGO. Although the returned eighth image has an extremely similar appearance with GGO, its category is calcification. FCSS makes the wrong decision. Since MLS can comprehensively consider the attribute information and semantic information, it can ignore those just visually similar images and obtain more accurate similarity measure. In addition, because of the advantage of the MLS, it can search the images with the same category and with different appearances with the query image, such as the top eighth image for the second query example. These results indicate that our proposed MLS can improve the retrieval performance by involving the multiple levels.
Fig. 9.
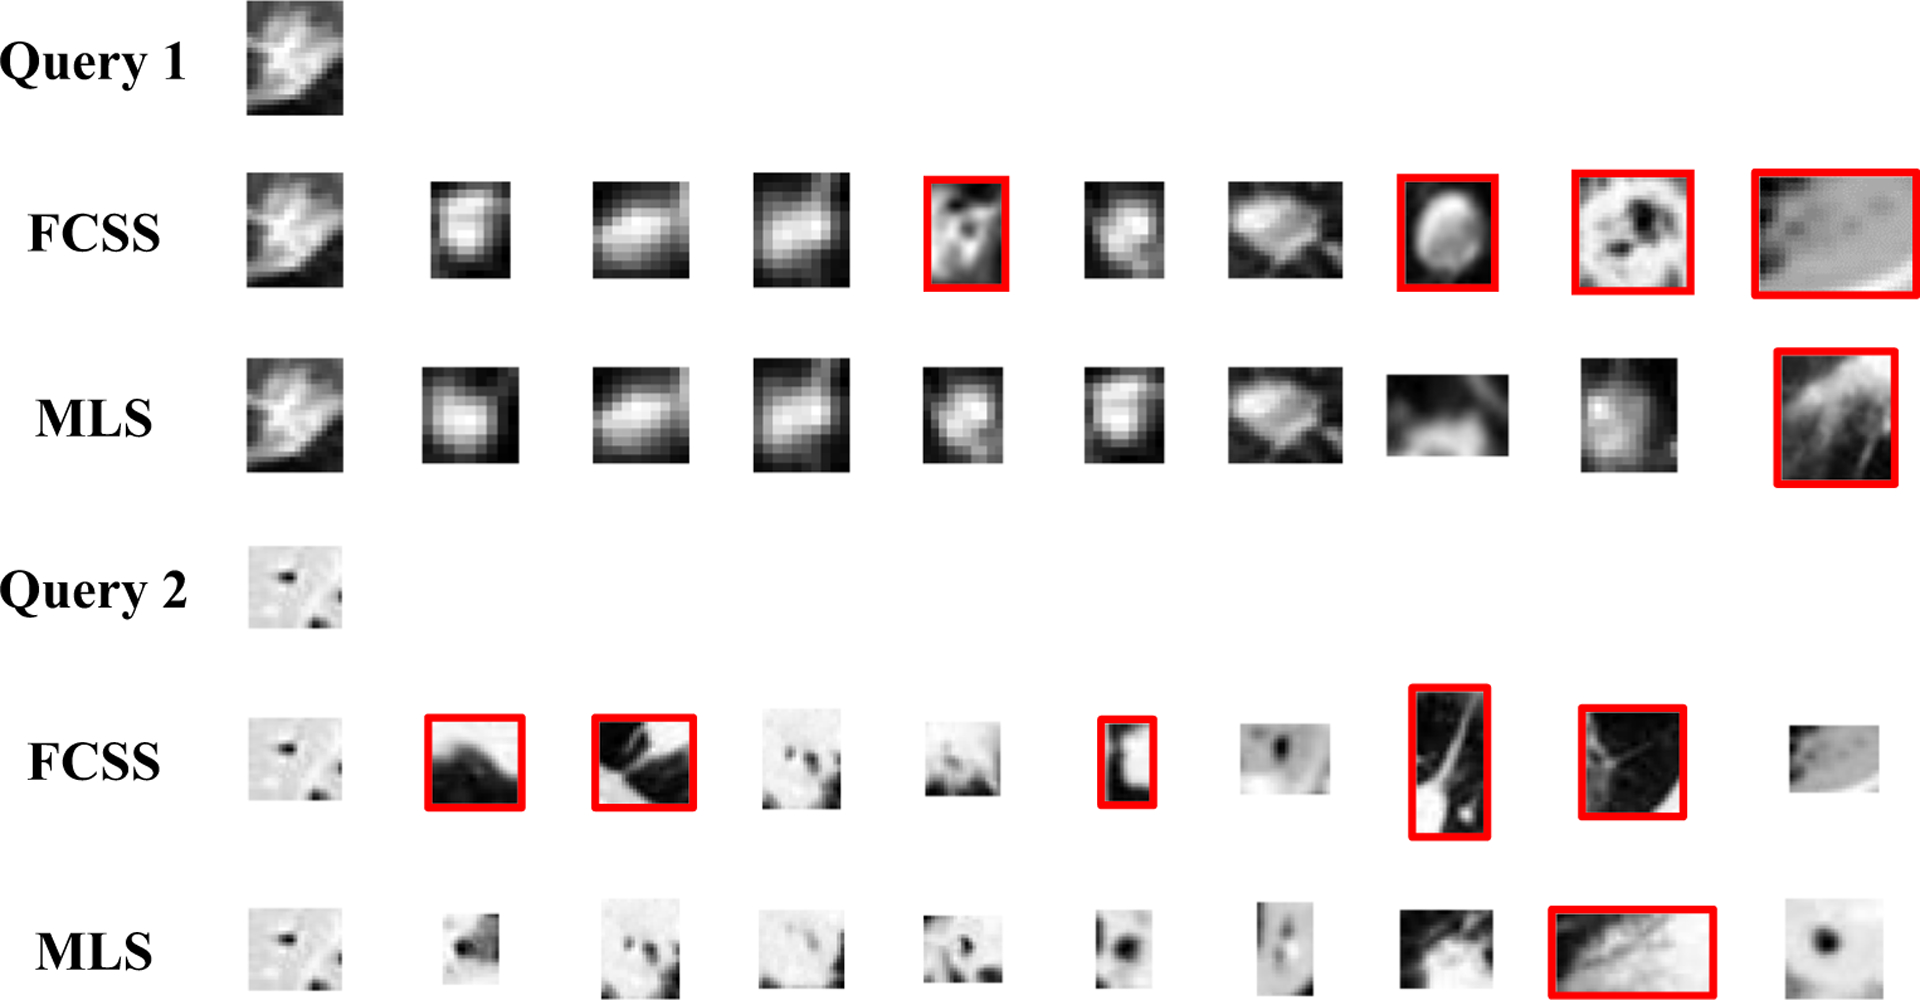
Retrieved top 10 similar images for given query image using our method MLS and the compared method FCSS, where the red boxes indicate irrelevant images and the others are relevant
3.4.3. Efficiency of MLS
To see the efficiency of our similarity method, we compute the running time for our similarity method involving multiple levels. In order to reduce retrieval time, the images in the database are characterized at the multiple levels in the offline stage. We implement our method in MATLAB codes in a Windows 7 desktop with 32 GB RAM and 3.40 GHz processor and record the running time for a query image including the multi-level representation time, the pair-wise multi-level similarity computation time, and the total ranking time in our CISL database in Table 3. It takes about 3 ms to represent one query ROI. The pair-wise similarity measure between the query ROI and ROI in the database takes about 0.0057 ms. Since the ROIs in the database have been represented in advance, the retrieval time is the sum of multi-level representation time for query ROI (3 ms) and the similarity measure time for query ROI and each ROI in the database (0.6 ms because there are about 100 ROIs in our database). Hence, given a query ROI, we can obtain the retrieval results on our database in 3.6 ms. It means our retrieval time is real time. Moreover, it will become even more efficient if we optimize the code using multi-threading, GPU acceleration, or parallel programming.
Table 3.
The running time (ms) for MLS
| Multi-lcvcl representation (ms) | Similarity measure (ms) | Total (ms) | ||
|---|---|---|---|---|
| Visual level | Attribute level | Semantic level | ||
| 0.4252 | 0.0087 | 2.6439 | 0.0057 | 3.6 |
3.4.4. Re-ranking performance
To further improve the retrieval performance, the re-ranking process is used to reorder the initially retrieved images to move the relevant images to the top. We give re-ranking results for a query example and show the top 10 retrieval results in Fig. 10. In Fig. 10, the query example is shown in the first row and the initially retrieved top 10 images are shown in the second row. The user provides the feedback that marked the irrelevant images in the red dotted boxes. The user-provided feedback is employed to perform re-ranking, and the re-ranking of the top 10 images is shown in the last row. We can see that all of the ten retrieved images are relevant in the re-ranking results. Those results prove more relevant images could be found with the help of the user feedback, and this re-ranking process can improve the retrieval precision.
Fig. 10.

Retrieved and re-retrieved top 10 similar images for given query image, where the red dotted boxes are marked by user as the irrelevant images and the others are relevant
In addition, we compare the initial retrieval performance and re-retrieval performance, and the top n retrieval precisions are shown in Fig. 11. The re-ranking process can achieve 82% precision in the ten images retrieved and obtain an increase rate of approximately 4%. Since the user feedback can specify which image is relevant or irrelevant, the re-ranking is able to produce better retrieval results, especially when return more than two retrieved images.
Fig. 11.
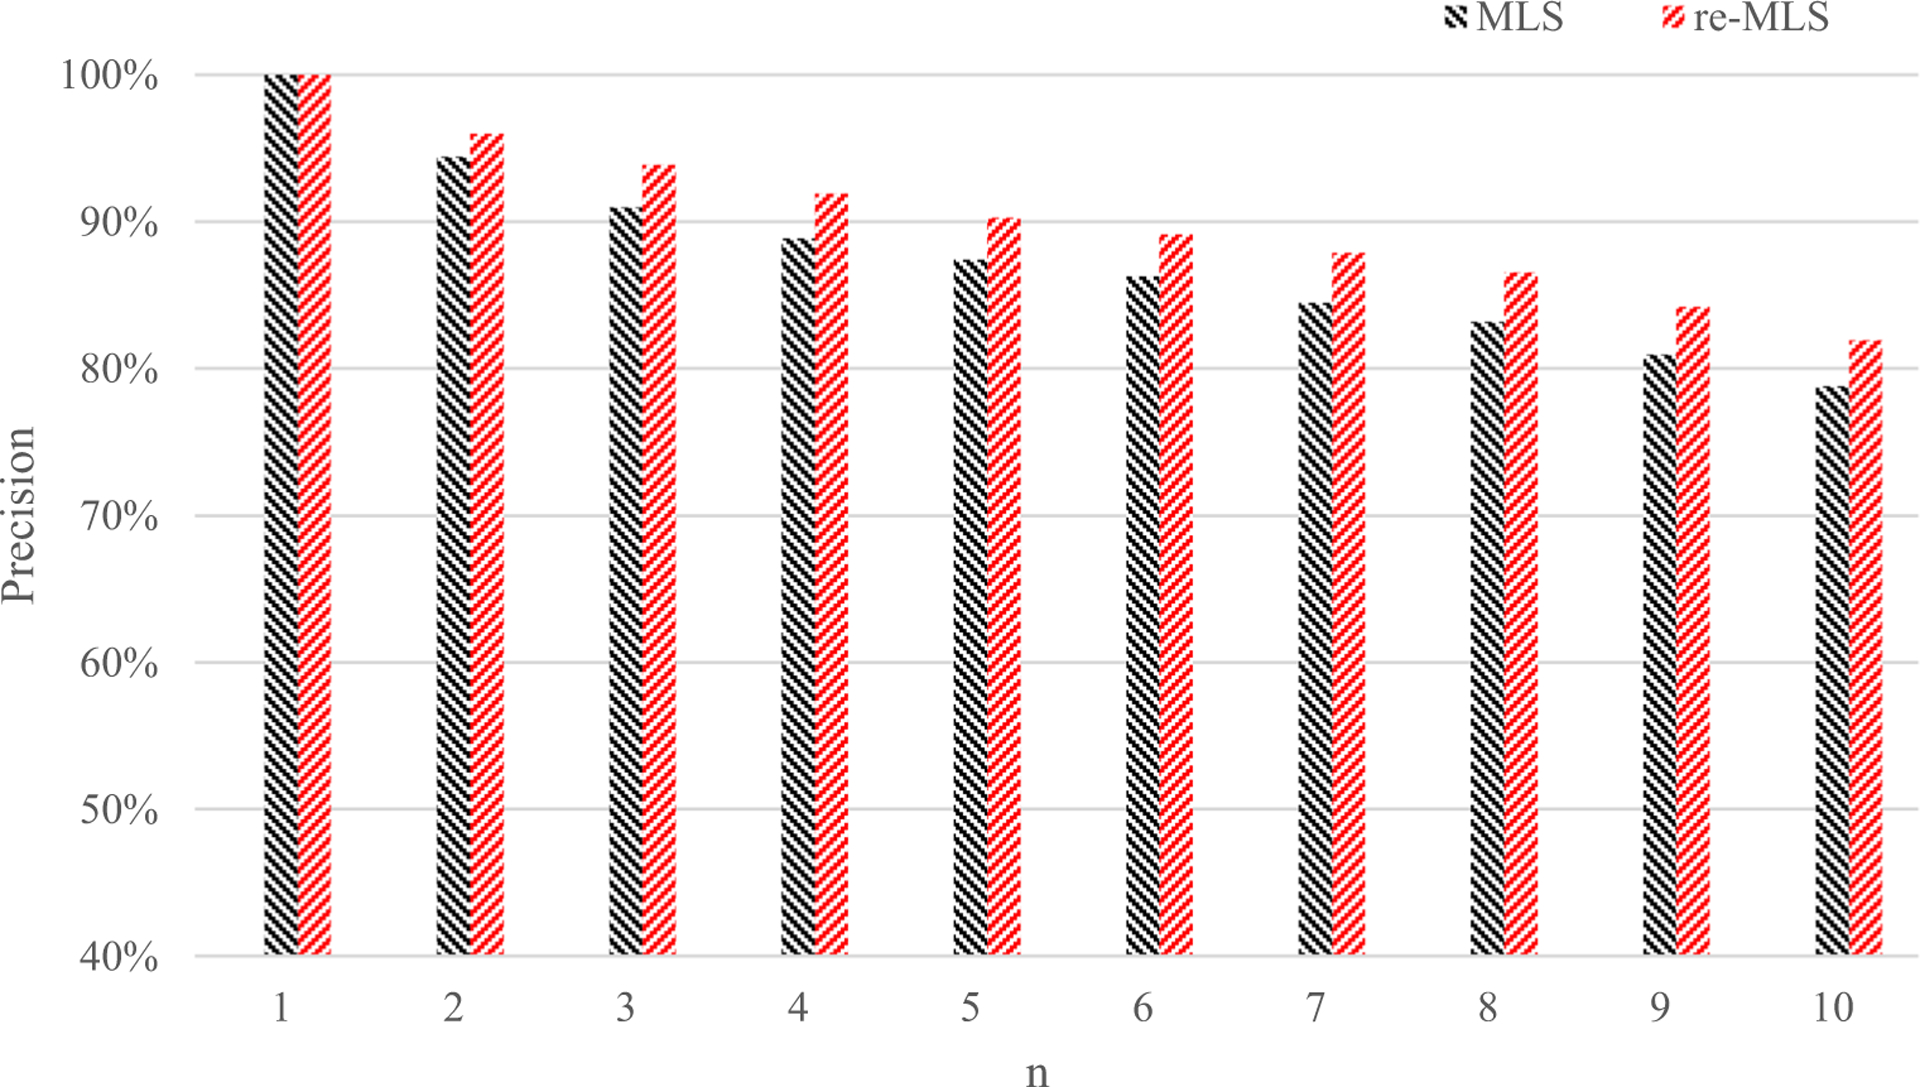
Average p@n values from the MLS retrieval and re-MLS retrieval results
4. Discussion
In this paper, we proposed a MLS method for the retrieval of CISLs. The MLS retrieval method is evaluated on a dataset of 511 lung CT images from clinical patients, and the results demonstrate its effectiveness and efficiency.
Although the similarity methods of medical images have previously been proposed, most of the methods calculated the similarity at one level. Only a few papers considered the similarity at two levels. However, the similarity of medical images is particular. Some medical images look like each other, but they are related to different diseases. Some medical images looked quite different yet are the instances from the same disease. Hence, it is necessary to measure the similarity at multi-levels. The advantage of our method is the combination of multi-level similarity for accurate similarity measure in CISLs. Moreover, combining the attribute similarity together with visual and semantic similarities is for the first time considered for the lung CT image retrieval.
First, to characterize the CISLs at multi-levels well, we give a good description by extracting discriminant features at multi-levels. (1) We extract multiple types of visual features from different spaces to acquire complementary information and select the compact and discriminative features for the description of CISLs at visual level. In Fig. 6, we can see that the similarity method involving the visual similarity can obtain an average precision of above 50% in the retrieved top 10 images, which proves our visual feature can give a good discrimination of different CISLs; (2) we adopt the AE to learn deep attribute feature. AE is an unsupervised learning algorithm that applies backpropagation, setting the target values to be equal to the inputs. It can abstract more compact and relevant information for an enhanced generalization and accurate representation, e.g., the attribute similarity achieve good retrieval performance, as shown in Fig. 6; (3) we apply the DOF to learn the semantic feature. It is used to improve the classification performance of CISLs. In Fig. 6, we can see that the retrieval performance obtained by semantic similarity is better than those by visual similarity and attribute similarity when n is more than 2. Please note that because of the complicated relationship between the appearance and category of CISLs, it is not established that the attribute features absolute character of the CISLs better than the visual features or the semantic features must be more discriminative than the attribute features. Hence, that is the reason why it is necessary to combine multi-level information together.
Second, the proposed multi-level similarity is a generic framework. Since our MLS combines multi-level similarities in a weighted sum, different frameworks can be formulated by applying different image representation techniques, replacing the different distance metrics, or adjusting the weights. Although the weights are determined according to the maximum inter-class distance and minimum intra-class distance of CISLs in this paper for best retrieval performance, they are customized for the different requirements. Specifically, for a query instance, if we want to find more semantically similar CISLs than visual similar ones, we can increase the proportion of the weight of semantic similarity and reduce the proportion of others. Then the semantic similarity could contribute most to the final similarity and the top similar instances could have the same category with the query one in a great probability. Such as the extreme case, the similarity method [12] computed the similarity based on the only semantic information, where the weight of semantic similarity is 1 and the others are zeros in our framework. Another extreme case, the similarity method [11], used only visual similarity, where the weight of visual similarity equals 1 and the others are zeros in our framework. Moreover, the method [39] is a special instance of our method where the attribute weight is zero. Although the experimental results proved that the multi-level similarity method with the determined weights could achieve the best retrieval performance on our database compared with the one-level similarity methods and two-level similarity method, the different frameworks formulated by our MLS still have the potential applications, such as, education, efficient data management, and so on.
Finally, the proposed MLS method is effective and efficient. The proposed method is evaluated on the database containing the instances of nine categories of CISLs from clinical patients, and the instances used for training and testing are guaranteed to come from different patients to avoid bias. Experimental results prove the effectiveness of our method, as shown in Figs. 6, 7, 8, and 9. Our approach offers higher retrieval precision than the state-of-the-art similarity methods, including the single-level similarity measure [6, 31] and the two-level similarity methods [38, 39]. It can even further improve the retrieval performance with the help of the re-ranking process. Our improvement, compared with the one- and two-level similarities, is significant with p < 0.000000001 by t test. Moreover, different from the other multi-level feature fusion method [40], which fused two-level features by using PCA, including the mid-level CNN features from the pre-trained model on the Cifar-10 dataset, and the low-level HOG and LBP features, our method fuses the three-level features in a weighted-sum form to provide more rich information and an easily customized, user-defined retrieval process and trains and extracts the features from scratch to obtain more accurate description of CISLs. In addition, our method is real time on a standard PC without multi-threading, GPU acceleration, and parallel programming. We can obtain the retrieval results on our database in 3.6 ms while the method FCSS [39] takes about 46 ms on the same database. It proves that our retrieval method is more efficient. In Table 3, we can see most time is spent on image representation, which is 3.078 ms, and pairwise similarity computation takes approximately 0.006 ms. If we perform the retrieval task on a database containing 100,000 images and extract the features of images in the database during offline processing, the total time taken for a retrieval on the entire database is about 0.6 s (3.078 + 0.006 × 100,000 ms). It will even be faster if it involves multi-threading, GPU acceleration, or parallel programming. Hence, we can say our proposed similarity method is effective, promising, and can be applied in a huge medical image database.
5. Conclusions
In this paper, we have proposed a new similarity method for the CISLs. Since both the resemblance in visual appearance and the similarity in the semantic concept are important in the medical diagnosis and the relevant details of images exist only over a restricted range of levels, our framework represents a multi-level similarity method by mining the correlated complementary advantage across multiple levels. The proposed method combines the similarity at the visual level, semantic level, and especially attribute level for a final multi-level similarity. In addition, our method is a generic similarity framework in the scope of medical retrieval applications. The results from the experiments on the 511 lung CT images from clinical patients show that our method could improve the similarity measure for better retrieval compared with those one-level similarity methods and the two-level similarity methods and demonstrate that our similarity method is effective on the similarity measure of CISLs. Since CISLs are closely related to lung diseases, the proposed method has the potential to aid radiologists in decision making during the clinical practice.
Funding information
This research was supported in part by the National Natural Science Foundation of China, China Postdoctoral Science Foundation (Grant No. 61901234, 2018M641635 to LM), and the Fundamental Research Funds for the Central Universities and partially by the National Natural Science Foundation of China (Grant No. 60973059, 81171407 to XL) and the Program for New Century Excellent Talents in Universities of China (Grant No. NCET-10-0044 to XL).
Biography

Ling Ma is currently an assistant professor in the School of Software, Nankai University. Her current research interests include medical image analysis, computer vision, and multimedia retrieval.

Xiabi Liu is an associate professor at the School of Computer Science and Technology, Beijing Institute of Technology. His research interest covers machine learning, medical image analysis, and computer vision.

Baowei Fei is a professor at the University of Texas (UT) at Dallas and UT Southwestern Medical Center. Before he was recruited to Dallas, he was an associate professor with tenure at Emory University.
Footnotes
Publisher’s note Springer Nature remains neutral with regard to jurisdictional claims in published maps and institutional affiliations.
References
- 1.Torre LA, Bray F, Siegel RL et al. (2015) Global cancer statistics, 2012. CA Cancer J Clin 65(2):87–108 [DOI] [PubMed] [Google Scholar]
- 2.Siegel RL, Miller KD, Jemal A (2016) Cancer statistics, 2016. CA Cancer J Clin 66(1):7–30 [DOI] [PubMed] [Google Scholar]
- 3.Van Ginneken B, Romeny BTH, Viergever MA (2001) Computer-aided diagnosis in chest radiography: a survey. IEEE Trans Med Imaging 20:1228–1241 [DOI] [PubMed] [Google Scholar]
- 4.Doi K (2007) Computer-aided diagnosis in medical imaging: historical review, current status and future potential. Comput Med Imaging Graph 31:198–211 [DOI] [PMC free article] [PubMed] [Google Scholar]
- 5.Owais M, Arsalan M, Choi J et al. (2019) Effective diagnosis and treatment through content-based medical image retrieval (CBMIR) by using artificial intelligence. J Clin Med 8(4):462. [DOI] [PMC free article] [PubMed] [Google Scholar]
- 6.Li Z, Zhang X, Müller H, Zhang S (2018) Large-scale retrieval for medical image analytics: a comprehensive review. Med Image Anal 43:66–84 [DOI] [PubMed] [Google Scholar]
- 7.Mehre SA, Dhara AK, Garg M et al. (2019) Content-based image retrieval system for pulmonary nodules using optimal feature sets and class membership-based retrieval. J Digit Imaging 32(3):362–385 [DOI] [PMC free article] [PubMed] [Google Scholar]
- 8.Shyu CR, Brodley CE, Kak AC et al. (1999) ASSERT: a physician-in-the-loop content-based retrieval system for HRCT image databases. Comput Vis Image Underst 75:111–132 [Google Scholar]
- 9.Cheng W, Zhu X, Chen X et al. (2019) Manhattan distance based adaptive 3D transform-domain collaborative filtering for laser speckle imaging of blood flow. IEEE Trans Med Imaging 38(7): 1726–1735 [DOI] [PubMed] [Google Scholar]
- 10.Cai S, Georgakilas GK, Johnson JL et al. (2018) A cosine similarity-based method to infer variability of chromatin accessibility at the single-cell level. Front Genet 9:319. [DOI] [PMC free article] [PubMed] [Google Scholar]
- 11.Endo M, Aramaki T, Asakura K et al. (2012) Content-based image-retrieval system in chest computed tomography for a solitary pulmonary nodule: method and preliminary experiments. Int J Comput Assist Radiol Surg 7(2):331–338 [DOI] [PubMed] [Google Scholar]
- 12.Dy JG, Brodley CE, Kak A et al. (2003) Unsupervised feature selection applied to content-based retrieval of lung images. IEEE Trans Pattern Anal Mach Intell 25(3):373–378 [Google Scholar]
- 13.Ashraf R, Ahmed M, Jabbar S et al. (2018) Content based image retrieval by using color descriptor and discrete wavelet transform. J Med Syst 42(3):44. [DOI] [PubMed] [Google Scholar]
- 14.El-Naqa I, Yang Y, Galatsanos NP et al. (2004) A similarity learning approach to content-based image retrieval: application to digital mammography. IEEE Trans Med Imaging 23(10):1233–1244 [DOI] [PubMed] [Google Scholar]
- 15.Cho H, Hadjiiski L, Sahiner B, Chan HP, Helvie M, Paramagul C, Nees AV (2011) Similarity evaluation in a content-based image retrieval (CBIR) CADx system for characterization of breast masses on ultrasound images. Med Phys 38(4):1820–1831 [DOI] [PMC free article] [PubMed] [Google Scholar]
- 16.Rahman MM, Antani SK, Thoma GR (2011) A learning-based similarity fusion and filtering approach for biomedical image retrieval using SVM classification and relevance feedback. IEEE Trans Inf Technol Biomed 15(4):640–646 [DOI] [PubMed] [Google Scholar]
- 17.Caicedo JC, González FA, Romero E (2011) Content-based histo-pathology image retrieval using a kernel based semantic annotation framework. J Biomed Inform 44(4):519–528 [DOI] [PubMed] [Google Scholar]
- 18.De Oliveira JEE, Machado AMC, Chavez GC et al. (2010) MammoSys: a content-based image retrieval system using breast density patterns. Comput Methods Prog Biomed 99(3): 289–297 [DOI] [PubMed] [Google Scholar]
- 19.Rahman MM, Desai BC, Bhattacharya P (2008) Medical image retrieval with probabilistic multi-class support vector machine classifiers and adaptive similarity fusion. Comput Med Imaging Graph 32(2):95–108 [DOI] [PubMed] [Google Scholar]
- 20.Wei CH, Li Y, Huang PJ (2010) Mammogram retrieval through machine learning within BI-RADS standards. J Biomed Inform 44(4):607–614 [DOI] [PubMed] [Google Scholar]
- 21.Mueen A, Zainuddin R, Baba MS (2010) MIARS: a medical image retrieval system. J Med Syst 34(5):859–864 [DOI] [PubMed] [Google Scholar]
- 22.Tarjoman M, Fatemizadeh E, Badie K (2013) An implementation of a CBIR system based on SVM learning scheme. J Med Eng Technol 37(1):43–47 [DOI] [PubMed] [Google Scholar]
- 23.Quddus A, Basir O (2012) Semantic image retrieval in magnetic resonance brain volumes. IEEE Trans Inf Technol Biomed 16(3): 348–355 [DOI] [PubMed] [Google Scholar]
- 24.Wei L, Yang Y, Nishikawa RM (2009) Microcalcification classification assisted by content-based image retrieval for breast cancer diagnosis. Pattern Recogn 42(6):1126–1132 [DOI] [PMC free article] [PubMed] [Google Scholar]
- 25.Yuan K, Tian Z, Zou J et al. (2011) Brain CT image database building for computer-aided diagnosis using content-based image retrieval. Inf Process Manag 47(2):176–185 [Google Scholar]
- 26.Yang W, Lu Z, Yu M, Huang M, Feng Q, Chen W (2012) Content-based retrieval of focal liver lesions using bag-of-visual-words representations of single-and multiphase contrast-enhanced CT images. J Digit Imaging 25(6):708–719 [DOI] [PMC free article] [PubMed] [Google Scholar]
- 27.Ko BC, Lee JH, Nam JY (2012) Automatic medical image annotation and keyword-based image retrieval using relevance feedback. J Digit Imaging 25(4):454–465 [DOI] [PMC free article] [PubMed] [Google Scholar]
- 28.Zhang F, Song Y, Cai W et al. (2016) Pairwise latent semantic association for similarity computation in medical imaging. IEEE Trans Biomed Eng 63(5):1058–1069 [DOI] [PMC free article] [PubMed] [Google Scholar]
- 29.Cauvin JM, Le Guillou C, Solaiman B et al. (2003) Computer-assisted diagnosis system in digestive endoscopy. IEEE Trans Inf Technol Biomed 7(4):256–262 [DOI] [PubMed] [Google Scholar]
- 30.Rahman MM, Bhattacharya P, Desai BC (2007) A framework for medical image retrieval using machine learning and statistical similarity matching techniques with relevance feedback. IEEE Trans Inf Technol Biomed 11(1):58–69 [DOI] [PubMed] [Google Scholar]
- 31.Qayyum A, Anwar SM, Awais M, Majid M (2017) Medical image retrieval using deep convolutional neural network. Neurocomputing 266:8–20 [Google Scholar]
- 32.Gao Z, Wu S, Liu Z et al. (2019) Learning the implicit strain reconstruction in ultrasound elastography using privileged information. Med Image Anal 58:101534. [DOI] [PubMed] [Google Scholar]
- 33.Kurtz C, Beaulieu CF, Napel S, Rubin DL (2014) A hierarchical knowledge-based approach for retrieving similar medical images described with semantic annotations. J Biomed Inform 49:227–244 [DOI] [PMC free article] [PubMed] [Google Scholar]
- 34.Burdescu DD, Mihai CG, Stanescu L et al. (2013) Automatic image annotation and semantic based image retrieval for medical domain. Neurocomputing 109:33–48 [Google Scholar]
- 35.Yao J, Zhang ZM, Antani S et al. (2008) Automatic medical image annotation and retrieval. Neurocomputing 71(10–12):2012–2022 [Google Scholar]
- 36.Napel SA, Beaulieu CF, Rodriguez C et al. (2010) Automated retrieval of CT images of liver lesions on the basis of image similarity: method and preliminary results. Radiology 256(1):243–252 [DOI] [PMC free article] [PubMed] [Google Scholar]
- 37.Yang L, Jin R, Mummert L et al. (2010) A boosting framework for visuality-preserving distance metric learning and its application to medical image retrieval. IEEE Trans Pattern Anal Mach Intell 32(1):30–44 [DOI] [PubMed] [Google Scholar]
- 38.Cao Y, Steffey S, He J et al. (2014) Medical image retrieval: a multimodal approach. Cancer Informatics 13:CIN-S14053 [DOI] [PMC free article] [PubMed] [Google Scholar]
- 39.Ma L, Liu X, Gao Y et al. (2017) A new method of content based medical image retrieval and its applications to CT imaging sign retrieval. J Biomed Inform 66:148–158 [DOI] [PubMed] [Google Scholar]
- 40.Han G, Liu X, Zhang H et al. (2019) Hybrid resampling and multi-feature fusion for automatic recognition of cavity imaging sign in lung CT. Futur Gener Comput Syst 99:558–570 [Google Scholar]
- 41.Shi Z, Yang Y, Hospedales TM (2016) Weakly-supervised image annotation and segmentation with objects and attributes. IEEE Trans Pattern Anal Mach Intell 39(12):2525–2538 [DOI] [PubMed] [Google Scholar]
- 42.Penatti OA, Werneck RDO, de Almeida WR et al. (2015) Mid-level image representations for real-time heart view plane classification of echocardiograms. Comput Biol Med 66:66–81 [DOI] [PubMed] [Google Scholar]
- 43.Koenderink JJ (1984) The structure of images. Biol Cybern 50(5): 363–370 [DOI] [PubMed] [Google Scholar]
- 44.Han G, Liu X, Han F et al. (2015) The LISS—a public database of common imaging signs of lung diseases for computer-aided detection and diagnosis research and medical education. IEEE Trans Biomed Eng 62(2):648–656 [DOI] [PubMed] [Google Scholar]
- 45.Ma L, Liu X, Fei B (2016) Learning with distribution of optimized features for recognizing common CT imaging signs of lung diseases. Phys Med Biol 62(2):612–632 [DOI] [PMC free article] [PubMed] [Google Scholar]
- 46.Liu X, Ma L, Song L et al. (2015) Recognizing common CT imaging signs of lung diseases through a new feature selection method based on Fisher criterion and genetic optimization. IEEE J Biomed Health Inform 19(2):635–647 [DOI] [PubMed] [Google Scholar]
- 47.Litjens G, Kooi T, Bejnordi BE, Setio AAA, Ciompi F, Ghafoorian M, van der Laak J, van Ginneken B, Sánchez CI (2017) A survey on deep learning in medical image analysis. Med Image Anal 42:60–88 [DOI] [PubMed] [Google Scholar]
- 48.Deza MM, Deza E (2009) Encyclopedia of distances. Springer, Heidelberg [Google Scholar]
- 49.Dattorro J (2005) Convex optimization and Euclidean distance geometry. Meboo Publishing (v2007.09.17) [Google Scholar]


