

Abstract
Background/Aims
To assess the effect of various parameters on the oncologic outcomes, including the time interval between therapy and surgery (S) in locally advanced rectal cancer (LARC) patients receiving preoperative chemoradiotherapy (CRT).
Materials and Methods
The data of 914 LARC patients who received preoperative CRT between 1994 and 2015 were collected retrospectively. Patients received 45–50.4 Gy RT with 5FU based chemotherapy (CT). They all underwent radical resection followed by maintenance CT. Clinical and pathologic variables were compared between the pCR and no-pCR groups. Survival was estimated by the Kaplan-Meier method and Cox proportional hazard model was used in multivariate analysis.
Results
After median follow-up of 60.5 (range=12–297.6) months, median overall survival (OS) was 58.75 months and disease-free survival (DFS) 53.32 months. pCR was observed in 18.9% of all cases. pCR, lymphovascular invasion and metastatic lymph node ratio (mLNR) were significantly associated with OS and DFS on multivariate analysis. The 5-year OS and DFS rates were better in pCR group (95.3% vs 80.7% for OS, p<0.0001 and 87.4% vs 71% for DFS, p<0.0001). pCR patients with 4–8 weeks interval had lower rates of distant metastasis (9% vs 20%, p=0.01) and any recurrences (13.6% vs 29.6%, p=0.001) than the remaining. Both OS and DFS were better in favor of pCR achieved at 4–8 week interval time (p<0.0001 for each).
Conclusion
pCR after preoperative CRT in LARC correlated with better oncologic outcome. The best OS and DFS durations were achieved in patients who experienced pCR after 4–8-weeks interval before surgery.
Keywords: Rectal cancer, chemoradiotherapy, prognostic factors
INTRODUCTION
Rectal cancer continues to be an important cause of cancer-related death, and about 50%–60% of patients have tumors extending through the rectal wall or involving the locoregional lymph nodes (cT3/cT4 or N+, locally advanced) for which cure is more difficult. Neoadjuvant chemoradiotherapy (CRT) including fluoropyrimidine-based regimen before surgical resection has emerged as the standard of care in the United States as per NIH consensus (1). The large German phase III trial (CAO/ARO/AIO-94) showed improvement in the local control, reduced toxicity, and increased patient compliance to the therapy (2), which confirms this strategy as the standard procedure worldwide.
CRT has the potential to downsize and downstage tumors before surgery, decrease locoregional recurrence, and induce pathologic complete response (pCR) in 9%–30% of patients (2–4). Although some series show no correlation (5), achieving a pCR is associated with an improved outcome in which the interval between CRT and surgery was generally 6–8 weeks (6, 7). Several retrospective studies have reported that a longer interval may yield better pCR rates and outcomes (8) but there have been some contradicting results as well (9–11). Therefore, there is a disagreement in the literature regarding the optimal interval between preoperative CRT and surgery, and the pCR gained at a specific interval period has an impact on the prognosis.
This multicentric study aimed to assess the effect of various parameters on the oncologic outcome in locally advanced rectal cancer patients receiving preoperative CRT. In addition, the effect of the interval between CRT and surgery was evaluated.
MATERIALS AND METHODS
A retrospective chart review was conducted for all patients who had undergone preoperative CRT followed by curative surgery for rectal cancer between 1994 and 2015. Retrospective studies were not included within “the Regulations of Ethics Committee of Non-invasive Clinical Researches” of the year 2016; therefore, the permission of the archival documentation was taken from the management of the related hospital. One thousand two hundred and twenty-eight patients with histologically proven adenocarcinoma of the rectum, transmural extension (T3–4) and/or node-positive disease, lower pole of the tumor 0–15 cm from the anorectal ring, no prior radiotherapy to the pelvis/abdomen, operated with total mesorectal excision (TME), and having no missing research data items were identified. Patients were excluded if: they had undergone therapy other than concomitant chemoradiotherapy and short-term radiotherapy (5 Gy × 5 fx), the interval between CRT and surgery was <4 weeks, the follow-up period after surgery was <12 months, they had stage IV disease at diagnosis, they had resection other than R0 resection, or they had received induction chemotherapy.
A retrospective analysis was conducted with the remaining 914 patients. Data collected were patient age at diagnosis, gender, histology, and clinical stage at presentation. The beginning and completion dates of radiotherapy (RT), RT dose and fractionation, chemotherapy regimens, date of surgery, surgical procedure, and pathologic findings at surgery were also recorded. Patients were staged locally with rectoscopy (including biopsy, 100% of the patients), pelvic MRI (80% of all patients), and endoscopic ultrasonography (45% of the low-lying tumors). Systemic staging included chest/abdomen/pelvic computerized tomography (CT) or positron emission tomography-CT (35% of all patients) and abdominopelvic ultrasonography.
Patients received 45–50.4 Gy in 25–28 fractions of external beam RT for the whole pelvis with megavoltage energies. External beam RT was delivered as two-dimensional RT in 15%, three-dimensional conformal RT in 39%, or intensity-modulated RT in 46% of the patients. All patients were given one of the following three chemotherapeutic regimens concurrently with RT: (1) intravenous bolus 5 fluorouracil (FU) (400 mg/m2/day) and leucovorin (20–25 mg/m2/day) at the first and last weeks of RT, (2) continuous infusion 5FU (225 mg/m2/day) during RT, and (3) oral capecitabine (825 mg/m2 b.i.d, days 1–5) during RT. The timing of surgery after CRT was at physician’s discretion (patients with an interval of at least 4 weeks between CRT and surgery were included in this study). All patients completed the full course of therapy and underwent TME after CRT. Patients were staged according to the tumor, node, and metastasis cancer staging system (12). pCR was defined as the absence of viable cancer cells in the resected specimen (ypT0N0). Postoperative maintenance 5FU-based chemotherapy was given according to the institutional policy.
Each patient provided informed consent before preoperative CRT and surgery as per the national health policy. All patients were followed at dedicated multidisciplinary outpatient clinics and were examined at follow-up visits every 3–6 months for the first 2 years, and annually thereafter.
Statistical analysis
Data analysis was performed using the Statistical Package for Social Sciences Software Package (SPSS), version 20 (IBM Corp.; Armonk, NY, USA). Clinical and pathologic variables between the pCR and no-pCR groups were compared for distribution and frequency using Mann–Whitney U test and chi-square test, respectively. Outcome measures were achievement of either pCR, locoregional relapse-free survival (LRFS), distant metastasis-free survival (DMFS), or overall survival (OS). Uni- and multivariable binary logistic regression used to assess the predictors of pCR. LRFS, DMFS, disease-free survival (DFS), or OS was defined as the interval from the date of surgery until local or regional failure, any distant failure, any recurrence, and death by any cause or more recent follow-up, respectively. Survival curves for LRFS, DMFS, DFS, and OS were created using the Kaplan–Meier method and compared with the log-rank test. Uni- and multivariable Cox proportional hazards regression model was used for predictors of survival. Only two-sided results were used in this study. p values <0.05 were considered significant.
RESULTS
Characteristics of patients, preoperative CRT, and surgical management are shown in Tables 1–3. The median number of dissected lymph nodes was 11 (range: 0–66). It was less than 12 in 55% of the cases, and 0 in 3% of cases. pCR was achieved in 18.9%(173/914) of cases. For patients with pCR and those with ypT1 stage, the rate of nodal metastases was low compared to the remaining (6% and 14%, respectively) patients. The rate of ypN-positive disease increased with the increase in ypT stage (20% for ypT2, 43% for ypT3, and 53% for ypT4; p<0.0001).
Table 1.
Patient characteristics.
| Parameters | Total (n=914) | pCR (n=173) (%) | no-pCR (n=741) (%) | p |
|---|---|---|---|---|
| Mean age±SEM (years) | 57.29±0.41 | 56.34±0.97 | 57.51±0.46 | NS |
| Gender | ||||
| Female/Male | 356/558 | 63/110 | 293/448 | NS |
| Mean distance from anal verge±SEM (cm) | 4.16±0.16 | 4.39±0.32 | 4.1±0.18 | NS |
| Tumor location (%) | ||||
| Distal rectum | 461 | 95 (21) | 366 (79) | |
| Id rectum | 306 | 47 (15) | 259 (85) | |
| Proximal rectum | 147 | 31 (12) | 116 (78) | NS |
| Tumor differentiation (%) | ||||
| Well | 130 | 25 (19) | 105 (81) | |
| Moderate | 521 | 104 (20) | 417 (80) | |
| Poor | 67 | 11 (16) | 56 (84) | |
| Unknown | 196 | 33 (17) | 163 (83) | NS |
| Histology (%) | ||||
| Adenocarcinoma | 686 | 131 (19) | 555 (81) | |
| Mucinous carcinoma | 189 | 33 (17) | 156 (83) | |
| Adenocarcinoma with neuroendocrine features | 39 | 9 (23) | 30 77) | NS |
| Clinical tumor stage (%) | ||||
| cT2 | 64 | 29 (45) | 35 (55) | |
| cT3 | 695 | 122 (18) | 573 (82) | |
| cT4 | 155 | 22 (14) | 133 (86) | NS |
| Clinical nodal stage (%) | ||||
| cN0 | 360 | 77 (21) | 283 (79) | |
| cN+ | 554 | 96 (17) | 458 (83) | NS |
SEM: standard error of mean; pCR: pathologically complete response; NS: not significant
Table 2.
Characteristics of preoperative chemoradiotherapy.
| Parameters | Total (n=914) | pCR (n=173) (%) | no-pCR (n=741) (%) | p |
|---|---|---|---|---|
| RT dose | ||||
| 45 Gy | 348 | 58 (17) | 290 (83) | |
| 50 Gy | 115 | 20 (17) | 95 (83) | |
| 50.4 Gy | 451 | 95 (21) | 356 (79) | NS |
| Mean RT duration ± SEM (days) | 38.1±0.24 | 37.77±0.36 | 38.18±0.28 | NS |
| RT interruption (%) | 177 | 32 (18) | 145 (82) | NS |
| RT technique (%) | ||||
| 2D | 143 | 28 (20) | 115(80) | |
| 3D | 345 | 58 (17) | 287 (83) | |
| IMRT | 426 | 87 (20) | 339 (80) | NS |
| Concurrent 5FU-based regimens (%) | ||||
| IV bolus | 256 | 64 (25) | 192 (75) | |
| IV infusion | 283 | 42 (15) | 241 (85) | |
| Oral capecitabine | 375 | 67 (18) | 308 (82) | NS |
| Adjuvant CT | ||||
| Yes | 829 | 131 (16) | 698 (84) | |
| No | 85 | 42 (50) | 43 (50) | |
pCR: pathologically complete response; RT: radiotherapy; SEM: standard error of mean; 2D/3D: two-dimensional/ three-dimensional; IMRT: intensity modulated radiotherapy; 5FU: 5 fluorouracil; CT: chemotherapy; IV: intravenous; NS: not significant.
Table 3.
Characteristics of surgical management.
| Parameters | Total (n=914) | pCR (n=173) | no-pCR (n=741) | p |
|---|---|---|---|---|
| CRT to surgery interval | ||||
| Mean±SEM (weeks) | 8.32±0.09 | 8.22±0.21 | 8.34±0.11 | NS |
| Range | 4–29.71 | 4–17.14 | 4–29.71 | |
| CRT to surgery interval (%) | ||||
| 4–8 weeks | 438 | 88 (20) | 350 (80) | |
| >8 weeks | 476 | 85 (18) | 391 (82) | NS |
| Surgical procedure (%) | ||||
| Abdominoperineal resection (APR) | 361 | 62 (17) | 299 (83) | |
| LAR | 553 | 111 (20) | 442 (80) | NS |
| Mean LNs dissected ± SEM (n) | 11.7±0.2 | 10.54±0.48 | 11.9±0.3 | NS |
| ypT stage (%) | ||||
| 0 | 192 | 173 (90) | 19 (10) | |
| 1 | 56 | 56 | ||
| 2 | 212 | 212 | ||
| 3 | 393 | 393 | ||
| 4 | 61 | 61 | <0.0001 | |
| ypN stage (%) | ||||
| 0 | 646 | 173 (27) | 473 (73) | |
| 1 | 175 | 175 | ||
| 2 | 93 | 93 | <0.0001 | |
| LVI (%) | 168 | 168 | 0.039 | |
pCR: pathologically complete response; CRT: chemoradiotherapy; SEM: standard error of mean; APR: abdominoperineal resection; LAR: low anterior resection; LN: lymph node; ypT/N stage: pathologic T/N stage gained after preoperative CRT followed by radical surgery; LVI: lymphovascular invasion; NS: not significant
There was no difference in patient age, gender, distance from the anal verge, tumor location, tumor differentiation, histology, cT and cN stage, CRT management, CRT-S interval, or surgical procedure between pCR and no-pCR patients. On univariate analysis, the distance of the tumor from the anal verge ≤4 cm and cN2 and cT3–4 disease at diagnosis predicted against pCR. On multivariate analysis, the distance of the tumor from the anal verge ≥4 cm [Odds ratio (OR): 0.49, 95% confidence interval (CI): 0.25–0.99, p=0.047)] and cN0 disease at diagnosis (OR: 4.04, 95% CI: 1.34–12.17, p=0.013) were found as independent predictors of pCR.
For the whole group, the OS and DFS duration were 58.75±1.29 (median±SEM) and 52.32±1.36 months, respectively. Five-year OS and DFS rates were 83% and 74%, respectively. The median follow-up time was 60.5 months (range: 12–297.6 months). During follow-up, 172 (19%) deaths, 84 (9%) locoregional recurrences, and 211 (23%) distant metastases were detected. Liver (42%) and lung (36%) were the most common sites of metastasis followed by bone (10%), brain (5%), and other sites including peritonitis carcinomatosa (6%). In the multivariate stepwise logistic regression model, the effect of tumor differentiation (well vs moderate-poor), lymphovascular invasion status (negative vs positive), ypT stage (stage 1/2 vs 3/4), ypN stage (0 vs 1/2), metastatic lymph node ratio (mLNR) (metastatic/dissected lymph node %, ≤33% vs >33%), and CRT-surgery interval (4–8 weeks vs >8 weeks) on distant metastasis was analyzed. The presence of lymphovascular invasion (OR: 1.98, 95% CI: 1.40–2.80, p<0.0001) and mLNR >33% (OR: 2.31, 95% CI: 1.42–3.75, p=0.001) were found as predictors of distant metastasis in all patients.
Uni- and multivariate regression analysis of the various pathological parameters regarding OS and DFS was performed (Table 4). Significant differences in both OS and DFS were observed according to LVI status, pCR status, ypT stage, ypN stage, and mLNR in univariate analysis (Table 4). Median OS was 51.4 months and 61.4 months, respectively, for patients with and without LVI (p<0.0001). Median DFS was also found to be in favor of patients without LVI (46.5 months vs 53.85 months, p<0.0001). OS duration according to mLNR was 60.9 months for ≤33% and 35.8 months for >33% (p<0.0001). The cumulative incidence of death was 18% vs 58% for lower (≤33%) and higher mLNR [Hazard ratio (HR): 6.12, 95% CI: 3.85–9.73, p<0.0001]. Five-year DFS rate in patients with ≤33% mLNR was 78% compared to 29% in patients with a higher mLNR (p<0.0001). The cumulative incidence of distant metastasis was 24% and 63.9% (HR: 5.49, 95% CI: 3.44–8.77, p<0.0001) and any recurrence was 20% and 58% (HR: 5.75, 95% CI: 3.62–9.13, p<0.0001) for patients with lower and higher mLNR, respectively. There was a significant difference in both OS and DFS in favor of pCR. The median OS time was 63.9 vs 57.8 months for patients with or without pCR, respectively (p<0.0001) (Figure 1). The median DFS was also poor in patients without pCR (58.9 months vs 50.7 months, p<0.0001) (Figure 2). The 5-year OS and DFS rates were better in pCR group (95.3% vs 80.7% for OS and 87.4% vs 71% for DFS, p<0.0001 for each). The relative risk of being dead at 10 years is 67% lower in patients with pCR compared to the patients without pCR. The patients with pCR had a 50% lower risk of developing any relapses at 10 years compared to the patients without pCR.
Table 4.
Hazard ratios for the effect of pathologic parameters on overall and disease-free survival in the 914 patients.
| Variable | Category | OS | DFS | ||
|---|---|---|---|---|---|
|
|
|
||||
| HR (95% CI) | P value | HR (95% CI) | p | ||
| Tumor differentiation | well+moderate vs poor | 0.960 (0.652–1.414) | NS | 0.800 (0.551–1.162) | NS |
| LVI status | negative vs positive | 0.472 (0.344–0.649) | <0.0001 | 0.456 (0.346–0.601) | <0.0001 |
| pCR status | negative vs positive | 3.059 (1.835–5.098) | <0.0001 | 2.284 (1.582–3.403) | <0.0001 |
| ypT stage | 1/2 vs ¾ | 0.373 (0.276–0.504) | <0.0001 | 0.409 (0.315–0.530) | <0.0001 |
| ypN stage | 0/1 vs 2 | 0.294 (0.211–0.412) | <0.0001 | 0.286 (0.212–0.387) | <0.0001 |
| metastatic ln ratio (%) | ≤33% vs >33% | 0.207 (0.150–0.285) | <0.0001 | 0.230 (0.171–0.311) | <0.0001 |
| CRT-surgery interval | 4–8 weeks vs >8 weeks | 0.843 (0.638–1.113) | NS | 1.085 (0.849–1.386) | NS |
| Multivariate analysis | |||||
| Tumor differentiation | well+moderate vs poor | 1.233 (0.830–1.831) | NS | 1.039 (0.712–1.517) | NS |
| LVI status | negative vs positive | 0.691 (0.476–1.003) | 0.017 | 0.598 (0.434–0.824) | 0.002 |
| pCR status | negative vs positive | 1.925 (1.018–3.641) | 0.044 | 1.288 (0.775–2.141) | 0.003 |
| ypT stage | 1/2 vs ¾ | 0.617 (0.416–0.916) | NS | 0.586 (0.410–0.838) | NS |
| ypN stage | 0/1 vs 2 | 0.850 (0.522–1.384) | NS | 0.788 (0.507–1.224) | NS |
| metastatic ln ratio (%) | ≤33% vs >33% | 0.396 (0.245–0.641) | <0.0001 | 0.482 (0.308–0.755) | 0.001 |
| CRT-surgery interval | 4–8 weeks vs >8 weeks | 1.131 (0.822–1.558) | NS | 1.027 (0.775–1.362) | NS |
OS: overall survival; DFS: disease-free survival; LVI: lymphovascular invasion; pCR: pathologically complete response; ypT/N stage: pathologic T/N stage after preoperative CRT followed by radical surgery; mLNR: metastatic lymph node ratio; CRT: chemoradiotherapy; HR: hazard ratio; CI: confidence interval; NS: not significant
The p values that are significant (p≤0.05) are bolded.
Figure 1.

Kaplan-Meier curve according to pathologic complete response (pCR) status indicates that achievement of pCR leads to better overall survival (p<0.0001).
Figure 2.

Kaplan-Meier curve according to pathologic complete response (pCR) status indicates that achievement of pCR leads to better disease-free survival (p<0.0001).
Although no significant difference was found in the ratio of patients with pCR according to the interval between CRT and surgery (20.9% for 4–8 weeks vs. 17.9% for ≥8 weeks, p=0.39), both OS and DFS rates were significantly different in patients experiencing pCR at different intervals between CRT and surgery (4–8 weeks vs >8 weeks; 70.91 months vs 52.53 months, p=0.004 and 65.92 months vs 51.75 months, p=0. respectively) (Figures 3 and 4). No significant difference was found in most of the patient characteristics and CRT variables according to interval between CRT and surgery. Patients with an mLNR of >33% and having an abdominoperineal resection were significantly more in the short interval between CRT and surgery group compared to a long interval (12% vs. 7%, p=0.009; and 43% vs 36%, p=0.043; respectively). Table 5 and Figure 5 show the percentage of oncologic outcome parameters with each of the possible combinations of pCR status and interval between CRT and surgery. pCR patients with 4–8 weeks interval time had lower rates of distant metastasis (9% vs 20%, OR: 0.39, 95% CI: 0.18–1.83, p=0.01) and lower rates of any recurrences (13.6% vs 29.6%, OR: 0.37, 95% CI: 0.2–0.7, p=0.001) compared to the remaining patients. When the median survival duration of the patients within these groups was analyzed, statistically significant differences for OS (p=0.004) and DFS (p=0.0026) were observed among the four groups formed based on the treatment response (pCR or no-pCR) and interval between CRT and surgery (4–8 weeks or >8 weeks) (Table 5, Figure 5). Both OS and DFS of patients with pCR achieved at the 4–8 weeks interval between CRT and surgery were found to be better than the remaining groups (p<0.0001 for each).
Figure 3.
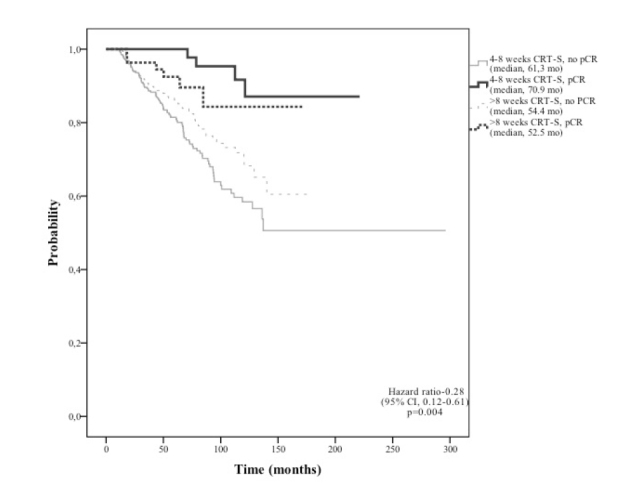
Kaplan-Meier curve according to treatment response (pCR status) and interval period from the completion of CRT to surgery indicates that pCR achieved within 4–8 week between CRT and surgery leads to the best overall survival (p=0.004).
Figure 4.

Kaplan-Meier curve according to treatment response (pCR status) and interval period from the completion of CRT to surgery indicates that pCR achieved within 4–8 week between CRT and surgery leads to disease-free survival (p=0.026).
Table 5.
Percentage of oncologic outcome pCR status and any interval between CRT and surgery.
| Variable | Possible combinations | |||
|---|---|---|---|---|
|
| ||||
| 1 | 2 | 3 | 4 | |
|
| ||||
| pCR | negative | positive | Negative | positive |
| CRT-surgery interval | 4–8 weeks | 4–8 weeks | >8 weeks | >8 weeks |
| Number of patients, n (%) | 350 (79.1) | 88 (20.9) | 391(82.1) | 85 (17.9) |
| locoregional recurrence only | 19/350 | 4/88 | 19/391 | 4/85 |
| distant metastasis only | 79/350 | 8/88 | 76/391 | 11/85 |
| Both | 24/350 | 0/88 | 13/391 | 0/85 |
| OS month (median) * | 61.3 | 70.9 | 54.4 | 52.5 |
| DFS month (median) ** | 52.8 | 65.9 | 47.0 | 51.7 |
| LRFS month (median) *** | 57.8 | 68.5 | 52.03 | 51.7 |
| DMFS month (median) **** | 55.1 | 66.2 | 47.6 | 52.5 |
pCR: pathologically complete response; CRT: chemoradiotherapy; OS: overall survival; DFS: disease-free survival; LRFS: local relapse–free survival; DMFS: distant metastasis–free survival.
The percentage of patients with pCR in each interval time are bolded.
p=0.030,
p<0.0001,
p=0.040,
p<0.0001
Figure 5.

The final outcome of patients according to treatment response (pCR status) and chemoradiotherapy-surgery interval.
DISCUSSION
Previous research by our group showed that pCR is associated with better local control and survival in locally advanced rectal cancer patients (13) operated 4–8 weeks after the completion of neoadjuvant treatment. When data of all patients with various intervals between CRT and surgery (including >8 weeks) were analyzed, a significant effect of pCR on survival decreased because of the patients who experienced pCR beyond 8 weeks (2009 Turkish National Cancer Congress abstract presentation). These findings prompted us to evaluate the literature in detail and to examine the outcome of these patients in a larger population; therefore, a multicentric national study was planned. pCR was observed in approximately 20% of patients. Patients without pCR recurred twice more often than patients with pCR when evaluated after a median of 60.5 months. Moreover, patients without pCR exhibited both reduced OS and DFS. Complete regression of the primary tumor within 4–8 weeks was found to be associated with better disease control in the lymph nodes and finally resulted in sustained local control (95%) and a minor risk to develop distant metastases (DFS: 86%) and better OS (98%). Subgroup analysis showed that patients who experienced pCR within 4–8 weeks interval had the best OS and DFS.
This finding may be a surprise to colorectal surgeons, though it may not be an unexpected outcome for radiation oncologists. The most commonly used time interval between the completion of preoperative CRT and surgical resection has traditionally been 4–6 weeks when the acute radiation-induced toxicity has subsided (14). In daily practice, it has often been between 6 and 8 weeks, as it was the most common interval time in the meta-analysis that had shown the impact of pCR on local control and survival (3, 7). The data showed that the response to CRT in rectal cancer patients is time-dependent and maximal tumor regression may take longer than the standard 6-week interval. Increased pCR rates were observed with longer interval times (8,15), which was confirmed in a meta-analysis as well (16). This meta-analysis contains retrospective studies and the only advantage of the increased interval was increased pCR rates. Moreover, the increased pCR rates with a longer interval time did not translate into better local control and survival rates. Thus, the result should be interpreted with caution. Recently, a prospective, randomized French study did not detect any difference in pCR rates between 7- and 11-week intervals after preoperative CRT (10). Despite the conflicting results in the literature, prolonging the interval to surgery has become more popular worldwide such as a transitional behavior of adapting nonoperative approach reported by Habr-Gama et al. (17). Even though there are significant data from randomized trials to support the benefits of preoperative multimodality therapy for locally advanced rectal cancer, there is less evidence regarding optimal timing for surgery in terms of oncologic outcome (18).
The knowledge of the nature and biology of rectal cancer has expanded, and the investigators have identified new factors that would help stratify the clinicopathologic features of rectal cancer in clinical practice. It is currently unclear why a proportion of tumors respond to CRT and others do not, and whether it is possible to predict in advance which cases will respond favorably to the preoperative treatment. In this study, the best survival rates are achieved with a short interval. It is not surprising that pCR is a good prognostic factor. Although the interval did not affect pCR rate, survival times were different between long interval-pCR and short interval-pCR. One explanation for good prognosis after early pCR is that pCR after CRT is indicative of a prognostically favorable biological tumor profile, with chemoradiosensitivity and less propensity of distant failure (7). Another explanation may be the longer period between diagnosis and initiation of adjuvant CT aimed at killing systemic tumor deposits. During the time interval, the subclinical deposit may grow to a size that takes no longer to eradicate. Thus, the published literature is inadequate to explain the importance of pCR achieved at different intervals. In other words, it is doubtful whether pCR experienced at any time after CRT has the same impact on survival with the conflicting data of the published literature. pCR may be an important predictive marker to guide the subsequent treatment; therefore, it is unsuitable to accept pCR only as an optimal primary endpoint. Moreover, no pCR after delayed surgery has had the same outcome for all patients. Therefore, possible benefits of delayed surgery for some patients should be carefully weighed against potential disadvantages including increased risk of tumor regrowth or metastases and delayed postoperative chemotherapy. In addition, it must be remembered that the main principle of medicine is “primum non nocere.”
Pathological staging of rectal cancer after preoperative CRT (ypTN stage) remains a critical prognostic determinant of DFS (19). The response of the primary tumor was found to be correlated with the response of the lymph nodes. Additionally, the association between the poor pathologic response of the metastatic lymph nodes to CRT and the high risk of distant metastasis has been previously reported (20). The current analysis has demonstrated that the risk of any recurrence and death was approximately three times higher in ypN-positive patients compared to ypN0 patients. Poor pathologic response of metastatic lymph nodes to CRT was also associated with both poor OS and, poor DFS. The reason may be the inadequate dissection of lymph nodes (< 12 lymph nodes in 55% of the patients). Possibly, fewer positive LNs were found because fewer LNs were harvested. This is why mLNR was accounted for instead of the absolute number of positive lymph nodes. No randomized data are preset on the impact of tumor distance from the anal verge and LVI status on pCR rates. Patients with small tumors (<4 cm) and bigger tumors (>8 cm) were observed to be less likely to have a pCR in retrospective data (21).
Although the major limitation of the current study seems to be the retrospective design, it was performed by experienced authors from multicenter and approximately 1,000 patients were included. The treatment and follow-up progress of each patient have been recorded and updated prospectively. Therefore, all the data which represents a real-life experience recorded prospectively at each center were collected retrospectively for the current comprehensive study as a mirror of a real-life experience. Moreover, pCR rates and survival times were similar to those observed in the literature. Thus, oncological outcomes were compatible. All of these do not change the fact that the smaller number of patients in the subgroups and uncontrolled characteristics related to the tumor, patients, and treatment might have caused bias. It is not clear whether some patients operated >8 weeks after the completion of CRT had achieved pCR at an earlier point (4–8 weeks). Unplanned exploratory analysis of the subgroup, thus the statistical fluctuations as another limitation, may have biased the estimation effect making any conclusions questionable.
In conclusion, we found that achievement of pCR after preoperative CRT in locally advanced rectal cancer correlated with better oncologic outcomes. Metastatic lymph node ratio has an impact on the oncological outcomes. The best OS and DFS durations were achieved in patients who experienced pCR within 4 to 8-week interval before surgery. Nonetheless, we acknowledge that our results require verification in larger, randomized, and controlled trials. However, the observed difference in survival duration according to the interval between CRT and surgery is striking.
MAIN POINTS.
pCR achieved with preoperative CRT in LARC correlated with better oncologic outcome.
The interval time between the completion of CRT and surgical resection did not differ the ratio of patients with pCR.
Subgroup analysis showed that patients with pCR within 4–8 weeks interval had the best OS and DFS.
Footnotes
This study was presented at the 22th National Cancer Congress, April 19-23, 2017 Antalya, Turkey, and awarded as the best research of the congress.
Ethics Committee Approval: Retrospective studies were not included within “the Regulations of Ethics Committee of Non-invasive Clinical Researches” of the year 2016, therefore, permission of the archival documentation was taken from the management of the related hospital.
Informed Consent: Informed consent is not necessary due to the retrospective nature of this study.
Peer-review: Externally peer-reviewed.
Author Contributions: Concept – D.K., E.K.S., S.Ö.; Design – D.K., F.S., D.Y.; Supervision – D.K., İ.B.G.; Resource – D.K., Z.A.A., N.A.; Materials – D.K., H.T.Y., F.G.; Data Collection and/or Processing – D.K., F.S.; N.A.; Analysis and/or Interpretation – D.K., A.K., D.Y.; Literature Search –D.K., F.S., İ.B.G.; Writing – D.K., İ.B.G., D.Y.; Critical Reviews – D.K., İ.B.G., D.Y.
Conflict of Interest: The authors have no conflict of interest to declare.
Financial Disclosure: The authors declared that this study has received no finacial support.
REFERENCES
- 1.NIH Consensus Conference. Adjuvant therapy for patients with colon and rectal cancer. JAMA. 1990;264:1444–50. doi: 10.1001/jama.1990.03450110090034. [DOI] [PubMed] [Google Scholar]
- 2.Sauer R, Becker H, Hohenberger W, et al. German Rectal Cancer Study Group. Preoperative versus postoperative chemoradiotherapy for rectal cancer. N Engl J Med. 2004;351:1731–40. doi: 10.1056/NEJMoa040694. [DOI] [PubMed] [Google Scholar]
- 3.Maas N, Nelemans PJ, Valentini V, et al. Long-term outcome in patients with a pathological complete response after chemoradiation for rectal cancer: a pooled analysis of individual patient data. Lancet Oncol. 2010;11:835–44. doi: 10.1016/S1470-2045(10)70172-8. [DOI] [PubMed] [Google Scholar]
- 4.Quah HM, Chou JF, Gonen M, et al. Pathologic stage is most prognostic of disease-free survival in locally advanced rectal cancer patients after preoperative chemoradiation. Cancer. 2008;113:57–64. doi: 10.1002/cncr.23516. [DOI] [PubMed] [Google Scholar]
- 5.Pucciarrelli S, Toppan P, Friso ML, et al. Complete pathologic response following preoperative chemoradiation therapy for middle to lower rectal cancer is not a prognostic factor for a better outcome. Dis Colon Rectum. 2004;47:1798–807. doi: 10.1007/s10350-004-0681-1. [DOI] [PubMed] [Google Scholar]
- 6.Martin ST, Heneghan HM, Winter DC. Systematic review and meta-analysis of outcomes following pathological complete response to neoadjuvant chemoradiotherapy for rectal cancer. Br J Surg. 2012;99:918–28. doi: 10.1002/bjs.8702. [DOI] [PubMed] [Google Scholar]
- 7.Zorcolo L, Rosman AS, Restivo A, et al. Complete pathologic response after combined modality treatment for rectal cancer and long-term survival: a meta-analysis. Ann Surg Oncol. 2012;19:2822–32. doi: 10.1245/s10434-011-2209-y. [DOI] [PubMed] [Google Scholar]
- 8.Tulchinsky H, Shmueli E, Figer A, et al. An interval >7 weeks between neoadjuvant therapy and surgery improves pathologic complete response and disease-free survival in patients with locally advanced rectal cancer. Ann Surg Oncol. 2008;15:2661–7. doi: 10.1245/s10434-008-9892-3. [DOI] [PubMed] [Google Scholar]
- 9.Stein DE, Mahmoud NN, Anne PR, et al. Longer time interval between completion of neoadjuvant chemoradiation and surgical resection does not improve downstaging of rectal carcinoma. Dis Colon Rectum. 2003;46:448–53. doi: 10.1007/s10350-004-6579-0. [DOI] [PubMed] [Google Scholar]
- 10.Lefevre JH, Mineur L, Kotti S, et al. Effect of interval (7 or 11 weeks) between neoadjuvant radiochemotherapy and surgery on complete pathologic response in rectal cancer: A multicentric, randomized controlled trial (GRECCAR-6) J Clin Oncol. 2016;34:3773–80. doi: 10.1200/JCO.2016.67.6049. [DOI] [PubMed] [Google Scholar]
- 11.Du D, Su Z, Wang D, et al. Optimal interval to surgery after neoadjuvant chemoradiotherapy in rectal cancer: A systematic review and meta-analysis. Clin Colorectal Cancer. 2018;17:13–24. doi: 10.1016/j.clcc.2017.10.012. [DOI] [PubMed] [Google Scholar]
- 12.Edge SB, Byrd DR, Compton CC, et al., editors. AJCC Cancer staging manual. 7th ed. New York: Springer; 2010. [Google Scholar]
- 13.Unsal (Kilic) D, Tunc E, Mentes BB, et al. The importance of pathologic complete response in rectal cancer patients treated by preoperative chemoradiotherapy. Int J Hemat Oncol. 2005;3:120–31. [Google Scholar]
- 14.Glimelius B. On a prolonged interval between rectal cancer (chemo)radiotherapy and surgery. Upsala Journal of Medical Sciences. 2017;122:1–10. doi: 10.1080/03009734.2016.1274806. [DOI] [PMC free article] [PubMed] [Google Scholar]
- 15.Kalady MF, deCampos Lobato LF, Stocchi L, et al. Predictive factors of pathologic complete response after neoadjuvant chemoradiation for rectal cancer. Ann Surg. 2009;250:582–9. doi: 10.1097/SLA.0b013e3181b91e63. [DOI] [PubMed] [Google Scholar]
- 16.Petrelli F, Sgroi G, Sarti E, et al. Increasing the interval between neoadjuvant chemoradiotherapy and surgery in rectal cancer: A meta-analysis of published studies. Ann Surg. 2016;263:458–64. doi: 10.1097/SLA.0000000000000368. [DOI] [PubMed] [Google Scholar]
- 17.Habr-Gama A, Sabbaga J, Gama-Rodrigues J, et al. Watch and wait approach following extended neoadjuvant chemoradiation for distal rectal cancer: are we getting closer to anal cancer management? Dis Colon Rectum. 2013;56:1109–17. doi: 10.1097/DCR.0b013e3182a25c4e. [DOI] [PubMed] [Google Scholar]
- 18.Gollins S, Sebag-Montefiore D. Neoadjuvant treatment strategies for locally advanced rectal cancer. Clin Oncol. 2016;28:146–51. doi: 10.1016/j.clon.2015.11.003. [DOI] [PubMed] [Google Scholar]
- 19.Miller ED, Robb BW, Cummings OW, et al. The effects of preoperative chemoradiotherapy on lymph node sampling in rectal cancer. Dis Colon Rectum. 2012;55:1002–7. doi: 10.1097/DCR.0b013e3182536d70. [DOI] [PubMed] [Google Scholar]
- 20.Bujko K, Michalski W, Kepka L, et al. Association between pathologic response in metastatic lymph nodes after preoperative chemoradiotherapy and risk of distant metastases in rectal cancer: An analysis of outcomes in a randomized trial. Int J Radiat Oncol Biol Phys. 2007;67:369–77. doi: 10.1016/j.ijrobp.2006.08.065. [DOI] [PubMed] [Google Scholar]
- 21.Patel SV, Roxburg CS, Vakiani E, et al. Distance to the anal verge is associated with pathologic complete response to neoadjuvant therapy in locally advanced rectal cancer. J Surg Oncol. 2016;114:637–41. doi: 10.1002/jso.24358. [DOI] [PMC free article] [PubMed] [Google Scholar]