

Abstract
Background
Older age and elevated d-dimer are reported risk factors for coronavirus disease 2019 (COVID-19). However, whether early radiographic change is a predictor of fatality remains unknown.
Methods
We retrospectively reviewed records of all laboratory-confirmed patients admitted to a quarantine unit at Tongji Hospital, a large regional hospital in Wuhan, China, between January 31 and March 5, 2020. Confirmed cases were defined by positive RT-PCR detection of severe acute respiratory syndrome coronavirus 2 (SARS-CoV-2) in throat-swab specimens. Chest CT images were reviewed independently by two radiologists. The Tongji Hospital ethics committee approved this study.
Results
A total of 102 patients were confirmed to have SARS-CoV-2 infection. As of March 25, 85 confirmed patients were discharged, 15 died, and 2 remained hospitalized. When compared with survivors, non-survivors were older (median age, 69 [interquartile range, 58–77] vs. 55 [44–66], p = 0.003), and more likely to have decreased lymphocyte count (0.5 vs. 0.9 × 10⁹/L, p = 0.006), elevated lactate dehydrogenase (LDH) (569.0 vs. 272.0 U/L, p < 0.001), elevated d-dimer (> 1 μg/mL, 86% vs. 37%, p = 0.002) on admission. Older age and elevated LDH were independent risk factors for fatality in a multivariate regression model included the above variables. In a subset of patients with CT images within the first week, higher total severity score, and more involved lung lobes (5 involved lobes) in CT images within the first week were significantly associated with fatality. Moreover, in this subset of patients, higher total severity score was the only independent risk factor in a multivariate analysis incorporating the above mentioned variables.
Conclusions
Older age, elevated LDH on admission, and higher severity score of CT images within the first week are potential predictors of fatality in adults with COVID-19. These predictors may help clinicians identify patients with a poor prognosis at an early stage.
Keywords: Radiographic findings, Predictor, Fatality, COVID-19
Background
As of April 2, 2020, there were 823,626 confirmed cases of coronavirus disease 2019 (COVID-19) and 40,598 deaths worldwide [1]. Older age and elevated d-dimer are reported risk factors for COVID-19 [2–4]. However, whether early radiographic change is a predictor of fatality remains unknown.
COVID-19 is caused by a novel coronavirus named severe acute respiratory syndrome coronavirus 2 (SARS-CoV-2, previously known as 2019-nCoV). SARS-CoV-2 shares similarity with the severe acute respiratory syndrome coronavirus (SARS-CoV) in the disease dynamics, the transmission route, and the cell entry receptors angiotensin-converting enzyme 2 (ACE2) [5–7]. These two viruses are highly homologic to SARS-like coronaviruses isolated from bats and the genomes of these two virus have 86% identity [5]. Person-to-person transmission of SARS-CoV-2 occurs primarily via direct contact or through droplets from an infected individual. SARS-CoV-2 targets the respiratory system, leading to pneumonia and respiratory failure in critical patients. Cardiac and renal involvement was also reported [8, 9]. Cytokine storm and systemic inflammatory response syndrome contribute to the pathogenesis of multiple organ failure and coagulation activation in critical patients with COVID-19 [10, 11]. Neutrophil extracellular traps (NETs) is another potential driver of organ damage and mortality in COVID-19 [12]. The most common symptoms at the onset of COVID-19 are fever, cough, fatigue, dyspnea and sputum production [13–16]. The representative chest CT findings on admission were bilateral multiple lobular ground-glass opacity and consolidation [13]. We hypothesized that the extent of the lung lesions in early CT images after symptom onset is a potential predictor of fatality of COVID-19.
In this retrospective cohort study, we reviewed records of 102 laboratory-confirmed patients admitted to a quarantine unit at Tongji Hospital, a large regional hospital in Wuhan, China, between January 31 and March 5, 2020. The demographic, clinical characteristics, laboratory and radiographic findings between survivors and non-survivors were compared and analysed in univariate and multivariate regression models to identify the potential predictors of fatality in COVID-19.
Methods
Study population and data collection
This retrospective study was approved by the institutional ethics board of Tongji Hospital of Tongji Medical College of Huazhong University of Science and Technology. Written informed consent was waived. The study included all patients with laboratory-confirmed COVID-19 admitted to a quarantine unit of Tongji Hospital, a large regional hospital in Wuhan, China, between January 31 and March 25, 2020. COVID-19 patients were diagnosed according to World Health Organization (WHO) interim guideline [17]. Confirmed cases were defined by the positive findings in reverse-transcriptase–polymerase-chain-reaction (RT-PCR) assay of throat swab specimens [18]. Clinical characteristics, laboratory test results, and treatment information were extracted from electronic medical records. All laboratory testing and radiological examination were performed according to the clinical care needs of the patient. The criteria for discharge of the patients were relief of clinical symptoms and negative results of two consecutive RT-PCR assays (the time interval for the two assays > 24 h) [19].
RT-PCR for SARS-CoV-2
Throat swab specimens were tested for SARS-CoV-2 using real-time RT-PCR according to the WHO protocol. The following primers and probes were used for real-time RT-PCR detection of N gene of SARS-CoV-2: N forward primer 5′-GAGCCTTGAATACACCAAAAG-3′, N reverse primer 5′-GCACGATTGCAGCATTGTTAGCAGGATT-3′, N probe 5′-FAMCACATTGGCACCCGCAATCC-MGB-3′. Positive results were confirmed in two independent real-time RT-PCR assays.
Chest CT protocols and evaluation
High-resolution transverse CT images were obtained using Optima 660 (GE Medical System, Milwaukee, USA) or Somatom Definition AS+ (Siemens Healthineers, Forchheim, Germany). Tube voltage was 100 or 120 kV, and automatic tube current modulation was 100–400 mA. All images were reconstructed with a slice thickness of 1.0 mm or 1.25 mm. The CT images were reviewed by two radiologists (ZW and NW) who were blinded to the final outcome of the patients. Images were reviewed independently. Any disagreements were resolved by discussion and consensus.
A scoring system was used to estimate the extent of lung opacification based on the area involved [20]. Each of the five lung lobes was visually scored from 0 to 5 as: 0, no involvement; 1, < 5% involvement; 2, 5–25% involvement; 3, 26–49% involvement; 4, 50–75% involvement; 5, > 75% involvement. The total severity score was the sum of scores of each lobe, ranging from 0 (no involvement) to 25 (maximum involvement).
Statistical analysis
Statistical analysis was done with SPSS Statistics Software (version 26; IBM, New York, USA). Continuous variables were presented as median (IQR) and compared using Mann-Whitney U test; categorical variables were presented as number (%) and compared using χ2 test or Fisher’s exact test between survivors and non-survivors where appropriate. One-way ANOVA with Bonferroni’s multiple comparison test was performed for comparisons between multiple groups of continuous data. Univariable and multivariable logistic regression models were used to estimate odds ratios and the 95% confidence intervals of the risk factors associated with fatal outcome. A two-sided α of less than 0.05 was considered statistically significant.
Results
Demographics and clinical characteristics
A total of 128 patients were admitted. One hundred and two patients were confirmed to have SARS-CoV-2 infection. As of March 25, 85 confirmed patients were discharged, 15 died, and 2 remained hospitalized. The median age was 57 years (interquartile range, 45–70), 59 (58%) were male. The percentage of patients older than 65 years was two-fold higher in non-survivors compared to survivors (Table 1). Forty-four (43%) patients had one or more comorbidities, with hypertension and diabetes mellitus being the most common comorbidity. Coronary heart disease was more frequently observed in non-survivors compared to the survivors (Table 1).
Table 1.
Demographics and baseline characteristics of patients with COVID-19
| Total (n = 102) | Non-survivor (n = 15) | Survivor (n = 87) | p value | |
|---|---|---|---|---|
| Characteristics | ||||
| Age, years | 57 (45–70) | 69 (58–77) | 55 (44–66) | 0.003 |
| < 65 | 70 (69%) | 6 (40%) | 64 (74%) | 0.010 |
| ≥ 65 | 32 (31%) | 9 (60%) | 23 (26%) | .. |
| Sex | ||||
| Female | 43 (42%) | 4 (27%) | 39 (45%) | 0.188 |
| Male | 59 (58%) | 11 (73%) | 48 (55%) | .. |
| Any Comorbidity | 44 (43%) | 9 (60%) | 35 (40%) | 0.153 |
| Diabetes | 15 (15%) | 2 (13%) | 13 (15%) | 0.871 |
| Hypertension | 31 (30%) | 7 (47%) | 24 (28%) | 0.138 |
| Coronary heart disease | 4 (4%) | 2 (13%) | 2 (2%) | 0.042 |
| Chronic obstructive pulmonary disease | 2 (2%) | 1 (7%) | 1 (1%) | 0.155 |
| Malignancy | 5 (5%) | 0 (0%) | 5 (6%) | 1.000 |
| Chronic liver disease | 3 (3%) | 0 (0%) | 3 (3%) | 1.000 |
| Other | 28 (27%) | 5 (33%) | 23 (26%) | 0.580 |
| Current smoker | 7 (7%) | 1 (7%) | 6 (7%) | 0.974 |
| Symptoms and signs | ||||
| Fever | 94 (92%) | 14 (93%) | 80 (92%) | 0.854 |
| Highest temperature, °C | 38.6 (38.0–39.0) | 38.5 (38.0–38.9) | 38.6 (38.0–39.0) | 0.458 |
| Chills | 23 (23%) | 3 (20%) | 20 (23%) | 0.798 |
| Cough | 77 (75%) | 13 (87%) | 64 (74%) | 0.276 |
| Sputum | 26 (25%) | 6 (40%) | 20 (23%) | 0.163 |
| Dyspnea | 52 (51%) | 7 (48%) | 45 (52%) | 0.717 |
| Hemoptysis | 5 (5%) | 1 (7%) | 4 (5%) | 0.732 |
| Chest pain | 7 (7%) | 1 (7%) | 6 (7%) | 0.974 |
| Headache | 18 (18%) | 3 (20%) | 15 (17%) | 0.796 |
| Fatigue | 35 (34%) | 5 (33%) | 30 (34%) | 0.931 |
| Nausea | 6 (6%) | 1 (7%) | 5 (6%) | 0.889 |
| Diarrhea | 18 (18%) | 4 (27%) | 14 (16%) | 0.321 |
| Myalgia | 24 (24%) | 3 (20%) | 21 (24%) | 0.727 |
| Systolic pressure, mm Hg | 129.0 (112.0–144.0) | 144.0 (126.0–170.0) | 127.0 (112.0–141.0) | 0.009 |
| Heart rate, beats per minute | 93.0 (80.0–103.0) | 102.0 (86.0–111.0) | 92.0 (80.0–103.0) | 0.161 |
| Respiratory rate | 20.0 (20.0–24.0) | 24.0 (21.0–25.0) | 20.0 (20.0–23.0) | 0.003 |
| > 20 breaths per min | 47 (46%) | 12 (80%) | 35 (40%) | 0.004 |
| Time from symptom onset to hospital admission, days | 11.0 (7.0–16.0) | 9.0 (6.0–14.0) | 11.0 (8.0–18.0) | 0.291 |
Data are median (IQR), n (%), or n/N (%), where N is the total number of patients with available data. p values comparing survivor with non-survivor were calculated by χ2 test, Fisher’s exact test, or Mann-Whitney U test, as appropriate. COVID-19, coronavirus disease 2019
The most common symptoms were fever (92%), cough (75%), and dyspnea (51%). Tachypnea (respiratory rate > 20 / min) and higher systolic blood pressure were more common in non-survivors compared to survivors (Table 1). The median time between symptom onset and admission was 11 (7–16) days.
Laboratory findings
When compared with survivors, non-survivors were more likely to have decreased lymphocyte count (0.5 vs. 0.9 × 10⁹/L, p = 0.006), thrombocytopenia (60% vs. 8%, p < 0.001), elevated lactate dehydrogenase (LDH) (569.0 vs. 272.0 U/L, p < 0.001), elevated d-dimer (> 1 μg/mL, 86% vs. 37%, p = 0.002), increased hypersensitive troponin I (> 34 pg/mL, 47% vs. 7%, p < 0.001), increased NT-proB-type natriuretic peptide (≥ 241 pg/mL, 93% vs. 27%, p < 0.001), elevated creatinine (> 104 μmol/L, 40% vs. 8%, p = 0.001), elevated blood urea nitrogen (> 9.5 mmol/L, 47% vs. 4%, p < 0.001), and increased inflammation markers including C-reactive protein (78.7 vs. 25.4 mg/L, p = 0.003) and procalcitonin (≥ 0.05 ng/mL, 100% vs. 54%, p < 0.001) (Table 2). Notably, we also observed a significant difference in the expression of inflammation-related cytokines including interleukin (IL)-6, IL-8 and tumor necrosis factor (TNF)-α between the two subsets. The levels of these cytokines were markedly increased in non-survivors compared to survivors (Table 2).
Table 2.
Laboratory findings of patients with COVID-19 on admission
| Normal range | Total (n = 102) | Non-survivor (n = 15) | Survivor (n = 87) | p value | |
|---|---|---|---|---|---|
| White blood cell count, × 109/L | 4.00–10.00 | 6.0 (4.4–8.6) | 9.1 (5.5–11.2) | 5.8 (4.4–8.1) | 0.011 |
| < 4 | 11 (11%) | 1 (7%) | 10 (11%) | 0.019 | |
| 4–10 | 75 (74%) | 8 (53%) | 67 (78%) | .. | |
| > 10 | 16 (15%) | 6 (40%) | 10 (11%) | .. | |
| Neutrophil count, × 109/L | 1.80–6.30 | 4.2 (2.9–6.8) | 8.0 (3.5–10.6) | 4.1 (2.8–6.2) | 0.006 |
| Lymphocyte count, × 109/L | 1.10–3.20 | 0.9 (0.6–1.2) | 0.5 (0.4–0.8) | 0.9 (0.7–1.2) | 0.006 |
| < 1·1 | 66 (65%) | 12 (80%) | 54 (62%) | 0.180 | |
| ≥1·1 | 36 (35%) | 3 (20%) | 33 (38%) | .. | |
| Hemoglobin, g/L | 130.0–175.0 | 128.0 (115.0–138.0) | 120.0 (110.0–135.0) | 128.0 (115.0–139.0) | 0.571 |
| Platelet count, × 109/L | 125.0–350.0 | 194.0 (152.0–250.5) | 113.0 (97.0–165.0) | 206.5 (162.8–267.5) | 0.001 |
| < 125 | 16/101 (16%) | 9 (60%) | 7/86 (8%) | 0.000 | |
| ≥125 | 85/101 (84%) | 6 (40%) | 79/86 (92%) | .. | |
| Lactate dehydrogenase, U/L | 135–225 | 294.5 (219.3–417.5) | 569.0 (362.0–664.0) | 272.0 (205.0–383.0) | 0.000 |
| ≤225 | 27 (26%) | 1 (7%) | 26 (30%) | 0.060 | |
| > 225 | 75 (74%) | 14 (93%) | 61 (70%) | .. | |
| D-dimer, μg/mL | ≤0·5 | 0.8 (0.5–1.7) | 2.1 (1.2–4.4) | 0.7 (0.4–1.5) | 0.000 |
| ≤0·5 | 28 (27%) | 1 (7%) | 27 (31%) | 0.002 | |
| > 0·5 to ≤1 | 29 (28%) | 1 (7%) | 28 (32%) | .. | |
| > 1 | 45 (45%) | 13 (86%) | 32 (37%) | .. | |
| Prothrombin time, s | 11.5–14.5 | 14.2 (13.7–14.8) | 14.9 (14.1–17.1) | 14.1 (13.6–14.5) | 0.001 |
| < 14.5 | 65 (64%) | 4 (27%) | 61 (70%) | 0.001 | |
| ≥14.5 | 37 (36%) | 11 (73%) | 26 (30%) | .. | |
| International Normalized Ratio, INR | 0.80–1.20 | 1.08 (1.04–1.15) | 1.16 (1.08–1.37) | 1.08 (1.02–1.12) | 0.001 |
| Hypersensitive troponin I, pg/mL | ≤34.2 | 5.2 (2.2–16.2) | 24.1 (13.0–202.1) | 4.3 (2.0–10.6) | 0.000 |
| ≤34.2 | 88/101 (87%) | 8 (53%) | 80/86 (93%) | 0.000 | |
| > 34.2 | 13/101 (13%) | 7 (47%) | 6/86 (7%) | .. | |
| NT-proB-type Natriuretic Peptide (BNP), pg/mL | < 241 | 131.0 (53.5–355.8) | 817.5 (348.5–3031.0) | 92.5 (42.3–266.5) | 0.000 |
| < 241 | 64/100 (64%) | 1/14 (7%) | 63/86 (73%) | 0.000 | |
| ≥241 | 36/100 (36%) | 13/14 (93%) | 23/86 (27%) | .. | |
| Albumin, g/L | 35–52 | 34.8 (31.7–39.5) | 31.5 (28.5–34.0) | 36.5 (32.5–39.8) | 0.002 |
| < 35 | 52 (51%) | 13 (97%) | 39 (45%) | 0.003 | |
| ≥35 | 50 (49%) | 2 (13%) | 48 (55%) | .. | |
| Alanine aminotransferase, U/L | ≤41 | 23.0 (14.0–34.3) | 17.0 (13.0–29.0) | 23.0 (14.0–35.0) | 0.223 |
| ≤41 | 86 (84%) | 14 (93%) | 72 (83%) | 0.298 | |
| > 41 | 16 (16%) | 1 (7%) | 15 (17%) | .. | |
| Aspartate aminotransferase, U/L | ≤40 | 26.0 (19.0–41.8) | 34.0 (24.0–54.0) | 25.0 (19.0–38.0) | 0.187 |
| ≤40 | 75 (74%) | 9 (80%) | 66 (76%) | 0.198 | |
| > 40 | 27 (26%) | 6 (20%) | 21 (24%) | .. | |
| Total bilirubin, μmol/L | ≤26 | 8.5 (6.6–11.6) | 8.4 (6.6–15.3) | 8.5 (6.6–11.4) | 0.752 |
| Creatinine, μmol/L | 59–104 | 68.0 (59.5–84.3) | 94.0 (63.0–164.0) | 67.0 (58.0–84.0) | 0.014 |
| ≤104 | 89 (87%) | 9 (60%) | 80 (92%) | 0.001 | |
| > 104 | 13 (13%) | 6 (40%) | 7 (8%) | .. | |
| Blood urea nitrogen, mmol/L | 3.6–9.5 | 4.6 (3.2–6.2) | 9.2 (5.4–13.7) | 4.3 (3.2–5.5) | 0.000 |
| ≤9.5 | 91 (89%) | 8 (53%) | 83 (96%) | 0.000 | |
| > 9.5 | 11 (11%) | 7 (47%) | 4 (4%) | .. | |
| Potassium, mmol/L | 3.50–5.10 | 4.2 (3.8–4.5) | 4.4 (3.6–5.1) | 4.1 (3.8–4.5) | 0.171 |
| < 3.5 | 13 (13%) | 2 (13%) | 11 (13%) | 0.012 | |
| 3.5–5.1 | 81 (79%) | 9 (60%) | 72 (83%) | .. | |
| > 5.1 | 8 (8%) | 4 (27%) | 4 (4%) | .. | |
| Sodium, mmol/L | 136–145 | 137.7 (135.8–141.1) | 138.6 (133.9–142.6) | 137.6 (136.0–141.1) | 0.970 |
| < 136 | 26 (25%) | 5 (33%) | 21 (24%) | 0.248 | |
| 136–145 | 74 (73%) | 9 (60%) | 65 (75%) | .. | |
| > 145 | 2 (2%) | 1 (7%) | 1 (1%) | .. | |
| Calcium, mmol/L | 2.20–2.55 | 2.1 (2.0–2.2) | 2.0 (1.9–2.2) | 2.1 (2.1–2.3) | 0.004 |
| < 2.2 | 70 (69%) | 14 (93%) | 56 (64%) | 0.026 | |
| ≥2.2 | 32 (31%) | 1 (7%) | 31 (36%) | .. | |
| Procalcitonin, ng/mL | < 0.05 | 0.06 (0.03–0.15) | 0.19 (0.12–0.60) | 0.05 (0.03–0.10) | 0.000 |
| < 0·05 | 40 (39%) | 0 (0%) | 40 (46%) | 0.000 | |
| ≥0·05 | 62 (61%) | 15 (100%) | 47 (54%) | .. | |
| High-sensitivity C-reactive Protein (hs-CRP), mg/L | < 1 | 34.0 (5.8–86.6) | 78.7 (51.3–166.3) | 25.4 (3.9–81.3) | 0.003 |
| < 3 | 16 (16%) | 0 (0%) | 16 (18%) | 0.119 | |
| ≥3 | 86 (84%) | 15 (100%) | 71 (82%) | .. | |
| IL-1β, pg/ml | < 5 | 4.9 (4.0–4.9) | 4.5 (4.0–4.9) | 4.9 (4.0–4.9) | 0.388 |
| IL-2R, U/ml | 223–710 | 605.5 (380.8–896.8) | 1166.5 (898.8–1788.5) | 571.5 (353.0–821.8) | 0.001 |
| IL-6, pg/ml | < 7 | 4.7 (2.2–20.3) | 48.4 (12.6–154.1) | 4.2 (1.9–16.4) | 0.000 |
| IL-8, pg/ml | < 62 | 10.2 (6.7–19.9) | 22.0 (14.0–28.4) | 9.3 (6.4–18.6) | 0.006 |
| IL-10, pg/ml | < 9.1 | 4.9 (4.0–4.9) | 4.9 (4.0–10.0) | 4.9 (4.0–4.9) | 0.601 |
| TNF-α, pg/ml | < 8.1 | 7.5 (5.6–10.1) | 13.0 (8.3–23.3) | 7.3 (5.6–9.4) | 0.006 |
Data are median (IQR), n (%), or n/N (%), where N is the total number of patients with available data. p values comparing survivor with non-survivor were calculated by χ2 test, Fisher’s exact test, or Mann-Whitney U test, as appropriated. COVID-19, coronavirus disease 2019
Radiographic findings
Chest CT is crucial for clinical diagnosis and monitoring temporal changes of the pneumonia caused by SARS-CoV-2. Based on the interval between symptom onset and CT scan, we classified the CT images into 4 stages: week 1 (≤ 7 days after symptom onset), week 2 (> 7 days, ≤ 14 days), week 3 (> 14 days, ≤ 21 days), and week 4 (> 21 days, ≤ 28 days). Twenty-seven survivors had CT images of 3–4 stages. Twenty-one survivors and eleven non-survivors had CT scans within the first week. The demographics, clinical features, and laboratory findings on admission of survivors and non-survivors in this subset were similar to those observed in the entire cohort (Supplementary Tables 1, 2).
The total severity score and number of involved lung lobes within the first week were significantly greater in non-survivors compared to survivors (Fig. 1a, b, Table 3). Within the first week after symptom onset, two (10%) survivors had normal CT findings, four (19%) survivors had unilateral lung opacification. Fifteen (71%) of survivors whereas eleven (100%) of non-survivors had bilateral lung involvement (Fig. 2). For survivors with serial CT scans performed over 4 weeks, total severity score tended to peak in the second week (Fig. 1c, Table 3).
Fig. 1.
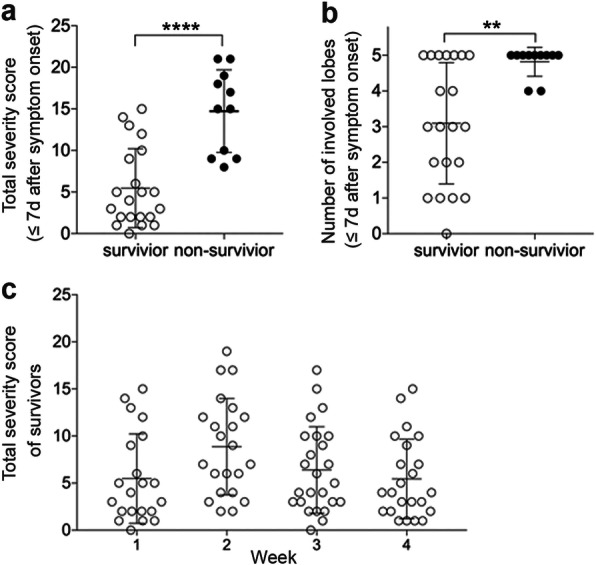
Total severity score and number of involved lung lobes in CT images of survivor and non-survivor. a-b, total severity score (a) and the number of involved lung lobes (b) in CT images of survivors (n = 21) and non-survivors (n = 11) within the first week (≤7d) after symptom onset. Values of survivors and non-survivors were presented with open and closed circles, respectively. Mann-Whitney U test was used. ****, p < 0.0001; **, p < 0.01. C. total severity score in CT images of week 1, 2, 3, 4 of the survivors. One-way ANOVA with Bonferroni’s multiple comparison test was used, and there was no significant difference between total severity socres of the 4 weeks
Table 3.
CT features of patients with COVID-19
| Week 1 (≤ 7d) after symptom onset | Week 2 (> 7d, ≤ 14d) | Week 3(>14d, ≤ 21d) | Week 4(>21d, ≤ 28d) | ||
|---|---|---|---|---|---|
| Survivor (n = 21) | Non-Survivor (n = 11) | Survivor(n = 22) | Survivor(n = 25) | Survivor(n = 23) | |
| Severity score of each lobe | |||||
| Right upper lobe | 1 (0–1.5) | 3 (2–4)*** | 2 (1–2) | 1 (0.5–2) | 1 (0–2) |
| Right middle lobe | 0 (0–1) | 2 (1–2) | 1 (0–1) | 0 (0–1) | 0 (0–1) |
| Right lower lobe | 1 (1–3) | 3 (3–4) | 2.5 (1–3) | 1 (1–2.5) | 1 (1–2) |
| Left upper lobe | 1 (0–1.5) | 3 (1–4) | 1.5 (0–3) | 1 (0–2) | 1 (0–2) |
| Left lower lobe | 1 (0–2.5) | 4 (3–5)*** | 2 (1–3.25) | 1 (1–2.5) | 1 (0–2) |
| Total severity score | 4 (2–9.5) | 15 (9–19)**** | 8 (4–12.25) | 5 (3–10) | 4 (2–9) |
| < 15 | 20 (95.24%) | 4 (36.36%)*** | 19 (86.36%) | 23 (92%) | 22 (95.65%) |
| ≥ 15 | 1 (4.76%) | 7 (63.64%) | 3 (13.64%) | 2 (8%) | 1 (4.35%) |
| Number of involved lobes | 3 (1.5–5) | 5 (4–5)** | 4.5 (3–5) | 4 (3–5) | 3 (2–5) |
| < 5 | 14 (66.67%) | 2 (18.18%)* | 11 (50%) | 15 (60%) | 14 (60.87%) |
| = 5 | 7 (33.33%) | 9 (81.82%) | 11 (50%) | 10 (40%) | 9 (39.13%) |
| Lung involvement | |||||
| No involvement | 2 (9.52%) | 0 (0%) | 0 (0%) | 0 (0%) | 0 (0%) |
| Unilateral | 4 (19.05%) | 0 (0%) | 0 (0%) | 4 (16%) | 3 (13.04%) |
| Bilateral | 15 (71.43%) | 11 (100%) | 22 (100%) | 21 (84%) | 20 (86.96%) |
| Patterns of opacification | |||||
| Ground glass opacity | 20 (95.24%) | 10 (90.91%) | 21 (95.45%) | 18 (72%) | 20 (86.96%) |
| Crazy-paving pattern | 2 (9.52%) | 5 (45.45%)* | 5 (22.72%) | 3 (12%) | 4 (17.39%) |
| Consolidation | 9 (42.86%) | 9 (81.82%) | 15 (68.19%) | 14 (56%) | 1 (4.35%)** |
| Reticulation | 0 (0%) | 2 (18.18%) | 3 (13.64%) | 9 (36%)** | 15 (65.22%)**** |
| Pleural effusion | 1 (4.76%) | 3 (27.27%) | 1 (4.55%) | 0 (0%) | 0 (0%) |
| Distribution of opacification | |||||
| No lesion | 2 (9.52%) | 0 (0%) | 0 (0%) | 0 (0%) | 0 (0%) |
| Peripheral | 10 (47.62%) | 8 (72.73%) | 13 (59.09%) | 18 (72%) | 17 (73.91%) |
| Random | 6 (28.57%) | 0 (0%) | 2 (9.09%) | 0 (0%)** | 0 (0%)** |
| Diffuse | 3 (14.29%) | 3 (21.27%) | 7 (31.82%) | 7 (28%) | 6 (26.09%) |
| Time between symptom onset and CT scan | 4 (2.5–5) | 5 (2–6) | 11.5 (9–13.25) | 18 (16–20) | 26 (24–28) |
Data are median (IQR), or n (%). χ2 test, Mann-Whitney U test or Fisher’s exact test were used to compare the data of survivors in week 1 with those of non-survivors, and with the data of survivors in week 2, 3, 4, respectively. One-way ANOVA with Bonferroni’s multiple comparison test was used for comparison of total severity scores of the 4 weeks in survivors. ****, p < 0.0001; ***, p < 0.001; **, p < 0.01; *, p < 0.05
Fig. 2.

Representative CT images of a survivor and a non-survivor. a-b, representative transverse CT images of a 38-year-old man with COVID-19 who recovered and was discharged. a Normal CT image on the day when the patient had initial symptoms (day 1). b day 9 after symptom onset, bilateral and peripheral ground-grass opacity. c-d, representative transverse CT images of a 41-year-old woman with COVID-19 who died. c day 6 after symptom onset, multifocal consolidations and ground-glass opacities affecting the bilateral, subpleural lung parenchyma. d day 10 after symptom onset, bilateral extensive ground-glass opacities and consolidation, giving a white lung appearance, with air bronchograms and crazy-paving pattern. The patient died 8 days after this scan
The predominant patterns of opacification were bilateral (26 [81%]), peripherally distributed (18 [56%]), ground-glass opacity (30 [94%]), and consolidation (18 [56%]) within the first week (Fig. 2c). The presence of consolidation pattern tended to be more common in non-survivors compared to survivors (82% vs. 43%, p = 0.061) at this stage (Table 3). In survivors, the presence of consolidation pattern drastically reduced in the fourth week compared to those in the first week (43% vs. 4%, p = 0.003), and the reticulation pattern representing interstitial changes progressively increased in the third and fourth weeks (36%, p = 0.002 and 65%, p < 0.001, respectively) (Table 3).
Predictors of fatality
In univariate logistic regression analyses, older age and all of the above mentioned abnormal laboratory findings were significantly associated with fatality. In a multivariate regression model including older age, lymphocytopenia, elevated LDH, and elevated d-dimer, older age (odds ratio per year increase, 1.062 [95% CI 1.005–1.123], p = 0.033) and elevated LDH (odds ratio per 1 unit increase, 1.010 [1.005–1.015], p < 0.001) were independent risk factors for fatality (Supplementary Table 3).
In the subset of patients with CT images within the first week, using univariate logistic regression analysis, higher total severity score (≥15) (odds ratio, 53 [95% CI 3–369], p = 0.003), and more involved lung lobes (5 involved lobes) (odds ratio, 9 [95% CI 2–53], p = 0.016) in CT images within the first week were significantly associated with fatality. Moreover, in this subset of patients, higher total severity score (odds ratio per 1unit increase, 1.544 [95% CI 1.004–2.374], p = 0.048) was the only independent risk factor in a multivariate analysis incorporating older age, lymphocytopenia, elevated LDH, and elevated d-dimer (Supplementary Table 4).
The treatment for the patients included antibiotics, antivirals, traditional Chinese medicine, corticosteroid, and intravenous immunoglobin (Supplementary Table 5). Non-survivors were more likely to receive corticosteroid compared to survivors (87% vs. 45%, p = 0.003). Respiratory supportive therapy includes nasal cannula oxygen therapy, high-flow nasal cannula oxygen therapy, non-invasive and invasive mechanical ventilation (Supplementary Table 5). As expected, non-survivors were more likely to receive non-invasive (87% vs. 10%, p < 0.001) and invasive mechanical ventilation (20% vs. 0%, p = 0.003). One non-survivor used extracorporeal membrane oxygenation (ECMO), and 2 non-survivors used renal replacement therapy.
Discussion
Our finding that older age is a risk factor for fatality is consistent with other reports in severe acute respiratory syndrome (SARS), Middle East respiratory syndrome (MERS), and COVID-19 [2–4, 21, 22]. The cell-mediated immune function and humoral immune response were previously reported to be decreased in elderly individuals [23]. Type 2 immune response tend to be predominant in elderly individuals leading to vulnerability to virus infection and poor outcome. Elevated LDH is also a risk factor for poor outcome in SARS [21], which may reflect the diffuse alveolar damage observed in these diseases since high LDH levels were often associated with tissue damage [21, 24]. Elevated d-dimer, a recently reported risk factor for fatality in COVID-19 [2], was associated with fatality with univariate analysis but not with multivariate analysis possibly due to limited sample size of our cohort.
With the CT images within the first week after symptom onset, we were able to analyze the association between early CT changes and fatal outcome. Importantly, we found that the severity score and number of involved lung lobes were associated with fatality in COVID-19. Moreover, higher total severity score was an independent risk factor in a multivariate model. The percentage of lung or number of zones opacified in plain chest radiograph by day 7 were reported to be potential prognostic indicators of fatality in SARS [25]. A recent report showed differences in CT scores between 17 survivors and 10 non-survivors (median time of CT scan after symptom onset 9 and 7.5 days, respectively). However, whether the CT scores at this stage predicted fatality was not analysed in a regression model [26]. Compared to that report, the median time of CT scan after symptom onset (4 and 5 days for survivors and non-survivors, respectively) was earlier in our cohort. Using serial CT images of survivors over 4 weeks after symptom onset, we found that the severity score tended to peak at the second week. In survivors, the presence of consolidation pattern significantly reduced in the fourth week, while the reticulation pattern representing interstitial changes progressively increased in the third and fourth week.
Lymphocytopenia and elevated hypersensitive troponin I were also associated with fatal outcome in our cohort. In community acquired pneumonia, lymphocytopenia was reported to be associated with fatality [27]. Lymphocytopenia in patients with COVID-19 can be explained by impaired lymphogenesis or increased apoptosis, increased adhesion to vascular endothelium, or massive migration of lymphocytes to the lungs [28]. Of note, we found that coronary heart disease was more common as a comorbidity in non-survivors compared to survivors. Consistently, elevated hypersensitive troponin I on admission was more common in non-survivors compared to survivors. Older age, cardiovascular disease, and the severity of pneumonia were reported as risk factors of cardiac events for patients with acute pneumonia [29].
Cytokine storm may play a vital role in the pathogenesis of critical COVID-19 patients. Elevated levels of inflammatory biomarkers and infiltrated immune cells in lung lesion were recently reported in critical COVID-19 patients [30]. Previous reports on SARS-COV showed elevated proinflammatory cytokines in serum including IL-8, MCP-1, IP-10, IFN-γ, IL-12, IL-1β and IL-6, leading to the recruitment of alveolar macrophages and extensive lung damage [31]. An increased plasma level of IFN-α2, IFN-γ, TNF-α, IL-10, IL-15 and IL-17 was reported during the acute phase of MERS-CoV infection, presenting a prominent Th1 and Th17 cytokine profile [32]. Similarly, in our cohort, non-survivors had markedly higher levels of high-sensitivity C-reactive protein, procalcitonin, IL-2R, IL-6, IL-8 and TNF-α. Thus, corticosteroids could be an effective treatment for critical COVID-19 patients to alleviate inflammation-related acute lung injury.
Our study had several limitations. Firstly, this is a retrospective cohort study and the accuracy of the data were dependent upon the medical records. Due to the limited sample size, observation bias may exist in the study. Secondly, there could be a selection bias in the multivariate analysis for the risk factors.
Conclusion
This report suggests that older age, elevated LDH on admission, and extensive lung lesions in early CT images are potential predictors of fatal outcome in adults with COVID-19. These predictors may help clinicians identify patients with a poor prognosis at an early stage.
Supplementary information
Additional file 1 Supplementary Appendix. Table S1. Demographics and baseline characteristics of the subset of patients included in the analysis of CTs performed within the first week after symptom onset. Table S2. Laboratory findings of the subset of patients included in the analysis of CTs performed within the first week after symptom onset. Table S3. Risk factors associated with fatality. Table S4. Risk factors associated with fatality of the subset of patients included in the analysis of CTs performed within the first week after symptom onset. Table S5. Treatments and outcomes. Table S6. Treatments and outcomes of the subset of patients included in the analysis of CTs performed within the first week after symptom onset.
Acknowledgements
We are very grateful to all members of the medical, nursing, and support staffs of the quarantine unit at the Sino-French branch of Tongji Hospital for their support. We are very grateful to David J. Erle (University of California San Francisco) for the critical review of the manuscript.
Abbreviations
- COVID-19
Coronavirus disease 2019
- SARS-CoV-2
Severe acute respiratory syndrome coronavirus 2
- SARS
Severe acute respiratory syndrome
- ACE2
angiotensin-converting enzyme 2
- MERS
Middle East respiratory syndrome
- ECMO
Extracorporeal membrane oxygenation
- ICU
Intensive care unit
- IQR
Interquartile ranges
- OR
odds ratio
- SPSS
Statistical product and service solutions
Authors’ contributions
KL and GZ conceptualized the study design. KL, SC, DC, YF, CC collected demographic, clinical, and laboratory data. ZW and NW interpreted the images of CT scans. KL, DC, YF and GZ analysed the data. KL and GZ interpreted the results. GZ wrote the manuscript with all authors providing feedback for revision. The authors read and approved the final report.
Funding
Supported by National Natural Science Foundation of China (grants 81670019, 91742108), National Key Research and Development Program of China (2016YFC1304400).
Availability of data and materials
All data generated or analysed during this study are included in this published article and its supplementary information files.
Ethics approval and consent to participate
This retrospective study was approved by the institutional ethics board of Tongji Hospital of Tongji Medical College of Huazhong University of Science and Technology (reference number.
TJ-IRB20200340). Written informed consent was waived.
Consent for publication
Informed consents for publication of CT images were obtained from the patient who was discharged and the spouse of the patient who deceased.
Competing interests
The authors have no competing interests to declare.
Footnotes
Publisher’s Note
Springer Nature remains neutral with regard to jurisdictional claims in published maps and institutional affiliations.
Supplementary information
Supplementary information accompanies this paper at 10.1186/s12931-020-01411-2.
References
- 1.World Health Organization. Coronavirus disease 2019 (COVID-19): situation report- 72 [https://www.who.int/docs/default-source/coronaviruse/situation-reports/20200401-sitrep-72-covid-19.pdf?sfvrsn=3dd8971b_2]. Accessed 02 Apr 2020.
- 2.Zhou F, Yu T, Du R, Fan G, Liu Y, Liu Z, et al. Clinical course and risk factors for mortality of adult inpatients with COVID-19 in Wuhan, China: a retrospective cohort study. Lancet (London, England) 2020;395:1054–1062. doi: 10.1016/S0140-6736(20)30566-3. [DOI] [PMC free article] [PubMed] [Google Scholar]
- 3.Wu C, Chen X, Cai Y, et al. Risk Factors Associated With Acute Respiratory Distress Syndrome and Death in Patients With Coronavirus Disease 2019 Pneumonia in Wuhan, China. JAMA Intern Med. 2020. [DOI] [PMC free article] [PubMed]
- 4.Wu Z, McGoogan JM: Characteristics of and Important Lessons From the Coronavirus Disease 2019 (COVID-19) Outbreak in China: Summary of a Report of 72 314 Cases From the Chinese Center for Disease Control and Prevention. JAMA. 2020;323:1239–42. [DOI] [PubMed]
- 5.Wilder-Smith A, Chiew CJ, Lee VJ. Can we contain the COVID-19 outbreak with the same measures as for SARS? Lancet Infect Dis. 2020;20:e102–07. [DOI] [PMC free article] [PubMed]
- 6.Jia HP, Look DC, Shi L, Hickey M, Pewe L, Netland J, et al. ACE2 receptor expression and severe acute respiratory syndrome coronavirus infection depend on differentiation of human airway epithelia. J Virol. 2005;79:14614–14621. doi: 10.1128/JVI.79.23.14614-14621.2005. [DOI] [PMC free article] [PubMed] [Google Scholar]
- 7.Zhu N, Zhang D, Wang W, Li X, Yang B, Song J, et al. A novel coronavirus from patients with pneumonia in China, 2019. N Engl J Med. 2020;382:727–733. doi: 10.1056/NEJMoa2001017. [DOI] [PMC free article] [PubMed] [Google Scholar]
- 8.Inciardi RM, Lupi L, Zaccone G, et al. Cardiac Involvement in a Patient With Coronavirus Disease 2019 (COVID-19). JAMA Cardiol. 2020. [DOI] [PMC free article] [PubMed]
- 9.Pei G, Zhang Z, Peng J, Liu L, Zhang C, Yu C, Ma Z, Huang Y, Liu W, Yao Y, et al. Renal Involvement and Early Prognosis in Patients with COVID-19 Pneumonia. J Am Soc Nephrol. 2020;31:1157. [DOI] [PMC free article] [PubMed]
- 10.Rothan HA, Byrareddy SN. The epidemiology and pathogenesis of coronavirus disease (COVID-19) outbreak. J Autoimmun. 2020;109:102433. doi: 10.1016/j.jaut.2020.102433. [DOI] [PMC free article] [PubMed] [Google Scholar]
- 11.Ye Q, Wang B, Mao J. The pathogenesis and treatment of the `Cytokine Storm' in COVID-19. J Infect. 2020;80:607–13. [DOI] [PMC free article] [PubMed]
- 12.Barnes BJ, Adrover JM, Baxter-Stoltzfus A, Borczuk A, Cools-Lartigue J, Crawford JM, et al. Targeting potential drivers of COVID-19: neutrophil extracellular traps. J Exp Med. 2020;217(6):e20200652. [DOI] [PMC free article] [PubMed]
- 13.Huang C, Wang Y, Li X, Ren L, Zhao J, Hu Y, et al. Clinical features of patients infected with 2019 novel coronavirus in Wuhan, China. Lancet (London, England) 2020;395:497–506. doi: 10.1016/S0140-6736(20)30183-5. [DOI] [PMC free article] [PubMed] [Google Scholar]
- 14.Shi H, Han X, Jiang N, Cao Y, Alwalid O, Gu J, et al. Radiological findings from 81 patients with COVID-19 pneumonia in Wuhan, China: a descriptive study. Lancet Infect Dis. 2020;20:425–434. doi: 10.1016/S1473-3099(20)30086-4. [DOI] [PMC free article] [PubMed] [Google Scholar]
- 15.Wang D, Hu B, Hu C, et al. Clinical Characteristics of 138 Hospitalized Patients With 2019 Novel Coronavirus–Infected Pneumonia in Wuhan, China. JAMA. 2020;323(11):1061–9. [DOI] [PMC free article] [PubMed]
- 16.Chen N, Zhou M, Dong X, Qu J, Gong F, Han Y, et al. Epidemiological and clinical characteristics of 99 cases of 2019 novel coronavirus pneumonia in Wuhan, China: a descriptive study. Lancet (London, England) 2020;395:507–513. doi: 10.1016/S0140-6736(20)30211-7. [DOI] [PMC free article] [PubMed] [Google Scholar]
- 17.World Health Organization. Clinical management of severe acute respiratory infection when novel coronavirus (2019-nCoV) infection is suspected: interim guidance [https://www.who.int/docs/default-source/coronaviruse/clinical-management-of-novel-cov.pdf]. Accessed 28 Jan 2020.
- 18.World Health Organization. Coronavirus disease (COVID-19) technical guidance: laboratory testing for 2019-nCoV in humans [https://www.who.int/emergencies/diseases/novel-coronavirus-2019/technical-guidance/laboratory-guidance].
- 19.National Health Commission of the People's Republic of China. Diagnosis and Treatment Protocols of Pneumonia caused by a Novel Coronavirus (Trial Version 7) [http://www.nhc.gov.cn/yzygj/s7653p/202003/46c9294a7dfe4cef80dc7f5912eb1989/files/ce3e6945832a438eaae415350a8ce964.pdf]. Accessed 03 Mar 2020.
- 20.Chang Y-C, Yu C-J, Chang S-C, Galvin JR, Liu H-M, Hsiao C-H, et al. Pulmonary sequelae in convalescent patients after severe acute respiratory syndrome: evaluation with thin-section CT. Radiology. 2005;236:1067–1075. doi: 10.1148/radiol.2363040958. [DOI] [PubMed] [Google Scholar]
- 21.Lee N, Hui D, Wu A, Chan P, Cameron P, Joynt GM, et al. A major outbreak of severe acute respiratory syndrome in Hong Kong. N Engl J Med. 2003;348:1986–1994. doi: 10.1056/NEJMoa030685. [DOI] [PubMed] [Google Scholar]
- 22.Hong K-H, Choi J-P, Hong S-H, Lee J, Kwon J-S, Kim S-M, et al. Predictors of mortality in Middle East respiratory syndrome (MERS) Thorax. 2018;73:286–289. doi: 10.1136/thoraxjnl-2016-209313. [DOI] [PubMed] [Google Scholar]
- 23.Opal SM, Girard TD, Ely EW. The immunopathogenesis of sepsis in elderly patients. Clin Infect Dis. 2005;41(Suppl 7):S504–S512. doi: 10.1086/432007. [DOI] [PubMed] [Google Scholar]
- 24.Xu Z, Shi L, Wang Y, Zhang J, Huang L, Zhang C, Liu S, Zhao P, Liu H, Zhu L, et al: Pathological findings of COVID-19 associated with acute respiratory distress syndrome. The Lancet Respir Med. 2020;8:420–22. [DOI] [PMC free article] [PubMed]
- 25.Antonio GE, Wong KT, Tsui ELH, Chan DPN, Hui DSC, Ng AWH, et al. Chest radiograph scores as potential prognostic indicators in severe acute respiratory syndrome (SARS) AJR Am J Roentgenol. 2005;184:734–741. doi: 10.2214/ajr.184.3.01840734. [DOI] [PubMed] [Google Scholar]
- 26.Yuan M, Yin W, Tao Z, Tan W, Hu Y. Association of radiologic findings with mortality of patients infected with 2019 novel coronavirus in Wuhan, China. PloS one. 2020;15:e0230548. doi: 10.1371/journal.pone.0230548. [DOI] [PMC free article] [PubMed] [Google Scholar]
- 27.Bermejo-Martin JF, Cilloniz C, Mendez R, Almansa R, Gabarrus A, Ceccato A, et al. Lymphopenic community acquired pneumonia (L-CAP), an immunological phenotype associated with higher risk of mortality. EBioMedicine. 2017;24:231–236. doi: 10.1016/j.ebiom.2017.09.023. [DOI] [PMC free article] [PubMed] [Google Scholar]
- 28.Marshall JC, Charbonney E, Gonzalez PD. The Immune System in Critical Illness. Clin Chest Med. 2008;29:605–16. [DOI] [PubMed]
- 29.Corrales-Medina VF, Musher DM, Shachkina S, Chirinos JA. Acute pneumonia and the cardiovascular system. Lancet (London, England) 2013;381:496–505. doi: 10.1016/S0140-6736(12)61266-5. [DOI] [PubMed] [Google Scholar]
- 30.Zhang W, Zhao Y, Zhang F, Wang Q, Li T, Liu Z, et al. The use of anti-inflammatory drugs in the treatment of people with severe coronavirus disease 2019 (COVID-19): the experience of clinical immunologists from China. Clin Immunol (Orlando, Fla) 2020;214:108393. doi: 10.1016/j.clim.2020.108393. [DOI] [PMC free article] [PubMed] [Google Scholar]
- 31.Wong CK, Lam CWK, Wu AKL, Ip WK, Lee NLS, Chan IHS, Lit LCW, Hui DSC, Chan MHM, Chung SSC, Sung JJY. Plasma inflammatory cytokines and chemokines in severe acute respiratory syndrome. Clin Exp Immunol. 2004;136:95–103. [DOI] [PMC free article] [PubMed]
- 32.Mahallawi WH, Khabour OF, Zhang Q, Makhdoum HM, Suliman BA. MERS-CoV infection in humans is associated with a pro-inflammatory Th1 and Th17 cytokine profile. Cytokine. 2018;104:8–13. [DOI] [PMC free article] [PubMed]
Associated Data
This section collects any data citations, data availability statements, or supplementary materials included in this article.
Supplementary Materials
Additional file 1 Supplementary Appendix. Table S1. Demographics and baseline characteristics of the subset of patients included in the analysis of CTs performed within the first week after symptom onset. Table S2. Laboratory findings of the subset of patients included in the analysis of CTs performed within the first week after symptom onset. Table S3. Risk factors associated with fatality. Table S4. Risk factors associated with fatality of the subset of patients included in the analysis of CTs performed within the first week after symptom onset. Table S5. Treatments and outcomes. Table S6. Treatments and outcomes of the subset of patients included in the analysis of CTs performed within the first week after symptom onset.
Data Availability Statement
All data generated or analysed during this study are included in this published article and its supplementary information files.