Figure 2.
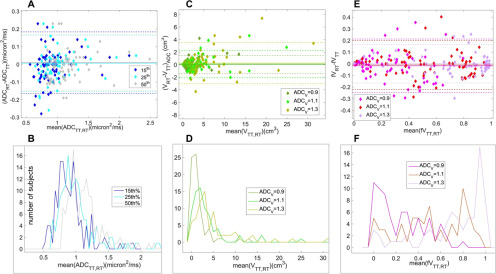
Bland–Altman plots (top) and corresponding test/retest (TT/RT) mean distributions (bottom) are shown (left-to-right) for: (A, B) 15th, 25th, and 50th ADC percentiles; (C, D) low ADC volumes, VADC, thresholded at ADC < 0.9, 1.1, and 1.3 μm2/ms; and (E, F) fractional volumes, fVADC (VADC normalized by total histogram volume V3.0). The 95% limits of agreement for mean metrics are shown by dashed lines. The symbol and line assignments are color-coded in the legends. Mean value histograms (B, D, F) were calculated using bin sizes of 0.04 μm2/ms for percentiles, 1 cm3 for VADC and 0.05 for fVADC. For fVADC mean values (F), we see that for thresholds around 1.1 μm2/ms, the mean values are reasonably evenly distributed across most of the range of the metric (0.0 to 1.0).

