Abstract
Glioblastoma is a common and aggressive form of brain cancer affecting up to 20,000 new patients in the US annually. Despite rigorous therapies, current median survival is only 15–20 months. Patients who complete initial treatment undergo follow-up imaging at routine intervals to assess for tumor recurrence. Imaging is a central part of brain tumor management, but MRI findings in patients with brain tumor can be challenging to interpret and are further confounded by interpretation variability. Disease-specific structured reporting attempts to reduce variability in imaging results by implementing well-defined imaging criteria and standardized language. The Brain Tumor Reporting and Data System (BT-RADS) is one such framework streamlined for clinical workflows and includes quantitative criteria for more objective evaluation of follow-up imaging. To facilitate accurate and objective monitoring of patients during the follow-up period, we developed a cloud platform, the Brain Imaging Collaborative Suite's Longitudinal Imaging Tracker (BrICS-LIT). BrICS-LIT uses semiautomated tumor segmentation algorithms of both T2-weighted FLAIR and contrast-enhanced T1-weighted MRI to assist clinicians in quantitative assessment of brain tumors. The LIT platform can ultimately guide clinical decision-making for patients with glioblastoma by providing quantitative metrics for BT-RADS scoring. Further, this platform has the potential to increase objectivity when measuring efficacy of novel therapies for patients with brain tumor during their follow-up. Therefore, LIT will be used to track patients in a dose-escalated clinical trial, where spectroscopic MRI has been used to guide radiation therapy (Clinicaltrials.gov NCT03137888), and compare patients to a control group that received standard of care.
Keywords: Glioblastoma, structured reporting, segmentation, longitudinal tracking, BT-RADS
Introduction
Glioblastoma (GBM) is the most aggressive primary brain tumor in adults, with a 2-year survival rate of ∼17% (1). The standard of care includes surgical resection followed by high-dose radiation therapy (RT) and chemotherapy (2, 3). Despite these aggressive therapies, median progression-free survival remains 5–7 month post chemoradiation (4). After initial chemoradiation, patient monitoring is guided by standard magnetic resonance imaging performed at routine intervals, typically 2–3 months, to monitor disease progression. However, there is often considerable overlap between treatment effects and tumor progression in follow-up imaging, making it difficult to discern post-treatment radiation effects (pseudoprogression) from true progression (5, 6). Lack of quantitative longitudinal tracking hinders appropriate clinical decision-making and slows the development of new treatments. A structured reporting system that quantifies patient condition post treatment has the potential to guide management decisions, improve patient outcomes, reduce treatment cost, and validate novel treatment strategies.
Disease-specific structured reporting attempts to reduce variability in clinical imaging results by implementing predefined outcome categories, well-defined imaging criteria, and standardized language (7, 8). Such a framework (Reporting and Data System [RADS]) has been implemented in the monitoring of disease in other organ systems including breast imaging (BI-RADS), neck imaging (NI-RADS), and prostate imaging (PI-RADS) (9–11). In particular, the BI-RADS framework has found considerable success in decreasing interobserver variability and predicting malignancy for patients with suspicious lesions in the breast (12, 13). The poor prognosis associated with brain tumors raises the stakes for clear and accurate radiology reporting, as there may be limited opportunities to make changes in clinical management. Further, the desire to standardize assessment of brain tumor response has been discussed extensively for several years. The FDA, along with organizations such as the Brain Tumor Imaging Standardization Committee and National Cancer Institute have reached a consensus in the past that although overall survival is the current gold standard for determining treatment efficacy, a structured framework is necessary for “the accuracy of determining true response to a particular therapy” (14). Multiple response criteria have been developed to assess brain tumors, including the Levin, World Health Organization (WHO), MacDonald, and the Response Assessment in Neuro-Oncology (RANO) criteria. Although RANO is widely used in the research setting, it has not yet achieved wide clinical adoption in radiology reports because of its complex interpretation criteria, need for multiple manual measurements, high interobserver variability, and limited understanding among practicing physicians (15–19).
Clinicians at Emory University developed the Brain Tumor Reporting and Data System (BT-RADS) to address some of the clinical hurdles that previous reporting systems face (20–22). The BT-RADS framework involves multiple metrics to generate a disease score, including volumetric measurements based on contrast-enhanced T1-weighted (CE-T1w) MRIs and T2-weighted fluid-attenuation inversion recovery (FLAIR) MRIs. Although BT-RADS has grown in popularity at Emory and other institutions, physicians need timesaving, accurate metrics to assist with scoring and objectivity. To assist physicians with implementing BT-RADS into standard clinical workflows, we developed a Web application known as the Longitudinal Imaging Tracker (LIT). LIT is built as a module on top of our previously described platform, the Brain Imaging Collaboration Suite (BrICS) (23). Within LIT, clinicians can simultaneously view T2 FLAIR and CE-T1w MRIs for up to 5 time points and scroll through slices of each volume together. Images are automatically coregistered and interpolated to allow for easier visualization and tracking. LIT is also designed to interact with REDCap databases (24) using an API to retrieve deidentified metadata that are relevant to BT-RADS scoring. Further, LIT contains semiautomated segmentation algorithms to calculate lesion volumes in both T2 FLAIR and CE-T1w MRIs. Incorporating such algorithms and visualization features could lead to more objective and less variable volumetric assessments, improve adoption of the BT-RADS structured reporting system for monitoring GBM, and generate sensitive metrics to discern tumoral recurrence in clinical and research settings. We plan on using LIT to assess the efficacy of an interventional pilot study where metabolic abnormalities, detected by spectroscopic MRI, were used to guide a boosted RT dose in patients with GBM (NCT03137888) (25). In this paper, we describe the architecture and features that LIT offers as well as demonstrate its potential in monitoring patients with GBM after initial treatment through example cases from our clinical trial that has recently completed accrual.
Methodology
Software Architecture
To implement BT-RADS criteria in an objective fashion, we developed a new module for our BrICS Web-based imaging platform called the LIT (23). LIT consists of a server-side module that handles image processing and storage, and a frontend user interface. The LIT backend uses C++ and PHP scripting languages that leverage the Insight Toolkit's (ITK) image processing library (26, 27). Many of LIT's algorithms such as segmentation, registration, interpolation, and interconversion of images between DICOM and other formats use ITK's well-established library. LIT also leverages many of the inherent advantages of BrICS, including a lightweight browser client with a JavaScript frontend, which ensures that medical staff do not need to download any additional software to use it, a feature of key importance in clinical practice.
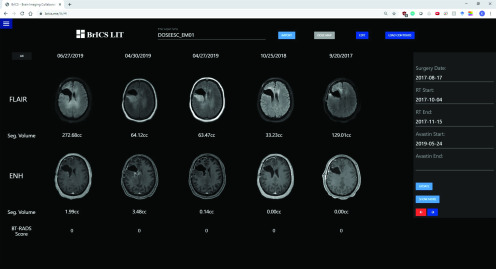
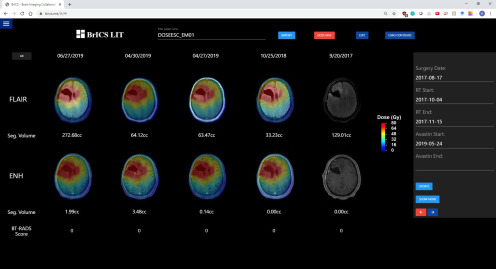
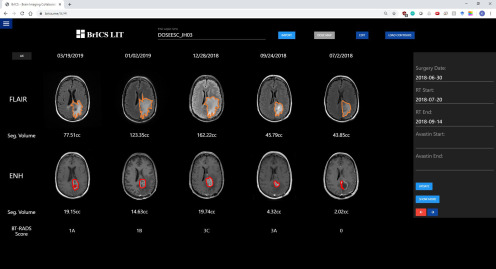
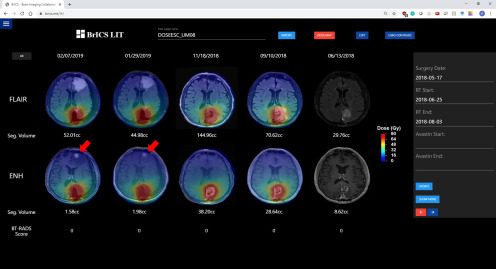
Users can import CE-T1w and FLAIR DICOM images, which are then automatically coregistered using 3D versor rigid registration, and aligned using trilinear interpolation (28). Users can select 5 different time points and observe changes in FLAIR abnormality or CE-T1w enhancement (Figure 1) as well as overlay radiation dose clouds (Figure 2). While the module helps users visualize patient images for longitudinal tracking, segmentation algorithms are necessary to quantitatively report imaging abnormalities. With LIT, users can easily monitor changes in imaging at a 3-dimensional level rather than simply using representative 2-D slices, which would improve objectivity when assessing a patient's overall disease state (29, 30).
Figure 1.
An example patient with glioblastoma (GBM) enrolled in our dose escalation trial at Emory site. Follow-up images are displayed from the earliest date on the far right (pre-RT) to the most recent date on the left. T2 FLAIR (top row) images and contrast-enhanced T1-weighted (CE-T1w) magnetic resonance imaging (MRI) images (bottom row) are co-registered and interpolated to allow for simultaneous scrolling through all slices.
Figure 2.
The example patient from Figure 1 with their radiation planning dose map overlaid. The MRI images on the far right do not have radiation overlaid as that visit preceded the start of radiation treatment.
Semiautomated Segmentation of Lesion
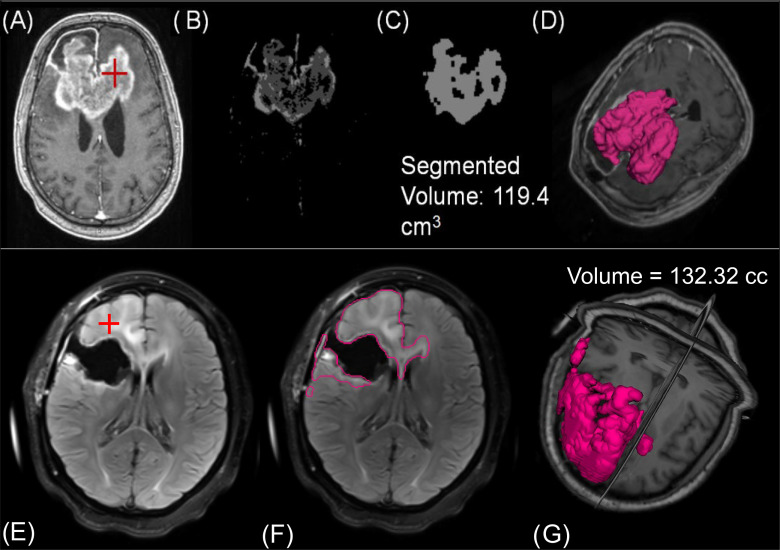
To allow for volumetric tracking of brain tumors, we developed segmentation algorithms for T2 FLAIR and CE-T1w MRIs. Current iterations of these tools are semiautomated as they require initial (manual) seeding by the user, but the eventual goal is to implement automated tools that do not require user intervention. A schematic of the CE-T1w segmentation is shown in Figure 3, A–D. The segmentation tool requires a user to select a representative “seed” in the image within the lesion of interest. Next, Otsu thresholding, an approach where voxel intensities are clustered by exhaustively searching for thresholds that minimize the within-cluster variance, is applied to the image (31). The image, with intensities now separated into 4 clusters, is then registered to an atlas and the skull removed through a skull stripping algorithm (32). A region growing algorithm starting from the user input seed is applied to identify connected components sharing the specified Otsu cluster. The binary image goes through a series of morphological filtering techniques to remove blood vessels and the choroid plexus, and to smooth out spurs along the tumor edge (33, 34).
Figure 3.
For the semiautomated CE-T1w segmentation, (A) a clinician must place a seed in the region of interest. (B) Otsu thresholding and filtering identifies extent of enhancement. (C) Indicates the segmented contour for a representative slice after region growing. (D) The entire volume of segmented lesion. The FLAIR segmentation also requires (E) users to make a seed within the hyperintense region. (F) After smoothing, thresholding, and region growing, the contour has segmented the extent of hyperintensity. (G) A volumetric representation of FLAIR hyperintensity for this patient.
We also developed a semiautomated FLAIR segmentation algorithm which focuses on increasing spatial contrast to homogenize intensities within FLAIR boundaries and on excluding connected components extraneous to the lesion. Much like the CE-T1w algorithm, the FLAIR algorithm requires a user to first select a representative “seed” within the lesion of interest (Figure 3, E–G) after which a curvature flow algorithm is applied to “blur” the image and effectively increase spatial contrast (35). The algorithm then applies a series of ITK filters to dilate and fill holes within clusters of voxels sharing similar intensities. After these preprocessing steps, Otsu thresholding is applied to cluster the image voxels into 4 classes. A region growing algorithm is then applied from the user input “seed” to segment connected components sharing the specified Otsu threshold. Both algorithms take <15 seconds to perform their respective segmentations and do not require any additional imaging for segmentation of lesion.
BrICS-LIT has also been designed to allow for new segmentation algorithms to be easily incorporated, eventually allowing users to choose the best segmentation algorithm in a case-by-case basis.
Visualization and Manual Editing
Although our segmentation algorithms save physicians considerable time in calculating the size of lesions, we realize the value in providing rapid, manual editing tools for segmented volumes that can easily be incorporated in clinical workflows. Therefore, even if the segmentation algorithms are not perfect, they can provide a good, rapidly obtained starting point; the LIT interfaces provides tools for users to then edit these segmentations. A digital audit trail tracks any changes that are made.
We use a JavaScript library known as the Web Graphics Library (WebGL) to render images in our Web application. Overlaid contours, dose clouds, and coregistered MRIs all use this API for visualization. Although all imaging including contours are saved on our server as DICOM data sets, they are converted to Portable Networks Graphics (PNG) textures that WebGL uses for rendering. Clinicians can view contours overlaid on clinical MRIs to observe lesion volume changes over time. Users can also overlay radiation dose maps to determine the spatial similarity between regions of abnormality and regions of treatment.
BT-RADS Scoring and REDCap Integration
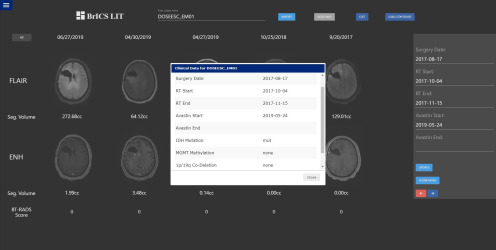
In addition to volumetric measurements of tumor, the BT-RADS's framework also uses additional clinical criteria such as timing of surgery and radiation, use of medications that can affect imaging appearance (such as Avastin and steroids), and worsening clinical condition, which are important in assessing disease recurrence (21). These criteria are typically identified by means of a chart review by the clinician; we seek to streamline the incorporation of this information and calculation of BT-RADS scores. Because LIT itself is not HIPAA-compliant, it uses a pipeline to retrieve deidentified clinical information from a HIPAA-compliant REDCap database. REDCap is a secure database system that is currently used by thousands of institutions and by over 1 million users for secure and convenient storage of patient information in clinical trial settings (24). Using a PHP API, LIT connects to prespecified REDCap databases and retrieves clinical information that are relevant for BT-RADS scoring (Figure 4). With REDCap integration, LIT can interface with several REDCap databases for brain tumors.
Figure 4.
Clinicians and researchers can open a window within Longitudinal Imaging Tracker (LIT) that displays relevant clinical and genomic data automatically retrieved from a REDCap database that can assist in The Brain Tumor Reporting and Data System (BT-RADS) scoring.
Results
Follow-up imaging and clinical data are collected for patients on the GBM dose escalation clinical trial. BrICS-LIT is also being used to assess follow-ups from a pilot study treating patients with melanoma brain metastases with stereotactic radiosurgery and immunotherapy.
In Figure 5, follow-up images from a patient with GBM enrolled in our dose escalation trial at Johns Hopkins have been uploaded into LIT, with contoured lesions displayed and BT-RADS scores assigned by a neuroradiologist. The images on the far right represent the baseline and occurred shortly after the patient's surgery but before starting their radiation treatment. The patient has minimal contrast enhancement (2.02 cc) and some FLAIR hyperintensity (43.85 cc) and was assigned a score of 0 (baseline scan). From the baseline through the next 2 follow-up dates, the volume of abnormal FLAIR and contrast enhancement continues to increase, leading to assigned BT-RADS scores of 3A (imaging worsening, but favor treatment effect) and 3C (imaging worsening, but favor tumor progression). The first follow-up was given a score of 3A because while the imaging had worsened, that follow-up occurred shortly after completion of radiation treatment. Therefore, the clinician suggested the increase in lesion volume is largely owing to treatment effects rather than true progression. Between dates 12/28 and 01/02, the patient's lesion volume in both types of MR images subsequently decreased. This decrease occurred over such a short period that it led clinicians to believe the patient was possibly medicated with either Avastin or steroids, and the patient therefore received a score of 1B. It was confirmed by a treating neuro-oncologist that the patient was treated by high-dose steroid. The decrease in lesion volume between these 2 dates would be particularly difficult for clinicians to discern if they simply picked 1 representative slice and made measurements or manually inspected all the slices for both images. Depending on the slice chosen and the subjective opinion of the interpreting radiologist, 2 clinicians could have generated different BT-RADS scores between those 2 dates. However, BrICS-LIT facilitates more consistent BT-RADS scoring by providing 3-D metrics and longitudinal visualizations that manual inspection might miss.
Figure 5.
An example Johns Hopkins patient with GBM with follow-up imaging co-registered and ready to view in BrICS-LIT. Contours have been generated semiautomatically, with respective volumes of lesion calculated. A neuroradiologist used the segmented volumes, along with REDCap data on the right panel to assign BT-RADS scores for each visit date.
Another example where BrICS-LIT can provide insights is in Figure 6. This patient, from the University of Miami, received radiation treatment starting on 6/25/2018 for 6 weeks. Every follow-up image except for the pre-RT baseline has a radiation dose map overlaid. By overlaying a dose cloud for every follow-up, clinicians can determine whether lesions are spreading outside of radiation treatment zones or whether new lesions are forming in areas that received lower doses of radiation. The patient received a high dose of radiation (75 Gy in 30 fractions prescription dose per the clinical trial) in the left occipital lobe where there was significant contrast enhancement and FLAIR abnormality at the time of initial radiation treatment. However, on 1/29/2019, a new contrast-enhancing lesion appeared in the left frontal lobe along with significant FLAIR abnormality, a sure sign of recurrence as the lesion is outside the tissue which received a significant radiation dose.
Figure 6.
A patient with GBM from our dose escalation trial at the University of Miami who initially received a radiation dose of 75 Gy in the left occipital lobe. However, by 1/29/2019, a distant contrast-enhancing lesion appears in the left frontal lobe, away from the radiation treatment zone (indicated by red arrow).
Discussion
Structured reporting has been widely adopted in clinical workflows for several different cancers including breast and prostate. By standardizing imaging findings and using precise criteria, clinicians can confidently establish patient disease state and manage patient treatment efficiently. Although structured reporting for brain tumors is starting to make an impact in research settings, it has yet to be adopted in clinical settings. BT-RADS is a framework developed by clinicians at Emory University and has started to spread to other institutions such as Duke University and Johns Hopkins University. The BrICS-LIT Web application is designed to provide objective metrics as well as visualization tools to assist clinicians and researchers in classifying patient follow-ups with BT-RADS scores. Thirty patients from a GBM dose escalation clinical trial are currently having their follow-up imaging collected before importing into the BrICS-LIT platform. For those patients, the LIT application will be able to quantify changes in lesion volume in T2 FLAIR and CE-T1w MRIs and help neuroradiologists assign BT-RADS scores with more confidence. By overlaying radiation dose maps, LIT users can more easily identify whether lesions are spreading outside of radiation treatment zones.
Although LIT offers several tools to assist clinicians in assigning BT-RADS scores, future plans involve automating several of the features to minimize clinician and researcher effort. By developing a fully automated segmentation algorithm leveraging convolutional neural networks and other deep learning techniques, lesions can be segmented more accurately with minimal user intervention afterwards. Further, the BT-RADS framework is designed to follow a systematic, quantitative flowchart in assigning disease-state classifications. With automated lesion volumes and relevant clinical data acquired through REDCap, suggestive BT-RADS scores can be assigned programmatically without intervention. Physicians in clinical settings, including neuro-oncologists seeing patients in clinic and radiologists generating clinical radiology reports, can review the suggested BT-RADS scores and modify them when necessary to obtain the most clinically accurate criteria for monitoring patients during their follow-up period. Similarly, suggested scores for other metrics such as RANO can be implemented for comparison with research trials. While progression-free survival and overall survival are classic metrics used to assess the efficacy of novel therapies in research settings, more sensitive metrics like BT-RADS scores can help discern whether there was improvement between 2 cohorts during specific time periods of patient follow-up and whether those differences in scores are significant.
The main limitation of this software approach to structured reporting is that many diagnostic dilemmas of brain tumor follow-up imaging are incompletely addressed. For example, differentiating pseudoprogression from true tumor progression remains challenging, and clinical decision-making is further confounded by variability and lack of clarity in reporting the same findings between institutions and readers. The goal of BT-RADS is to provide a clear framework for reporting results in MRI reports in patients with brain tumor by providing systematic rules for reporting, improving communication and decreasing variability. Software tools such as BRICS-LIT offer an easy-to-access, Web-based tool to consolidate longitudinal image viewing, quantitative assessment of tumor volumes, overlay of radiation doses, and collation of relevant clinical history to improve clinical workflow efficiency. Future efforts will need to be directed toward establishing and improving accuracy and interrater reliability.
Acknowledgments
We would like to thank the staff at the Clinical Trials Office at the Winship Cancer Institute, University of Miami, and The Johns Hopkins University for their work in recruiting patients and entering data into REDCap. Funding for this work came from NIH R01 CA214557 (Shu/Kleinberg/Maudsley/Shim) and U01 EB028145 (Cooper/Maudsley/Han/Li/Shim). Dr Mellon is supported by NIH/NCI K12 CA226330.
Disclosure: None reported.
Conflict of Interest: None reported.
Footnotes
- MRI
- magnetic resonance imaging
- BT-RADS
- Brain Tumor Reporting and Data System
- LIT
- Longitudinal Imaging Tracker;
- BrICS
- Brain Imaging Collaboration Suite
- RT
- radiation therapy
- GBM
- glioblastoma
- CE T1w
- contrast-enhanced T1-weighted
References
- 1. Ostrom QT, Gittleman H, Truitt G, Boscia A, Kruchko C, Barnholtz-Sloan JS. CBTRUS statistical report: primary brain and other central nervous system tumors diagnosed in the United States in 2011-2015. Neuro Oncol. 2018;20:iv1–iv86. [DOI] [PMC free article] [PubMed] [Google Scholar]
- 2. Stupp R, Hegi ME, Mason WP, van den Bent MJ, Taphoorn MJ, Janzer RC, Ludwin SK, Allgeier A, Fisher B, Belanger K, Hau P, Brandes AA, Gijtenbeek J, Marosi C, Vecht CJ, Mokhtari K, Wesseling P, Villa S, Eisenhauer E, Gorlia T, Weller M, Lacombe D, Cairncross JG, Mirimanoff R-O. Effects of radiotherapy with concomitant and adjuvant temozolomide versus radiotherapy alone on survival in glioblastoma in a randomised phase III study: 5-year analysis of the EORTC-NCIC trial. Lancet Oncol. 2009;10:459–466. [DOI] [PubMed] [Google Scholar]
- 3. Stupp R, Taillibert S, Kanner A, Read W, Steinberg DM, Lhermitte B, Toms S, Idbaih A, Ahluwalia MS, Fink K, Di Meco F, Lieberman F, Zhu J-J, Stragliotto G, Tran DD, Brem S, Hottinger AF, Kirson ED, Lavy-Shahaf G, Weinberg U, Kim C-Y, Paek S-H, Nicholas G, Bruna J, Hirte H, Weller M, Palti Y, Hegi ME, Ram Z. Effect of tumor-treating fields plus maintenance temozolomide vs maintenance temozolomide alone on survival in patients with glioblastoma: a randomized clinical trial. JAMA. 2017;318:2306–2316. [DOI] [PMC free article] [PubMed] [Google Scholar]
- 4. Stupp R, Taillibert S, Kanner AA, Kesari S, Steinberg DM, Toms SA, Taylor LP, Lieberman F, Silvani A, Fink KL, Barnett GH, Zhu J-J, Henson JW, Engelhard HH, Chen TC, Tran DD, Sroubek J, Tran ND, Hottinger AF, Landolfi J, Desai R, Caroli M, Kew Y, Honnorat J, Idbaih A, Kirson ED, Weinberg U, Palti Y, Hegi ME, Ram Z. Maintenance therapy with tumor-treating fields plus temozolomide vs temozolomide alone for glioblastoma: a randomized clinical trial. JAMA. 2015;314:2535–2543. [DOI] [PubMed] [Google Scholar]
- 5. Abdulla S, Saada J, Johnson G, Jefferies S, Ajithkumar T. Tumour progression or pseudoprogression? A review of post-treatment radiological appearances of glioblastoma. Clin Radiol. 2015;70:1299–1312. [DOI] [PubMed] [Google Scholar]
- 6. Hygino Da Cruz L, Rodriguez I, Domingues R, Gasparetto E, Sorensen A. Pseudoprogression and pseudoresponse: imaging challenges in the assessment of posttreatment glioma. AJNR Am J Neuroradiol. 2011;32:1978–1985. [DOI] [PMC free article] [PubMed] [Google Scholar]
- 7. Cramer JA, Eisenmenger LB, Pierson NS, Dhatt HS, Heilbrun ME. Structured and templated reporting: an overview. Appl Radiol. 2014;43:18–21. [Google Scholar]
- 8. Ganeshan D, Duong P-AT, Probyn L, Lenchik L, McArthur TA, Retrouvey M, Ghobadi EH, Desouches SL, Pastel D, Francis IR. Structured reporting in radiology. Acad Radiol. 2018;25:66–73. [DOI] [PubMed] [Google Scholar]
- 9. Aiken AH, Farley A, Baugnon KL, Corey A, El-Deiry M, Duszak R, Beitler J, Hudgins PA. Implementation of a novel surveillance template for head and neck cancer: Neck Imaging Reporting And Data System (NI-RADS). J Am Coll Radiol. 2016;13:743–746. [DOI] [PubMed] [Google Scholar]
- 10. D'Orsi CJ, Newell MS. BI-RADS decoded: detailed guidance on potentially confusing issues. Radiol Clin North Am. 2007;45:751–763. [DOI] [PubMed] [Google Scholar]
- 11. Weinreb JC, Barentsz JO, Choyke PL, Cornud F, Haider MA, Macura KJ, Margolis D, Schnall MD, Shtern F, Tempany CM, Thoeny HC, Verma S. PI-RADS prostate imaging–reporting and data system: 2015, Version 2. Eur Urol. 2016;69:16–40. [DOI] [PMC free article] [PubMed] [Google Scholar]
- 12. Hong AS, Rosen EL, Soo MS, Baker JA. BI-RADS for sonography: positive and negative predictive values of sonographic features. AJR Am J Roentgenol. 2005;184:1260–1265. [DOI] [PubMed] [Google Scholar]
- 13. Lazarus E, Mainiero MB, Schepps B, Koelliker SL, Livingston LS. BI-RADS lexicon for US and mammography: interobserver variability and positive predictive value. Radiology. 2006;239:385–391. [DOI] [PubMed] [Google Scholar]
- 14. Ellingson BM, Bendszus M, Boxerman J, Barboriak D, Erickson BJ, Smits M, Nelson SJ, Gerstner E, Alexander B, Goldmacher G, Wick W, Vogelbaum M, Weller M, Galanis E, Kalpathy-Cramer J, Shankar L, Jacobs P, Pope WB, Yang D, Chung C, Knopp MV, Cha S, van den Bent MJ, Chang S, Yung WK, Cloughesy TF, Wen PY, Gilbert MR; Jumpstarting Brain Tumor Drug Development Coalition Imaging Standardization Steering Committee. Consensus recommendations for a standardized brain tumor imaging protocol in clinical trials. Neuro Oncol. 2015;17:1188–1198. [DOI] [PMC free article] [PubMed] [Google Scholar]
- 15. Huang RY, Wen PY. Response assessment in neuro-oncology criteria and clinical endpoints. Magn Reson Imaging Clin N Am. 2016;24:705–718. [DOI] [PubMed] [Google Scholar]
- 16. James K, Eisenhauer E, Christian M, Terenziani M, Vena D, Muldal A, Therasse P. Measuring response in solid tumors: unidimensional versus bidimensional measurement. J Natl Cancer Inst. 1999;91:523–528. [DOI] [PubMed] [Google Scholar]
- 17. Macdonald DR, Cascino TL, Schold SC Jr., Cairncross JG. Response criteria for phase II studies of supratentorial malignant glioma. J Clin Oncol. 1990;8:1277–1280. [DOI] [PubMed] [Google Scholar]
- 18. Quant EC, Wen PY. Response assessment in neuro-oncology. Curr Oncol Rep. 2011;13:50–56. [DOI] [PubMed] [Google Scholar]
- 19. Wen PY, Macdonald DR, Reardon DA, Cloughesy TF, Sorensen AG, Galanis E, DeGroot J, Wick W, Gilbert MR, Lassman AB, Tsien C, Mikkelsen T, Wong ET, Chamberlain MC, Stupp R, Lamborn KR, Vogelbaum MA, van den Bent MJ, Chang SM. Updated response assessment criteria for high-grade gliomas: response assessment in neuro-oncology working group. J Clin Oncol. 2010;28:1963–1972. [DOI] [PubMed] [Google Scholar]
- 20. Gore A, Hoch MJ, Shu HG, Olson JJ, Voloschin AD, Weinberg BD. Institutional implementation of a structured reporting system: our experience with the brain tumor reporting and data system. Acad Radiol. 2019;26:974–980. [DOI] [PubMed] [Google Scholar]
- 21. Weinberg BD, Gore A, Shu H-KG, Olson JJ, Duszak R, Voloschin AD, Hoch MJ. Management-based structured reporting of posttreatment glioma response with the brain tumor reporting and data system. J Am Coll Radiol. 2018;15:767–771. [DOI] [PubMed] [Google Scholar]
- 22. Zhang JY, Weinberg BD, Hu R, Saindane A, Mullins M, Allen J, Hoch MJ. Quantitative improvement in Brain Tumor MRI Through Structured Reporting (BT-RADS). Acad Radiol. 2019; pii: S1076-6332(19)30381-2. [Epub ahead of print]. [DOI] [PubMed] [Google Scholar]
- 23. Gurbani S, Weinberg B, Cooper L, Mellon E, Schreibmann E, Sheriff S, Maudsley A, Goryawala M, Shu H-K, Shim H. The Brain Imaging Collaboration Suite (BrICS): a cloud platform for integrating whole-brain spectroscopic MRI into the radiation therapy planning workflow. Tomography. 2019;5:184–191. [DOI] [PMC free article] [PubMed] [Google Scholar]
- 24. Harris PA, Taylor R, Thielke R, Payne J, Gonzalez N, Conde JG. Research Electronic Data Capture (REDCap)—a metadata-driven methodology and workflow process for providing translational research informatics support. J Biomed Inform. 2009;42:377–381. [DOI] [PMC free article] [PubMed] [Google Scholar]
- 25. Gurbani SS, Schreibmann E, Sheriff S, Cooper LAD, Shu HKG, Holder CA, Maudsley AA, Shim H. A software platform for collaborative radiation therapy planning using spectroscopic MRI. Int J Radiat Oncol Biol Phys. 2017;99:E667. [Google Scholar]
- 26. Yoo TS, Ackerman MJ, Lorensen WE, Schroeder W, Chalana V, Aylward S, Metaxas DN, Whitaker R. Engineering and algorithm design for an image processing API: a technical report on ITK-the insight toolkit. J Stud Health Technol Inform. 2002;85:586–592. [PubMed] [Google Scholar]
- 27. McCormick MM, Liu X, Ibanez L, Jomier J, Marion C. ITK: enabling reproducible research and open science. Front Neuroinform. 2014;8:13. [DOI] [PMC free article] [PubMed] [Google Scholar]
- 28. Johnson H, Harris G, Williams K. BRAINSFit: mutual information rigid registrations of whole-brain 3D images, using the insight toolkit. Insight J. 2007;57:1–10. [Google Scholar]
- 29. Dempsey MF, Condon BR, Hadley DM. Measurement of tumor “size” in recurrent malignant glioma: 1D, 2D, or 3D? Am J Neuroradiol. 2005;26:770–776. [PMC free article] [PubMed] [Google Scholar]
- 30. Warr D, McKinney S, Tannock I. Influence of measurement error on assessment of response to anticancer chemotherapy: proposal for new criteria of tumor response. J Clin Oncol. 1984;2:1040–1046. [DOI] [PubMed] [Google Scholar]
- 31. Otsu N. A threshold selection method from gray-level histograms. IEEE Trans Syst Man Cybern. 1979;9:62–66. [Google Scholar]
- 32. Bauer S, Fejes T, Reyes M. A skull-stripping filter for ITK. 2012. Available from: https://www.insight-journal.org/browse/publication/859.
- 33. Annangi P, Krishnan KB, Banerjee J, Gupta M, Patil U, eds. Automatic Detection and Estimation of Biparietal Diameter from Fetal Ultrasonography. Medical Imaging 2011: Ultrasonic Imaging, Tomography, and Therapy. Lake Buena Vista, FL: International Society for Optics and Photonics; 2011. [Google Scholar]
- 34. Vincent L. Morphological area openings and closings for grey-scale images. In: O YL, Toet A, Foster D, Heijmans HJAM, Meer P, eds. Shape in Picture. Berlin, Heidelberg: Springer; 1994:197–208. [Google Scholar]
- 35. Sethian JA. Level Set Methods and Fast Marching Methods: Evolving Interfaces in Computational Geometry, Fluid Mechanics, Computer Vision, and Materials Science. Cambridge, United Kingdom: Cambridge University Press; 1999. [Google Scholar]


