

ABSTRACT
Background: Reproduction has been related to long-term maternal weight gain, and changes in fat mass, with gestational weight gain, have been identified as an important contributor. However, the influence of weight changes during the whole reproductive cycle and the modifying effect of breastfeeding are unknown.
Objective: The objective was to examine how prepregnancy weight, gestational weight gain, postpartum weight changes, and breastfeeding influence maternal weight and body mass index–adjusted waist circumference (WCBMI) 7 y after delivery.
Design: This was a prospective cohort study of 23,701 women participating in the Danish National Birth Cohort with singleton births and no births during follow-up. Path analysis was used to assess the total, direct, and indirect effects; the latter was mediated through weight changes on the pathways.
Results: Postpartum weight retention at 6 mo and weight gain from 6 to 18 mo postpartum were highly positively associated with both outcomes. A 1-kg increase in weight retention at 6 mo postpartum corresponded to an average increase of 0.5 kg at 7 y. Gestational weight gain was not associated with WCBMI but was positively associated with weight at 7 y; 87% of this effect was mediated through later weight changes. For both outcomes, a small inverse association was observed for breastfeeding duration. This was strongest for WCBMI, for which 97% of the effect was direct, ie, not mediated through postpartum weight.
Conclusions: These findings show that postpartum weight retention at 6 mo and weight gain from 6 to 18 mo postpartum contribute equally to adverse maternal anthropometric measures 7 y after delivery. Breastfeeding duration may have a beneficial effect.
INTRODUCTION
Pregnancy results in substantial changes in a woman’s weight; within a 5–10-y period, parous women experience greater weight gain than do nulliparous women (1). Studies have shown that excessive gestational weight gain increases the risk of postpartum weight retention (2,3) and long-term maternal weight gain (3,4), and it has been suggested to be an important contributor to the obesity epidemic among childbearing women (5).
Moreover, pregnancy is also related to increases in abdominal fat mass (6). Fat is gained on both the central and lower body during pregnancy; however, in the postpartum period, fat is primarily mobilized from the lower body (7,8). Parous women have a higher waist circumference and a lower thigh circumference than nulliparous women (9). This adverse change in fat distribution, which is also characteristic of increasing age (10), may affect long-term maternal health because abdominal fat mass predicts mortality better than simply weight or BMI (11–13). Finally, breastfeeding also contributes to maternal changes in weight and fat distribution. Some studies, but not all (14,15), have found breastfeeding to be inversely associated with long-term weight (16,17) and metabolic active visceral fat >7 y after delivery (16,18,19).
To understand how reproduction may lead to long-term obesity, a framework (20) and a statistical approach (21) are needed that take into account the independent and joint effects of breastfeeding and weight changes in each period of the reproductive cycle: pregnancy, the postpartum period with exclusive breastfeeding, and the postpartum period with partial breastfeeding (22). All periods and breastfeeding duration may contribute to substantial changes in weight and fat mass. Thus, this approach may identify important time windows for the prevention of long-term maternal obesity. Previous studies of long-term effects are limited and only rarely include serial measurements of weight changes (1). Thus, the aim of the current study was to investigate how maternal weight changes in each period of the reproductive cycle and duration of breastfeeding were related to maternal weight and BMI-adjusted waist circumference (WCBMI) 7 y after delivery and to distinguish between direct and indirect mediating effects.
SUBJECTS AND METHODS
Subjects
The current study was based on the Danish National Birth Cohort (DNBC), which recruited 91,769 pregnant women between 1996 and 2002. The cohort is described in detail elsewhere (23,24). Briefly, women were invited to participate in the study at their first antenatal visit to the general practitioners. Participating women agreed to complete 4 computer-assisted telephone interviews that were carried out at ∼16 wk (median: 16; 5th–95th percentile: 11, 25) and 30 wk (median: 31; 5th–95th percentile: 27, 37) of gestation and at 6 (median: 6; 5th–95th percentile: 6, 8) and 18 (median: 19; 5th–95th percentile: 18, 21) mo postpartum. In addition, participants filled out a food-frequency questionnaire at ∼25 wk of gestation. A 7-y follow-up study of the children and parents was concluded in 2010 via a mailed or World Wide Web–based questionnaire. Of the 81,077 women with a first interview and a liveborn singleton, 61.4% responded to the 7-y follow-up questionnaire (Figure 1). Complete information on prepregnancy weight, height, and weight 7 y after this delivery was available for 46,416 independent women. If these women had more than one birth within the DNBC, only their last birth was included. Finally, we excluded women who gave birth between the index birth and the time of follow-up, which yielded a study population of 23,701 women. All women gave written informed consent. The study was approved by the Scientific Ethic Committee in Denmark and the Danish Data Protection Agency.
FIGURE 1.
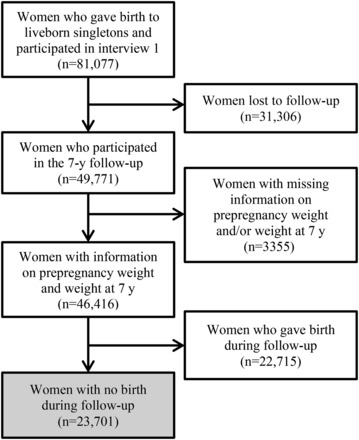
Flowchart of the study population: women participating in the Danish National Birth Cohort.
Path variables
Prepregnancy weight was obtained during the first interview, gestational weight gain and weight at 6 mo postpartum during the third interview, and weight at 18 mo postpartum during the fourth interview. From the follow-up questionnaire 7 y after the index delivery, we obtained information on weight and waist circumference. Each woman was mailed a tape measure and instructed to measure her waist circumference at the most narrow point. In the current study, WCBMI was expressed as the deviation from the predicted value when waist circumference was regressed on BMI [weight (kg)/height (m)2] 7 y after delivery. This measure reflects the variation in abdominal fat mass that cannot be attributed to variation in general obesity as measured by BMI, and it has proven to be strongly directly associated with all-cause mortality (11–13). A positive value is interpreted as more abdominal fat mass than predicted for a given BMI (ie, even a small waist circumference could be assigned a positive value if it was larger than expected for a given BMI). The predicted waist circumference was 83.9 cm for an average 7-y BMI of 24.2 and increased 2.15 cm per BMI unit increase. The duration of total breastfeeding in weeks, including both exclusive and partial breastfeeding, was based on the date of termination obtained from the fourth interview. If this information was missing, the date of termination of daily breastfeeding from the third interview was used. Information on all variables was self-reported.
Other covariates
From the first interview, we also obtained information on the woman’s height, age at conception, leisure-time physical activity during pregnancy, and socio-occupational status. The leisure-time physical activity during pregnancy was categorized as no exercise, 1–180 min/wk, and >180 min/wk and socio-occupational status as high, middle, and low; both variables are described in detail elsewhere (25). Information on smoking habits was obtained from the first and third interviews, and smoking habits during pregnancy were categorized as nonsmoking, smoking, or smoking cessation. After pregnancy, smoking habits were categorized as still nonsmoking, still smoking, smoking cessation/maintained smoking cessation, or initiated smoking. Within the DNBC, dietary pattern was previously defined by factor analysis and categorized as “Western diet,” characterized as a high intake of high-fat dairy products and red and processed meat; “Health Conscious,” characterized as a high intake of fruit, vegetables, poultry, and fish; and “Intermediate,” characterized as an intake between the 2 groups (26,27). Information about the days of gestation, birth weight for the index child, and parity until the end of follow-up was obtained from the Danish Medical Birth Registry.
Statistical analysis
We used path analysis, a subset of structural equation modeling (28), to investigate the association between weight changes in the reproductive cycle, breastfeeding duration, and weight and WCBMI 7 y after delivery. Path analysis is an extension of regression analysis that simultaneously estimates the linear associations between all path variables (21) and makes it possible to assess the total, direct, and indirect effects of each path variable. The model requires all dependent variables to be on a continuous scale. The wordeffect is standard terminology for results obtained from path analysis. However, note that it refers to a statistical but not causal effect (28). The direct effect is the part of the effect not mediated through other included variables measured at a later point in time, whereas the indirect effect is the mediating effect operating through other included variables on the pathway. The total effect is the sum of the direct and indirect effects (21) and for each path variable; the percentages of the total effect that was indirect and direct is presented.
In the current path model, each weight measurement depended on all previous measurements of weight. In relevant regressions in our path analysis, we adjusted for the following covariates: socio-occupational status, maternal age, parity, height, gestational age, child birth weight, leisure-time physical activity during pregnancy, dietary pattern during pregnancy, smoking during and after pregnancy, and time of interviews 3 and 4.
To be able to compare strengths of the associations, all path variables were standardized toz scores, with a mean of 0 and an SD of 1 by using internal reference values. Az score regression coefficient is interpreted as an increase of 1 SD in the independent variable corresponding to the regression coefficient multiplied by the SD of the dependent variable. However, when strengths of the associations between path variables were compared, both the time distance to the outcome and the nature of the variables (eg, gestational weight gain is more than fat gain) should be considered.
Missing data are a common problem in longitudinal studies (29). Path analysis handles missing data in normally distributed path variables directly as each regression is based on different subset of available data. However, because of missing information in categorized covariates, a multiple imputation strategy (29) was applied and used for both covariates and path variables. We created 60 copies of the data set, each of which have their missing values imputed, with an appropriate level of randomness, by chained equations (29,30). Variables with complete data (prepregnancy weight, weight at 7 y after delivery, height, and maternal age) were included as additional explanatory variables in the imputation step. If the woman was still breastfeeding at the time of interview, a lower limit was set to the time of interview, and a universal upper limit was set to 3 y for imputation of breastfeeding duration. We conducted an analysis for each imputation, and now a complete data set, and the overall regression coefficients and associated uncertainty estimates for the total, direct, and indirect effects for these data sets were obtained following Rubin’s rules, which take into account uncertainty arising from the imputations (31).
For comparison, we also performed complete case analyses (n = 11,282 for weight and 10,244 for WCBMI). Results did not differ substantially from the results based on the imputed data set, but the CIs were wider (see Supplemental Tables 1 and 2 under “Supplemental data” in the online issue).
We performed 2 subanalyses within the imputed data set. First, we stratified by prepregnancy BMI groups according to the WHO-defined categories (32) and tested differences by using Wald tests. Next, we restricted the analysis to women who had their first interview at pregnancy weeks 12–20 (n = 15,867) so that we could divide gestational weight gain into early (from conception to interview 1) and late (from interview 1 to delivery). Weight gain in each period was divided by weeks of gestation to express weekly gestational weight gain.
In a sensitivity analysis, we also included women who gave birth in the 7-y follow-up period, except for 3803 women who gave birth <18 mo before the 7-y follow-up (n = 42,613). We conducted a complete case analysis on this sample (n = 18,694 for weight andn = 16,874 for WCBMI) adjusting for the previously mentioned covariates and number of births during follow-up. The results were comparable with those presented and are thus not described in further detail (see Supplemental Tables 3 and 4 under “Supplemental data” in the online issue). All statistical analyses were performed by using Stata/SE 12 (StataCorp LP). The command -sem- for structural equation modeling was used for path analyses.
RESULTS
The median follow-up time was 7.1 y (5%, 95% percentile 7.0, 7.4) and women who participated in the 7-y follow-up had a higher socio-occupational status, had a lower weight at prepregnancy and 6 and 18 mo postpartum, were more physically active, were less often smokers, breastfed for a longer time period, and reported a more healthy dietary pattern compared with women who were lost to follow-up.
Before pregnancy, 4% of the study population was underweight (BMI <18.5), 68% normal weight (BMI 18.5–24.9), 20% overweight (BMI 25.0–29.9), and 8% obese (BMI ≥30) (Table 1). More than half of the overweight and obese women gained more during pregnancy than recommended by the Institute of Medicine/National Research Council (33); the corresponding numbers were 35% for normal-weight women and 18% for underweight women. Mean weight retention 6 mo postpartum was 1.3 kg and decreased with increasing prepregnancy BMI group; obese women lost weight. From 6 to 18 mo postpartum, a weight change was observed in all BMI groups, which ranged from −0.9 kg for the underweight women to −2.2 kg for the obese women. In contrast, from 18 mo to 7 y postpartum, an average weight gain of 2.1 kg was observed, with little variation among BMI groups. The mean weight gain for the whole period from prepregnancy until 7 y after delivery was 2.1 kg. However, whereas 20% of women who were normal weight before pregnancy gained >5 kg during this period, this was the case for 27% to 28% of women in the other BMI groups. On average, women breastfed for 33.2 wk, exclusively or partially, with the longest duration in women who were normal weight before pregnancy. Breastfeeding duration decreased with increasing prepregnancy BMI.
TABLE 1.
Anthropometric and breastfeeding characteristics of women with liveborn singletons and no births in the 7-y follow-up period, by prepregnancy BMI (in kg/m2)
| BMI | ||||||
| Variable | All(n = 23,701) | <18.5(n = 1035) | 18.5–24.9(n = 16,247) | 25–29.9(n = 4641) | ≥30(n = 1778) | Missing |
| Prepregnancy weight (kg) | 66.9 ± 12.41 | 50.6 ± 3.8 | 62.1 ± 6.5 | 76.6 ± 6.7 | 94.9 ± 12.5 | 0 |
| Height (cm) | 168.6 ± 6.0 | 168.7 ± 5.7 | 168.8 ± 6.0 | 168.4 ± 6.0 | 167.8 ± 6.0 | 0 |
| Gestational weight gain (kg) | 14.6 ± 5.8 | 14.7 ± 5.1 | 15.2 ± 5.1 | 14.1 ± 6.4 | 10.1 ± 7.8 | 4494 |
| Weekly early2 gestational weight gain (g)3 | 170 ± 170 | 227 ± 149 | 190 ± 150 | 138 ± 192 | 36 ± 211 | 691 |
| Weekly late4 gestational weight gain (g)3 | 492 ± 213 | 463 ± 189 | 504 ± 189 | 495 ± 244 | 391 ± 297 | 3425 |
| Weight, 6 mo (kg) | 68.1 ± 12.4 | 52.8 ± 5.0 | 63.7 ± 7.5 | 77.6 ± 8.5 | 93.3 ± 12.8 | 4902 |
| Weight retention, 6 mo (kg) | 1.3 ± 4.5 | 2.2 ± 3.5 | 1.7 ± 3.8 | 1.0 ± 5.5 | −1.6 ± 6.8 | 4902 |
| Weight, 18 mo (kg) | 66.8 ± 12.0 | 52.0 ± 4.7 | 62.8 ± 7.2 | 75.7 ± 8.4 | 91.2 ± 13.6 | 4889 |
| Weight change, 6–18 mo (kg) | −1.4 ± 4.2 | −0.9 ± 3.0 | −1.2 ± 3.5 | −1.8 ± 5.1 | −2.2 ± 7.1 | 8218 |
| Weight, 7 y (kg) | 68.9 ± 13.0 | 54.6 ± 5.7 | 64.5 ± 7.9 | 78.2 ± 10.3 | 93.8 ± 15.3 | 0 |
| Weight change, 18 mo to 7 y (kg) | 2.1 ± 5.7 | 2.6 ± 3.7 | 1.9 ± 4.4 | 2.3 ± 7.1 | 2.7 ± 11.0 | 4889 |
| Weight change, prepregnancy to 7 y (kg) | 2.1 ± 6.3 | 4.0 ± 4.2 | 2.4 ± 4.8 | 1.6 ± 7.9 | −1.1 ± 11.4 | 0 |
| Weight change, prepregnancy to 7 y [n (%)] | 0 | |||||
| <0 kg | 6567 (28) | 71 (7) | 3839 (24) | 1789 (39) | 868 (49) | — |
| 0–1.99 kg | 4533 (19) | 229 (22) | 3536 (22) | 617 (13) | 151 (8) | — |
| 2–5 kg | 7224 (30) | 456 (44) | 5547 (34) | 962 (21) | 259 (15) | — |
| >5 kg | 5377 (23) | 279 (27) | 3325 (20) | 1273 (27) | 500 (28) | — |
| Waist circumference, 7 y (cm) | 83.6 ± 10.9 | 73.9 ± 6.0 | 80.3 ± 7.5 | 91.1 ± 9.8 | 102.7 ± 12.9 | 2747 |
| Total breastfeeding (wk) | 33.2 ± 17.9 | 32.8 ± 18.7 | 34.6 ± 17.5 | 30.7 ± 18.1 | 26.8 ± 18.8 | 6074 |
Mean ± SD (all such values).
Gestational weight gain from prepregnancy to the time of interview 1 (12–20 wk).
A subpopulation of 15,867 women answering the first interview at pregnancy weeks 12–20.
Gestational weight gain from interview 1 (12–20 wk) to delivery.
The women were 31.8 y of age on average at conception, and 82% were multiparous (Table 2). Further description of the distribution of covariates is presented inTable 2. The path analysis was based on the path diagram shown inFigure 2, which shows the underlying structure graphically and the direct regression coefficients of one variable on another.
TABLE 2.
Baseline and pregnancy characteristics of women with liveborn singletons and no births in the 7-y follow-up period, by prepregnancy BMI (in kg/m2)
| BMI | ||||||
| Variable | All(n = 23,701) | <18.5(n = 1035) | 18.5–24.9(n = 16,247) | 25–29.9(n = 4641) | ≥30(n = 1778) | Missing |
| Age at conception (y) | 31.8 ± 4.11 | 31.2 ± 4.3 | 32.0 ± 4.1 | 31.5 ± 4.1 | 31.1 ± 4.0 | 0 |
| Parity [n (%)] | 0 | |||||
| Primiparous | 4149 (18) | 209 (20) | 2819 (17) | 770 (17) | 351 (20) | — |
| Multiparous | 19,552 (82) | 826 (80) | 13,428 (83) | 3871 (83) | 1427 (80) | — |
| Gestational age (d) | 279.7 ± 11.6 | 277.7 ± 13.0 | 279.7 ± 11.5 | 280.2 ± 11.3 | 279.6 ± 12.8 | 0 |
| Birth weight of child (g) | 3640 ± 571 | 3386 ± 564 | 3621 ± 546 | 3731 ± 558 | 3760 ± 623 | 85 |
| Socio-occupational status [n (%)] | 76 | |||||
| High | 12,383 (53) | 493 (48) | 9114 (56) | 2136 (46) | 640 (36) | — |
| Middle | 9057 (38) | 420 (41) | 5784 (36) | 1987 (43) | 866 (49) | — |
| Low | 2185 (9) | 118 (11) | 1305 (8) | 497 (11) | 265 (15) | — |
| Smoking during pregnancy [n (%)] | 4327 | |||||
| Nonsmoking | 14,558 (75) | 556 (66) | 9985 (75) | 2856 (75) | 1161 (77) | — |
| Smoking cessation | 1991 (10) | 94 (11) | 1387 (11) | 388 (10) | 122 (8) | — |
| Smoking | 2825 (15) | 187 (22) | 1867 (14) | 551 (15) | 220 (15) | — |
| Smoking after pregnancy [n (%)] | 4327 | |||||
| Continued nonsmoking | 14,419 (74) | 550 (66) | 9894 (75) | 2828 (75) | 1147 (76) | — |
| Smoking cessation or maintained cessation | 1383 (7) | 63 (7) | 961 (7) | 276 (7) | 83 (6) | — |
| Initiated smoking | 819 (4) | 43 (5) | 564 (4) | 151 (4) | 61 (4) | — |
| Continued smoking | 2753 (14) | 181 (22) | 1820 (14) | 540 (14) | 212 (14) | — |
| Leisure-time physical activity during pregnancy [n (%)] | 18 | |||||
| No exercise | 15,875 (67) | 723 (70) | 10,752 (66) | 3156 (68) | 1244 (70) | — |
| 1–180 min/wk | 6303 (27) | 244 (24) | 4390 (27) | 1221 (26) | 448 (25) | — |
| >180 min/wk | 1505 (6) | 67 (6) | 1091 (7) | 262 (6) | 85 (5) | — |
| Dietary pattern during pregnancy [n (%)] | 5214 | |||||
| Western | 3424 (19) | 200 (25) | 2245 (18) | 673 (19) | 306 (22) | — |
| Intermediate | 12,423 (67) | 497 (62) | 8481 (67) | 2508 (69) | 937 (68) | — |
| Health conscious | 2640 (14) | 101 (13) | 1946 (15) | 457 (13) | 136 (10) | — |
Mean ± SD (all such values).
FIGURE 2.
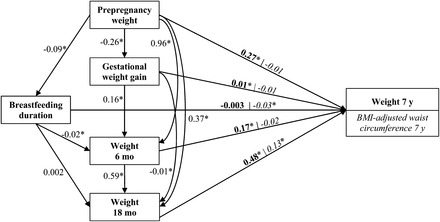
Path diagram presenting linear regression coefficients for all direct regressions between prepregnancy weight, gestational weight gain, weight at 6 and 18 mo postpartum, breastfeeding duration, and weight 7 y after delivery or BMI-adjusted waist circumference 7 y after delivery. For weight as outcome, the direct effect is illustrated in bold; for BMI-adjusted waist circumference, the direct effect is illustrated in italic. An arrow presents a direct effect. All variables are included asz scores. We adjusted for height, age, socio-occupational status, parity, gestational age, child birth weight, physical activity, dietary pattern, smoking during pregnancy, smoking after pregnancy, and time of interviews 3 and 4. These covariates have been omitted to simplify the path diagram for illustration. *Statistically significant regression coefficient,P < 0.05.
Weight 7 y after delivery
Results are shown inTable 3. As expected, the total effect of prepregnancy weight was strong and significant. Each 1-kg increase in prepregnancy weight corresponded to a 0.91-kg higher weight at 7 y. [Estimates fromTables 1 and3 were used for calculation (13 kg × 0.87)/12.4 kg = 0.91 kg).] The fact that the estimate was <1 kg suggests that, on average, heavier women became thinner and thinner women became heavier.
TABLE 3.
Path analysis for the association between pregnancy-related weight changes, breastfeeding, and maternal weight 7 y after delivery1
| Total effect | Indirect effect | Direct effect | ||||||
| β | 95% CI | β | 95% CI | % of total | β | 95% CI | % of total | |
| Prepregnancy weight | 0.87 | 0.84, 0.89 | 0.60 | 0.59, 0.61 | 69 | 0.27 | 0.24, 0.30 | 31 |
| Total gestational weight gain | 0.08 | 0.07, 0.09 | 0.07 | 0.06, 0.07 | 83 | 0.01 | 0.01, 0.02 | 17 |
| Weight, 6 mo | 0.46 | 0.43, 0.48 | 0.29 | 0.28, 0.30 | 63 | 0.17 | 0.14, 0.20 | 37 |
| Weight, 18 mo | 0.48 | 0.46, 0.51 | — | — | — | 0.48 | 0.46, 0.51 | 100 |
| Breastfeeding duration | −0.01 | −0.02, −0.004 | −0.01 | −0.01, −0.01 | 73 | −0.003 | −0.01, 0.003 | 27 |
All variables arez scores.n = 23,701. Values were adjusted for height, age, socio-occupational status, parity, gestational age, child birth weight, physical activity, dietary pattern, smoking during pregnancy, smoking after pregnancy, and time of interviews 3 and 4.
A significant total effect was observed for gestational weight gain, and nearly all (83%) of the effect was mediated through increased weight retention at 6 mo postpartum. Each 1-kg increase in gestational weight gain corresponded to a 0.18-kg higher weight at 7 y. A subanalysis showed that the total effect of weekly early gestational weight gain was more strongly associated with weight at 7 y than was weekly late gestational weight gain (see Supplemental Table 5 under “Supplemental data” in the online issue). For both periods, >70% of these effects were indirect.
Weight at 6 mo postpartum reflected weight retention 6 mo after birth, with adjustment for previous weights (prepregnancy weight and gestational weight gain). The total effect was significant; a 1-kg increase corresponded to a 0.48-kg increase in weight at 7 y. Two-thirds of this effect was mediated through a higher weight at 18 mo postpartum (Table 3). Weight at 18 mo postpartum gave information about the contribution of weight change from 6 to 18 mo after birth with the adjustment for previous weights, and the total effect was significant; a 1-kg increase corresponded to a 0.51-kg increase in weight at 7 y.
We observed a significant but small inverse total effect of breastfeeding duration on weight at 7 y; each 10-wk increase in breastfeeding duration corresponded to a 0.1-kg lower weight at 7 y. Most (73%) of the effect was mediated through an inverse association with weight at 6 mo postpartum.
When stratified by prepregnancy BMI group, tests for interaction showed that the total effect of gestational weight gain on weight at 7 y was higher for overweight (P = 0.022) and obese (P = 0.041) women than for normal-weight women (Figure 3). This was also observed for weight retention at 6 mo postpartum (P < 0.001 for overweight andP < 0.001 for obese women compared with normal-weight women). For weight change from 6 to 18 mo postpartum, the effect was higher for overweight (P < 0.001) women than for normal-weight women. No difference was seen among BMI groups for the effects of breastfeeding duration on weight at 7 y (P = 0.844 for underweight,P = 0.474 for overweight, andP = 0.982 for obese women compared with normal-weight women).
FIGURE 3.
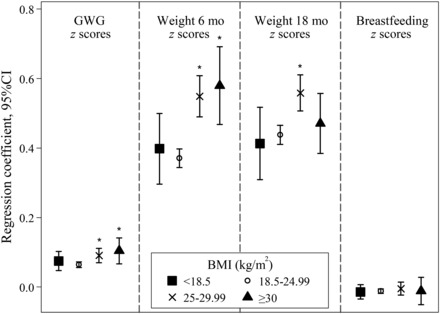
The total effect of pregnancy-related weight changes and breastfeeding duration on maternal weight 7 y after delivery. All variables are included asz scores, and estimates are presented as linear regression coefficients and adjusted for height, age, socio-occupational status, parity, gestational age, child birth weight, physical activity, dietary pattern, smoking during pregnancy, smoking after pregnancy, and time of interviews 3 and 4. Values are presented for women at prepregnancy by BMI (in kg/m2): <18.5 (underweight), 18.5–24.99 (normal weight), 25–29.99 (overweight), and ≥30 (obese). *Pairwise comparison with normal-weight women,P < 0.05. GWG, gestational weight gain.
BMI-adjusted waist circumference 7 y after delivery
Results are shown inTable 4. The total effect of prepregnancy weight was significantly associated with WCBMI 7 y after delivery, and 90% of the total effect was mediated through higher weight in the postpartum period.
TABLE 4.
Path analysis for the association between pregnancy-related weight changes, breastfeeding, and maternal BMI-adjusted waist circumference 7 y after delivery1
| Total effect | Indirect effect | Direct effect | ||||||
| β | 95% CI | β | 95% CI | % of total | β | 95% CI | % of total | |
| Prepregnancy weight | 0.09 | 0.05, 0.14 | 0.11 | 0.08, 0.13 | 90 | −0.01 | −0.06, 0.04 | 10 |
| Total gestational weight gain | −0.01 | −0.02, 0.01 | 0.01 | 0.004, 0.01 | 36 | −0.01 | −0.03, 0.003 | 64 |
| Weight, 6 mo | 0.06 | 0.002, 0.11 | 0.07 | 0.06, 0.09 | 81 | −0.02 | −0.08, 0.04 | 19 |
| Weight, 18 mo | 0.13 | 0.07, 0.18 | — | — | — | 0.13 | 0.07, 0.18 | 100 |
| Breastfeeding duration | −0.03 | −0.04, −0.01 | −0.001 | −0.002, 0.000 | 3 | −0.03 | −0.04, −0.01 | 97 |
All variables arez scores.n = 23,701. Values were adjusted for height, age, socio-occupational status, parity, gestational age, child birth weight, physical activity, dietary pattern, smoking during pregnancy, smoking after pregnancy, and time of interviews 3 and 4.
The total effect of gestational weight gain was not significantly associated with WCBMI, but there was a positive significant indirect effect mediated through weight changes in the postpartum period. The same pattern was seen for both early and late weekly gestational weight gain (see Supplemental Table 6 under “Supplemental data” in the online issue).
Weight at 6 mo postpartum was significantly positively associated with WCBMI at 7 y, and most (81%) of the effect was explained by a higher weight at 18 mo postpartum. Each 1-kg increase in weight retention at 6 mo postpartum corresponded to a 0.03-cm larger WCBMI at 7 y. Gain in weight from 6 to 18 mo postpartum was also significantly positively associated with WCBMI 7 y postpartum, and a 1-kg increase corresponded to a 0.07-cm larger WCBMI at 7 y.
A small significant inverse association of duration of breastfeeding with WCBMI 7 y after delivery was observed, and nearly all (97%) of the effect was direct. This means that it was not explained by any inverse effect that breastfeeding may have had on postpartum weight retention. For WCBMI, we found no difference between prepregnancy BMI groups (see Supplemental Figure 1 under “Supplemental data” in the online issue).
DISCUSSION
In this study, we found that high gestational weight gain increased maternal weight 7 y later primarily by increasing postpartum weight retention. However, both weight retention at 6 mo postpartum and weight gain in the subsequent year, independently of weight gain during pregnancy, had a major effect on weight and on WCBMI 7 y later. We found a small inverse association of breastfeeding duration with weight at 7 y and slightly a stronger inverse association with WCBMI at 7 y. Our results suggest that the first 18 mo postpartum is an important time window for the prevention of long-term maternal obesity.
In previous studies, gestational weight gain above values recommended by the Institute of Medicine/National Research Council (3,34–37), gestational weight gain per week (4,35), and postpartum weight retention (34,36) have all been associated with long-term maternal weight (5–21 y after birth). In the current study, the strong association we found between postpartum weight retention at 6 mo and weight 7 y after delivery was even stronger for overweight and obese women, which may have resulted from their existing weight-control challenges. We found that two-thirds of the effect of postpartum weight retention at 6 mo could be explained by increased weight at 18 mo; however, even if weight was lost at 18 mo postpartum, postpartum weight retention at 6 mo still had a positive effect on weight 7 y postpartum.
Childbearing has been associated with a greater long-term increase in visceral fat mass and waist circumference compared with nonchildbearing (6,38). In childbearing women, abdominal fat mass increased from before pregnancy to 12 mo after delivery, and nonsubcutaneous abdominal fat mass increased between 6 and 12 mo postpartum (8).
A previous study examined long-term maternal waist circumference in relation to gestational weight gain and reported a positive association 16 y after delivery (4). We observed no such association for WCBMI at 7 y or for waist circumference, independent of BMI at 7 y (data not shown). However, we found a small, significant, positive effect mediated through postpartum weight changes. Our results suggest that postpartum weight changes are strongly associated with abdominal fat mass later in life. In other studies, postpartum weight retention in relation to long-term fat distribution was not examined.
Breastfeeding might be important for mobilizing fat gained during pregnancy (39). A previous study within the DNBC showed that breastfeeding was linked to lower postpartum weight retention at 6 and 18 mo (40). In the current study, we found a small inverse association between breastfeeding duration and weight 7 y after delivery, whereas the effect was slightly stronger for WCBMI. Although the literature on long-term weight changes in relation to breastfeeding is inconsistent (14,16,17,36,41), most studies, but not all (42), support an inverse association between total or exclusive breastfeeding and abdominal fat mass (14–16,18,19). The current study contributes to distinguishing between the direct and indirect effects of breastfeeding. In contrast with the primarily indirect effect of breastfeeding on weight 7 y after delivery that we observed, the effect of breastfeeding on WCBMI was direct and not mediated through any weight loss in the postpartum period. It may be that breastfeeding affects weight and WCBMI 7 y postpartum in different ways. A small decrease in weight retention 6 mo postpartum may not decrease abdominal fat mass but may cause slightly lower weights 7 y later. Like most other studies on this topic, we did not have the data to adjust for prepregnancy waist circumference. However, if more abdominal fat mass before pregnancy is associated with a shorter duration of breastfeeding, this may also explain the direct effect we observed between breastfeeding and WCBMI 7 y after delivery. One study reported that women who breastfed had significantly lower skinfold thicknesses from prepregnancy throughout pregnancy and 6 wk postpartum than did nonbreastfeeding women (7). Also, no difference in changes in waist circumference from prepregnancy to an average of 13 mo after weaning was observed between breastfeeding and nonbreastfeeding women (42). More research is needed to clarify the effect of breastfeeding on long-term maternal fat distribution.
The repeated weight measurements and the applied statistical method, which allowed us to examine the influence of weight changes in different periods and the direct and indirect mediating effects, were strengths of the current study. Using this approach, we avoided potential structural bias that occurs when the exposure is part of the outcome (eg, when the association between gestational weight gain and weight change from prepregnancy to later in life is examined) (43). Also, we benefited from the availability of a pregnancy cohort with extensive information on potential confounders. This large cohort allowed us to restrict our study population to women who did not give birth during follow-up, which has seldom been the case previously (3).
Several limitations deserve mention. Our data are observational; therefore, confounding cannot be ruled out. Also, all anthropometric information relied on self-reported data. However, previously self-reported prepregnancy weights have been validated relative to weights observed in antenatal care within a subsample of the DNBC (44). On average, an underreporting of 0.66 kg was observed for prepregnancy weight throughout the entire BMI scale, with a slightly increased underreporting with increasing prepregnancy BMI. This underreporting has been reported previously, including studies validating World Wide Web–based self-reported measures (45–47). We assume that this underreporting was present for postpartum weights as well and therefore might not have affected our association estimates. In the validation study, only a small systematic difference in gestational weight gain was observed, but the variation was large (44), which may have attenuated an association between gestational weight gain and the outcomes in the current study. Additional studies with measured weights would be useful to confirm the findings that we report here.
Given the longitudinal structure of the study, loss to follow-up occurred. Participants in the 7-y follow-up study were healthier and less frequently obese before pregnancy than were those lost to follow-up (23). It may also be that women with excessive weight gain 7 y after birth were less likely to participate in the follow-up, but we had no data with which to examine this. In earlier investigations in the DNBC (23,48), the effect of nonparticipation and loss to follow-up on selected RR estimates was small. Also, by controlling for any factor that may affect a woman’s decision to participate in the follow-up study (eg, socio-occupational status, age, and smoking) we reduced the risk of bias (23). The generalizability of our findings to other racial-ethnic groups is unknown because our study population consisted of white women. However, it seems reasonable to assume that the results may apply to other populations of European origin with a Western lifestyle.
In conclusion, we found that all periods of the reproductive cycle were important contributors to maternal weight and WCBMI 7 y after delivery. Weight changes in the first 18 mo postpartum were strong independent predictors of maternal anthropometric measures 7 y after delivery, regardless of gestational weight gain and BMI group before pregnancy. The early postpartum period may provide a window of opportunity to intervene and prevent adverse maternal weight change and obesity later in life.
Supplementary Material
Acknowledgments
The authors’ responsibilities were as follows—EAN: conceived the study; HK, EAN, HS, and TIAS: planned the analyses; HK: prepared the data set for analysis; HK and HS: conducted the data analysis; HK, HS, KMR, TIAS, and EAN: interpreted the results; HK, HS, KMR, and EAN: prepared the manuscript; BA and TIAS: critically revised the manuscript; and TIAS: participated in the planning and building of the DNBC. All authors read and approved the final manuscript. None of the authors had any conflicts of interest to declare. The funders had no role in the planning, conduct, or interpretation of the study.
FOOTNOTES
The Danish National Research Foundation established the Danish Epidemiology Science Centre, which initiated and created the Danish National Birth Cohort. The cohort is a result of a major grant from this Foundation. Additional support for the Danish National Birth Cohort was obtained from the Pharmacy Foundation, the Egmont Foundation, the March of Dimes Birth Defects Foundation, and the Augustinus Foundation. The 7-y follow-up study received financial support from the Lundbeck Foundation (195/04) and the Danish Medical Research Council (SSVF 0646).
REFERENCES
- 1. Gunderson EP.. Childbearing and obesity in women: weight before, during, and after pregnancy.Obstet Gynecol Clin North Am 2009;36:317–32. [DOI] [PMC free article] [PubMed] [Google Scholar]
- 2. Nohr EA,Vaeth M,Baker JL,Sorensen TI,Olsen J,Rasmussen KM.. Combined associations of prepregnancy body mass index and gestational weight gain with the outcome of pregnancy.Am J Clin Nutr 2008;87:1750–9. [DOI] [PubMed] [Google Scholar]
- 3. Nehring I,Schmoll S,Beyerlein A,Hauner H,von Kries R.. Gestational weight gain and long-term postpartum weight retention: a meta-analysis.Am J Clin Nutr 2011;94:1225–31. [DOI] [PubMed] [Google Scholar]
- 4. Fraser A,Tilling K,Macdonald-Wallis C,Hughes R,Sattar N,Nelson SM,Lawlor DA.. Associations of gestational weight gain with maternal body mass index, waist circumference, and blood pressure measured 16 y after pregnancy: the Avon Longitudinal Study of Parents and Children (ALSPAC).Am J Clin Nutr 2011;93:1285–92. [DOI] [PMC free article] [PubMed] [Google Scholar]
- 5. Rasmussen KM,Abrams B,Bodnar LM,Butte NF,Catalano PM,Maria Siega-Riz A.. Recommendations for weight gain during pregnancy in the context of the obesity epidemic.Obstet Gynecol 2010;116:1191–5. [DOI] [PMC free article] [PubMed] [Google Scholar]
- 6. Gunderson EP,Sternfeld B,Wellons MF,Whitmer RA,Chiang V,Quesenberry CP Jr,Lewis CE,Sidney S.. Childbearing may increase visceral adipose tissue independent of overall increase in body fat.Obesity (Silver Spring) 2008;16:1078–84. [DOI] [PMC free article] [PubMed] [Google Scholar]
- 7. Sidebottom AC,Brown JE,Jacobs DR Jr.. Pregnancy-related changes in body fat.Eur J Obstet Gynecol Reprod Biol 2001;94:216–23. [DOI] [PubMed] [Google Scholar]
- 8. Sohlström A,Forsum E.. Changes in adipose tissue volume and distribution during reproduction in Swedish women as assessed by magnetic resonance imaging.Am J Clin Nutr 1995;61:287–95. [DOI] [PubMed] [Google Scholar]
- 9. Lassek WD,Gaulin SJ.. Changes in body fat distribution in relation to parity in American women: a covert form of maternal depletion.Am J Phys Anthropol 2006;131:295–302. [DOI] [PubMed] [Google Scholar]
- 10. Wells JC,Griffin L,Treleaven P.. Independent changes in female body shape with parity and age: a life-history approach to female adiposity.Am J Hum Biol 2010;22:456–62. [DOI] [PubMed] [Google Scholar]
- 11. Bigaard J,Tjonneland A,Thomsen BL,Overvad K,Heitmann BL,Sorensen TI.. Waist circumference, BMI, smoking, and mortality in middle-aged men and women.Obes Res 2003;11:895–903. [DOI] [PubMed] [Google Scholar]
- 12. Bigaard J,Frederiksen K,Tjonneland A,Thomsen BL,Overvad K,Heitmann BL,Sorensen TI.. Waist and hip circumferences and all-cause mortality: usefulness of the waist-to-hip ratio? Int J Obes Relat Metab Disord 2004;28:741–7. [DOI] [PubMed] [Google Scholar]
- 13. Pischon T,Boeing H,Hoffmann K,Bergmann M,Schulze MB,Overvad K,van der Schouw YT,Spencer E,Moons KG,Tjonneland A,et al. General and abdominal adiposity and risk of death in Europe.N Engl J Med 2008;359:2105–20. [DOI] [PubMed] [Google Scholar]
- 14. Stuebe AM,Kleinman K,Gillman MW,Rifas-Shiman SL,Gunderson EP,Rich-Edwards J.. Duration of lactation and maternal metabolism at 3 years postpartum.J Womens Health (Larchmt) 2010;19:941–50. [DOI] [PMC free article] [PubMed] [Google Scholar]
- 15. Tørris C,Thune I,Emaus A,Finstad SE,Bye A,Furberg AS,Barrett E,Jasienska G,Ellison P,Hjartaker A.. Duration of lactation, maternal metabolic profile, and body composition in the Norwegian EBBA I-Study.Breastfeed Med 2013;8:8–15. [DOI] [PubMed] [Google Scholar]
- 16. Wiklund P,Xu L,Lyytikainen A,Saltevo J,Wang Q,Volgyi E,Munukka E,Cheng S,Alen M,Keinanen-Kiukaanniemi S,et al. Prolonged breast-feeding protects mothers from later-life obesity and related cardio-metabolic disorders.Public Health Nutr 2012;15:67–74. [DOI] [PubMed] [Google Scholar]
- 17. Østbye T,Krause KM,Swamy GK,Lovelady CA.. Effect of breastfeeding on weight retention from one pregnancy to the next: results from the North Carolina WIC program.Prev Med 2010;51:368–72. [DOI] [PubMed] [Google Scholar]
- 18. McClure CK,Catov J,Ness R,Schwarz EB.. Maternal visceral adiposity by consistency of lactation.Matern Child Health J 2012;16:316–21. [DOI] [PMC free article] [PubMed] [Google Scholar]
- 19. McClure CK,Schwarz EB,Conroy MB,Tepper PG,Janssen I,Sutton-Tyrrell KC.. Breastfeeding and subsequent maternal visceral adiposity.Obesity (Silver Spring) 2011;19:2205–13. [DOI] [PMC free article] [PubMed] [Google Scholar]
- 20. De Stavola BL,Nitsch D,dos Santos Silva I,McCormack V,Hardy R,Mann V,Cole TJ,Morton S,Leon DA.. Statistical issues in life course epidemiology.Am J Epidemiol 2006;163:84–96. [DOI] [PubMed] [Google Scholar]
- 21. Gamborg M,Andersen PK,Baker JL,Budtz-Jorgensen E,Jorgensen T,Jensen G,Sorensen TI.. Life course path analysis of birth weight, childhood growth, and adult systolic blood pressure.Am J Epidemiol 2009;169:1167–78. [DOI] [PMC free article] [PubMed] [Google Scholar]
- 22. Winkvist A,Rasmussen KM,Lissner L.. Associations between reproduction and maternal body weight: examining the component parts of a full reproductive cycle.Eur J Clin Nutr 2003;57:114–27. [DOI] [PubMed] [Google Scholar]
- 23. Greene N,Greenland S,Olsen J,Nohr EA.. Estimating bias from loss to follow-up in the Danish National Birth Cohort.Epidemiology 2011;22:815–22. [DOI] [PubMed] [Google Scholar]
- 24. Olsen J,Melbye M,Olsen SF,Sorensen TI,Aaby P,Andersen AM,Taxbol D,Hansen KD,Juhl M,Schow TB,et al. The Danish National Birth Cohort–its background, structure and aim.Scand J Public Health 2001;29:300–7. [DOI] [PubMed] [Google Scholar]
- 25. Nohr EA,Bech BH,Davies MJ,Frydenberg M,Henriksen TB,Olsen J.. Prepregnancy obesity and fetal death: a study within the Danish National Birth Cohort.Obstet Gynecol 2005;106:250–9. [DOI] [PubMed] [Google Scholar]
- 26. Catov JM,Nohr EA,Bodnar LM,Knudson VK,Olsen SF,Olsen J.. Association of periconceptional multivitamin use with reduced risk of preeclampsia among normal-weight women in the Danish National Birth Cohort.Am J Epidemiol 2009;169:1304–11. [DOI] [PMC free article] [PubMed] [Google Scholar]
- 27. Knudsen VK,Orozova-Bekkevold IM,Mikkelsen TB,Wolff S,Olsen SF.. Major dietary patterns in pregnancy and fetal growth.Eur J Clin Nutr 2008;62:463–70. [DOI] [PubMed] [Google Scholar]
- 28. Bentler PM,Stein JA.. Structural equation models in medical research.Stat Methods Med Res 1992;1:159–81. [DOI] [PubMed] [Google Scholar]
- 29. Sterne JA,White IR,Carlin JB,Spratt M,Royston P,Kenward MG,Wood AM,Carpenter JR.. Multiple imputation for missing data in epidemiological and clinical research: potential and pitfalls.BMJ 2009;338:b2393. [DOI] [PMC free article] [PubMed] [Google Scholar]
- 30. van der Heijden GJ,Donders AR,Stijnen T,Moons KG.. Imputation of missing values is superior to complete case analysis and the missing-indicator method in multivariable diagnostic research: a clinical example.J Clin Epidemiol 2006;59:1102–9. [DOI] [PubMed] [Google Scholar]
- 31. Little RJA,Rubin DB.. Statistical analysis with missing data.New York, NY:Wiley,1987. [Google Scholar]
- 32. World Health Organization.Obesity: prevention and managing the global epidemic.Geneva, Switzerland:World Health Organization,2000. [Google Scholar]
- 33. Institute of Medicine/National Research Council.Committee to Reexamine IOM Pregnancy Weight Guidelines, Food and Nutrition Board and Board on Children, Youth, and Families. Weight gain during pregnancy: reexamine the guidelines.Washington, DC:National Academies Press,2009. [Google Scholar]
- 34. Rooney BL,Schauberger CW,Mathiason MA.. Impact of perinatal weight change on long-term obesity and obesity-related illnesses.Obstet Gynecol 2005;106:1349–56. [DOI] [PubMed] [Google Scholar]
- 35. Mamun AA,Kinarivala M,O’Callaghan MJ,Williams GM,Najman JM,Callaway LK.. Associations of excess weight gain during pregnancy with long-term maternal overweight and obesity: evidence from 21 y postpartum follow-up.Am J Clin Nutr 2010;91:1336–41. [DOI] [PubMed] [Google Scholar]
- 36. Amorim AR,Rossner S,Neovius M,Lourenco PM,Linne Y.. Does excess pregnancy weight gain constitute a major risk for increasing long-term BMI? Obesity (Silver Spring) 2007;15:1278–86. [DOI] [PubMed] [Google Scholar]
- 37. Hernandez DC.. Gestational weight gain as a predictor of longitudinal body mass index transitions among socioeconomically disadvantaged women.J Womens Health (Larchmt) 2012;21:1082–90. [DOI] [PMC free article] [PubMed] [Google Scholar]
- 38. Gunderson EP,Murtaugh MA,Lewis CE,Quesenberry CP,West DS,Sidney S.. Excess gains in weight and waist circumference associated with childbearing: the Coronary Artery Risk Development in Young Adults Study (CARDIA).Int J Obes Relat Metab Disord 2004;28:525–35. [DOI] [PMC free article] [PubMed] [Google Scholar]
- 39. Stuebe AM,Rich-Edwards JW.. The reset hypothesis: lactation and maternal metabolism.Am J Perinatol 2009;26:81–8. [DOI] [PMC free article] [PubMed] [Google Scholar]
- 40. Baker JL,Gamborg M,Heitmann BL,Lissner L,Sorensen TI,Rasmussen KM.. Breastfeeding reduces postpartum weight retention.Am J Clin Nutr 2008;88:1543–51. [DOI] [PubMed] [Google Scholar]
- 41. Sichieri R,Field AE,Rich-Edwards J,Willett WC.. Prospective assessment of exclusive breastfeeding in relation to weight change in women.Int J Obes Relat Metab Disord 2003;27:815–20. [DOI] [PubMed] [Google Scholar]
- 42. Gunderson EP,Lewis CE,Wei GS,Whitmer RA,Quesenberry CP,Sidney S.. Lactation and changes in maternal metabolic risk factors.Obstet Gynecol 2007;109:729–38. [DOI] [PMC free article] [PubMed] [Google Scholar]
- 43. Gunderson EP,Abrams B.. Epidemiology of gestational weight gain and body weight changes after pregnancy.Epidemiol Rev 2000;22:261–74. [DOI] [PubMed] [Google Scholar]
- 44. Nohr EA.. Obesity in pregnancy. Epidemiological studies based on the Danish National Birth Cohort. Doctoral dissertation.Aarhus, Denmark:University of Aarhus,2005. [Google Scholar]
- 45. McAdams MA,Van Dam RM,Hu FB.. Comparison of self-reported and measured BMI as correlates of disease markers in US adults.Obesity (Silver Spring) 2007;15:188–96. [DOI] [PubMed] [Google Scholar]
- 46. Connor Gorber S,Tremblay M,Moher D,Gorber B.. A comparison of direct vs. self-report measures for assessing height, weight and body mass index: a systematic review.Obes Rev 2007;8:307–26. [DOI] [PubMed] [Google Scholar]
- 47. Lassale C,Peneau S,Touvier M,Julia C,Galan P,Hercberg S,Kesse-Guyot E.. Validity of web-based self-reported weight and height: results of the nutrinet-sante study.J Med Internet Res 2013;15:e152. [DOI] [PMC free article] [PubMed] [Google Scholar]
- 48. Nohr EA,Frydenberg M,Henriksen TB,Olsen J.. Does low participation in cohort studies induce bias? Epidemiology 2006;17:413–8. [DOI] [PubMed] [Google Scholar]
Associated Data
This section collects any data citations, data availability statements, or supplementary materials included in this article.