

Abstract
Background: Although protein-rich plant foods have recently been touted as an equivalent to animal products, limited data exist regarding the effects of animal vs. plant proteins on appetite, satiety, and subsequent food intake.
Objective: The objective was to determine whether a high-protein beef lunch alters the appetitive, hormonal, and neural signals controlling food intake regulation vs. a macronutrient and fiber–matched (MF) or serving size–matched (SS) soy lunch in healthy adults.
Methods: A randomized, double-blind, crossover design study was completed in 21 adults (aged 23 ± 1 y; body mass index: 23.8 ± 0.6 kg/m2; mean ± SEM) to compare 400-kcal MF and SS lunches varying in protein quality. The MF lunches contained 24-g beef protein or 24-g soy protein, whereas the SS lunches contained 1 serving of beef (24-g protein/1-g fiber) or soy (14-g protein/5-g fiber). Pre- and postlunch appetite questionnaires and blood sampling were completed over an 8-h period until dinner was voluntarily requested. In addition, pre- and postlunch functional MRI brain scans were completed to assess neural activation in response to food stimuli.
Results: On average, dinner was requested at ∼250 ± 20 min postlunch with no differences between beef vs. soy within the MF and SS conditions. Furthermore, no differences in hunger, fullness, peptide YY, or glucagon-like peptide-1 responses were observed after the beef vs. soy lunches within the MF and SS conditions. The SS beef meal led to reductions in anterior cingulate activation (−22 ± 6%) vs. soy (+7 ± 9%;P < 0.01) and greater reductions in insular activation (−30 ± 6%) vs. SS soy (−7 ± 10%;P < 0.01). The participants consumed ∼945 ± 78 kcal after the MF meals and 910 ± 74 kcal after the SS meals with no differences between beef vs. soy.
Conclusions: When comparing 2 high-quality protein sources, such as beef and soy, the type of protein consumed within a mixed meal elicited very little effect on appetite, satiety, and food intake in healthy adults. This study was registered atclinicaltrials.gov as NCT02285907.
Keywords: high-protein diets, soy, beef, satiety, fMRI
Introduction
Because of the ongoing obesity epidemic in the United States (1), numerous dietary approaches have been pursued in efforts to reduce body weight and/or prevent weight (re)gain after weight loss. One dietary strategy gaining scientific support includes the daily consumption of increased dietary protein. Specifically, higher protein, energy-restriction diets, containing between 1.2- and 1.6-g protein · kg−1 · d−1, have led to greater weight loss, greater fat loss, and a greater preservation of lean compared to normal protein versions (2). The effectiveness of these diets may be due in part to modulations in appetite and satiety, leading to voluntary reductions in daily energy intake (2).
The consumption of higher-protein meals increases feelings of fullness, which are accompanied by increases in the satiety hormones peptide YY (PYY)3 and glucagon-like peptide-1 (GLP-1) compared to normal protein versions (2). Several studies also report reductions in feelings of hunger and reductions in the hunger hormone ghrelin compared to normal protein versions (2). Recent evidence also demonstrates reductions in neural activation in brain regions controlling food motivation, reward, and cravings after high-protein vs. normal-protein breakfast meals (3,4). Collectively, these findings suggest that increasing the quantity of protein alters the signals that influence perceived fullness, hunger, and food cravings. However, other dietary factors exist with respect to dietary protein that might influence these protein-related effects. One such factor includes the quality or type of protein consumed.
Currently, only 1 recently published longer-term study exists comparing eucaloric high-protein diets that differed in the types of protein consumed. When comparing a meat diet of chicken and beef vs. a vegetarian diet primarily of soy protein (5), no differences in body weight or body composition were detected. However, each diet was only 2 wk in duration (5). Regarding the mechanistic evidence from acute studies, conflicting data exist with some (6–8), but not all studies (5,9–11), reporting satiety differences when comparing animal vs. plant-based proteins. However, the majority of these studies compared soy to dairy proteins and none directly compared beef vs. soy. Thus, we first sought to examine the effects of consuming 2 isocaloric, macronutrient and fiber–matched lunch meals, varying only in the type of protein consumed (i.e., beef vs. soy), on appetite control, satiety, and subsequent food intake. In addition, we also extended the current outcomes beyond the appetitive and hormonal responses to include the examination of neural activation associated with food cravings and reward. The incorporation of each of these outcomes allows for the comprehensive examination of both homeostatic and hedonic eating behavior responses to protein type, which have not been previously explored.
Lastly, with the release of the 2010 USDA Dietary Guidelines recommending Americans increase consumption of foods rich in plant-based proteins, like soy (12), there has been a push in the lay press to replace beef products with soy versions. However, the majority of beef and soy commercially available products are not equivalent in terms of protein quantity. For example, a single serving of soy (i.e., soy patty) contains only 14-g protein, whereas a beef patty contains 24-g protein (13). On the other hand, soy products are typically higher in fiber (∼5-g fiber) (13), which is another dietary factor known to stimulate satiety and weight loss (14,15). Thus, it is unclear as to whether the consumption of a single serving of beef is equivalent to a single serving of soy in terms of their effects on appetite control and satiety. Thus, the second aim of this study was to compare 2 isocaloric, serving size–matched beef vs. soy lunch meals on indices of appetite control, satiety, and subsequent food intake.
Methods
Participants.
From July to November 2012, healthy young adults were recruited from the Columbia, Missouri, area through advertisements, flyers, and e-mail list serves to participate in the study. Eligibility was determined through the following inclusion criteria:1) healthy;2) aged 18–30 y;3) normal weight to overweight (BMI: 18–28 kg/m2);4) weight stable (no weight loss/gain within the past 6 mo);5) not currently on a weight loss or other special diet (in the past 6 mo); and6) not a vegetarian.
A total of 236 young adults were initially interested in participating in the study. Of these, 24 met the screening criteria and signed the study consent form. Twenty-one completed all study procedures. Those who completed the study were 23 ± 1 y of age with a BMI of 23.4 ± 0.6 kg/m2 (mean ± SEM). All participants were informed of the study purpose, procedures, and risks and signed the consent form. The study was approved by the University of Missouri Health Sciences Institutional Review Board, and all procedures were followed in accordance with the ethical standards of the Health Sciences Institutional Review Board. The participants received $500 for completing all study procedures. This study was registered atclinicaltrials.gov as NCT02285907.
Experimental design.
A randomized, double-blind, crossover design acute study was completed in 21 healthy adults to compare 400-kcal lunch meals varying in protein quality but matched for either macronutrient or fiber content or serving size. In the macronutrient and fiber–matched comparisons, both lunch meals contained 24-g protein and 2-g fiber, differing only in the type of protein consumed (beef vs. soy). In the serving size–matched comparisons, the lunch meals contained 1 serving of beef (24-g protein/1-g fiber) or 1 serving of soy (14-g protein/5-g fiber). The participants completed 2 testing days per lunch treatment. During the first testing day, the participants consumed a standard breakfast, at home, and reported to the lab between 1100 and 1300 to consume 1 of the lunch meals. Similar to previous studies (16–18), each participant was placed in a comfortable room that was absent of time cues. Thus, clocks were removed from the facility, the research assistants and study participants were asked to remove watches and turn off cell phones, and all clocks on the laptops were unpinned. Pre- and 7-h postlunch appetite questionnaires and repeated blood sampling for satiety hormones were completed throughout each testing day until the participants voluntarily requested to eat again. At that time, an ad libitum buffet was provided. After the completion of the testing day, the participants left the facility and were permitted to freely eat throughout the remainder of the day until going to bed. Evening energy intake was assessed through a dietary recall performed the following day. During the second testing day, the participants consumed a standard breakfast, at home, and reported to the lab between 1100 and 1300 to consume 1 of the lunch meals. Pre- and postlunch food cue–stimulated fMRI brain scans were completed. Within each treatment, the first and second testing days were separated by 2–7 d. However, there was 7–14 d in between each treatment. Lastly, the study participants were not conditioned to the study meals before the testing days.
Lunch meals.
The dietary characteristics of the meals are shown inTable 1. All meals were isocaloric. The beef and soy macronutrient and fiber–matched meals (hereafter referred to as “BEEF” and “SOY” meals) were pasta meals containing 33% protein, 43% carbohydrates, and 24% fat. The BEEF meal contained 24-g beef protein from 96% lean ground beef (Cargill), whereas the SOY meal contained 24-g textured soy protein concentrate (Boca Foods). Soy fiber (Nutritional Designs) was added to the BEEF meal to match total fiber content between meals. Within the serving size comparison, the BEEF and SOY meals were sandwiches. The BEEF meal was 33% protein, 43% carbohydrate, and 24% fat and contained 24-g beef protein from 96% lean ground beef patty (Cargill). The SOY meal was 24% protein, 49% carbohydrate, and 24% fat and contained 14-g textured soy protein concentrate (Boca Foods).
TABLE 1.
Dietary characteristics of the lunch meals
| Protein comparison (macronutrient and fiber matched) | Serving size comparison (serving size matched to 1 serving) | |||
|---|---|---|---|---|
| BEEF | SOY | BEEF | SOY | |
| Meal type | Pasta dish | Pasta dish | Sandwich | Sandwich |
| Energy content, kcal | 400 | 400 | 400 | 400 |
| Total protein, g | 34 | 34 | 34 | 24 |
| Specific source, g | 24 | 24 | 24 | 14 |
| Carbohydrates, g | 44 | 44 | 44 | 49 |
| Fiber, g | 2 | 2 | 1 | 5 |
| Fat, g | 11 | 11 | 11 | 11 |
| Lunch palatability,1 mm | 70 ± 4 | 65 ± 5 | 71 ± 5 | 65 ± 5 |
Values are means ± SEMs,n = 21.
To assess the palatability of each meal, a 100-mm visual analogue scale questionnaire was completed at the end of each meal to assess overall liking. The Adaptive Visual Analogue Scale Software (Neurobehavioral Research Laboratory and Clinic) was used for this measure. Palatability was not different between the BEEF vs. SOY meals (Table 1).
Random assignment and study blinding.
The study participants were equally randomly assigned (Research Randomizer,www.randomizer.org) to the 4 study treatments (i.e., macronutrient and fiber–matched BEEF, macronutrient and fiber–matched SOY, serving size–matched BEEF, and serving size–matched SOY) such that there was an equal number of treatments completed on each study day.
The study participants were informed the general purpose of the study was to “identify how the body and mind respond to the consumption of different protein sources.” In addition, we also informed them that they would be consuming ground beef and soy protein. Although the study participants were aware that the study meals contained these ingredients, they were not aware of which meals contained the respective protein source. Each meal was given a letter code that was unknown by the participants and the primary investigator. Furthermore, we purposefully chose meals (pastas and burgers) that would allow us to mask any small differences in appearance and texture of the ground beef vs. soy protein.
Specific testing day procedures.
Validated hunger and fullness questionnaires (19) and blood samples (4 ml/sample) were completed every 30 min throughout the testing days. The blood samples were collected in test tubes containing EDTA and protease inhibitors [15-μl 4-(2-Aminoethyl) benzenesulfonyl fluoride hydrochloride (AEBSF)/sample and 30-μl Dipeptidyl peptidase-4 (DPP-IV)/sample] were added to reduce protein degradation. Plasma total GLP-1 and total PYY were measured with use of the Milliplex magnetic bead assays (Millipore) and Magpix Luminex technologies (Luminex Corporation).
Immediately after the request to eat dinner, the participants were provided with an ad libitum buffet consisting of foods provided in our previous studies (4,20). The participants were instructed to “eat and/or drink as much or as little as desired until feeling comfortably full” within 30 min. All foods were weighed before consumption and remaining contents were weighed after the meal to determine the amount consumed.
Food-cue stimulated fMRI brain scans were performed before and immediately after the consumption of each of the lunch conditions. Similar methodology has been used in our previous studies (4,21). In general, the participants viewed 3 categories of pictures including food, nonfood (animals), and blurred baseline images. The pictures from each category were presented in blocks of images. Animal pictures were used to control for visual richness and general interest (i.e., appealing but not appetizing). Food pictures were different for each individual fMRI scan, and thus, the study participants never viewed the same picture more than once. In addition, the study meals were not shown as pictures during the scans. Scanning was performed at the University of Missouri-Brain Imaging Center on a 3 Tesla Siemens Trio scanner (Siemens Medical Solutions).
Data and statistical analysis.
A power analysis was performed before the start of the study to identify an appropriate sample size. Because of the lack of data comparing beef vs. plant-based protein sources, the difference in postmeal perceived hunger after whey vs. soy in Veldhorst et al. (22) was used to determine sample size. The 20% differential in hunger between the whey vs. soy conditions led to an effect size of 0.8, indicating a sample size of 20 would provide 80% power to detect differences between meals.
Summary statistics (sample means and sample SDs) were computed for all data. Net incremental area under the curve (niAUC) was calculated from postprandial time points until dinner was voluntarily requested. For each comparison (i.e., macronutrient and fiber–matched and serving size–matched), repeated measures ANOVAs were performed to identify the main effects of the protein source (BEEF vs. SOY) for the niAUC appetitive and hormonal responses, eating initiation (i.e., time-to-dinner request), and subsequent food intake assessments.
The postlunch brain activation responses were preprocessed with use of procedures described previously (4). To determine the effects of protein type on neural activity associated with food motivation, repeated measures ANOVAs were performed on the brain activation maps within the Brain Voyager software with use of stimulus [food (i.e., appetizing and appealing) vs. nonfood (i.e., animal, nonappetizing but appealing] and protein source (BEEF vs. SOY) comparisons within the macronutrient and fiber–matched condition and the serving size–matched conditions, separately. To identify significant activations in a priori regions, a cluster-level statistical threshold was applied to correct for multiple comparisons. Significance was set atP = 0.01 with a cluster-level, false-positive rate of a = 0.05. In addition, mean percent signal change in the maximum voxel within each region that displayed significant activation after the BEEF and SOY meals was also determined.
Results are reported as means ± SEMs. Analyses were conducted with use of the Statistical Package for the Social Sciences (SPSS, version 21.0).P < 0.05 was considered statistically significant.
Results
Eating initiation.
Dinner was voluntarily requested at 250 ± 15 min after the macronutrient and fiber–matched BEEF meal and 270 ± 20 min after the SOY meal with no differences between conditions (P = 0.07). Regarding the serving size comparisons, dinner was requested at 245 ± 25 min after the BEEF lunch and 250 ± 20 min after the SOY lunch with no differences between conditions (P = 0.88).
Perceived sensations.
The postlunch changes in perceived hunger and fullness after each of the lunch conditions are shown inFigure 1. All meals led to immediate postprandial declines in hunger and increases in fullness followed by gradual rises in hunger and declines in fullness until dinner was requested. When comparing the macronutrient and fiber–matched BEEF vs. SOY meals, no differences in hunger or fullness niAUCs were observed (Table 2). When comparing the serving size–matched beef vs. soy meals, no differences in hunger or fullness niAUCs were observed (Table 2).
FIGURE 1.
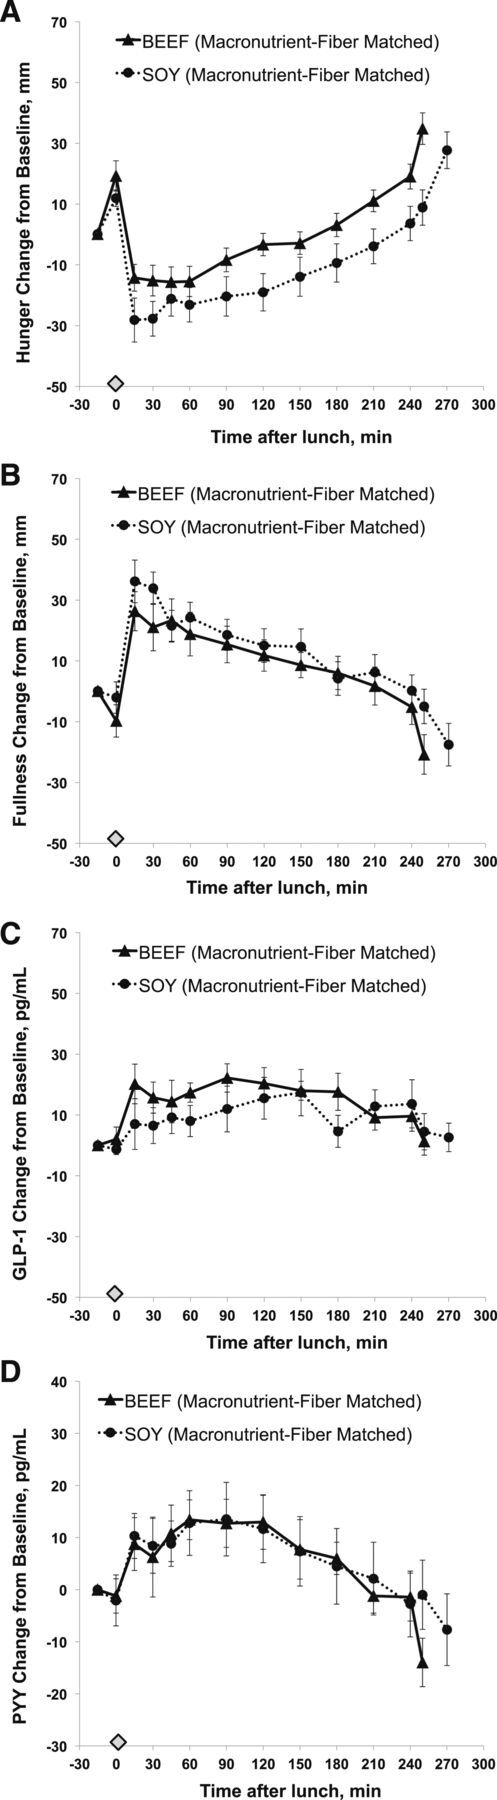
Changes in hunger (A), fullness (B), and plasma GLP-1 (C) and PYY (D) concentrations relative to the consumption of the macronutrient- and fiber-matched BEEF and SOY lunch meals in 21 healthy adults. The diamond represents time when lunch was provided. Values are means ± SEMs,n = 21. GLP-1, glucagon-like peptide-1; PYY, peptide YY.
TABLE 2.
niAUC after the BEEF and SOY lunch meals within the protein comparison and serving size comparison conditions in 21 healthy adults1
| Protein comparison (macronutrient and fiber matched) | Serving size comparison (serving size matched to 1 serving) | |||||
|---|---|---|---|---|---|---|
| BEEF | SOY | P 2 | BEEF | SOY | P 2 | |
| Hunger niAUC, mm · min | 45 ± 1000 | −2840 ± 1650 | 0.16 | −1360 ± 1410 | 745 ± 1480 | 0.26 |
| Fullness niAUC, mm · min | 2440 ± 1360 | 3320 ± 1600 | 0.62 | 2270 ± 1220 | 1910 ± 1560 | 0.76 |
| GLP-1 niAUC, pg/mL · min | 4100 ± 811 | 2790 ± 1450 | 0.38 | 2120 ± 916 | 4870 ± 1200 | 0.10 |
| PYY niAUC, pg/mL · min | 1590 ± 944 | 1330 ± 1710 | 0.90 | 1980 ± 1640 | 1720 ± 6430 | 0.97 |
Values are means ± SEMs,n = 21. GLP-1, glucagon-like peptide-1; niAUC, net incremental area under the curve; PYY, peptide YY.
Repeated measures ANOVA: main effect of protein source (BEEF vs. SOY) within protein or serving size comparison.
Hormonal responses.
The postlunch changes in GLP-1 and PYY concentrations after each of the lunch conditions are shown inFigure 2. All meals led to postprandial increases in GLP-1 and PYY concentrations followed by gradual declines until dinner was requested. When comparing the macronutrient and fiber–matched BEEF vs. SOY meals, no differences in GLP-1 or PYY niAUCs were observed (Table 2). When comparing the serving size–matched BEEF vs. SOY meals, no differences in GLP-1 or PYY niAUCs were observed (Table 2).
FIGURE 2.
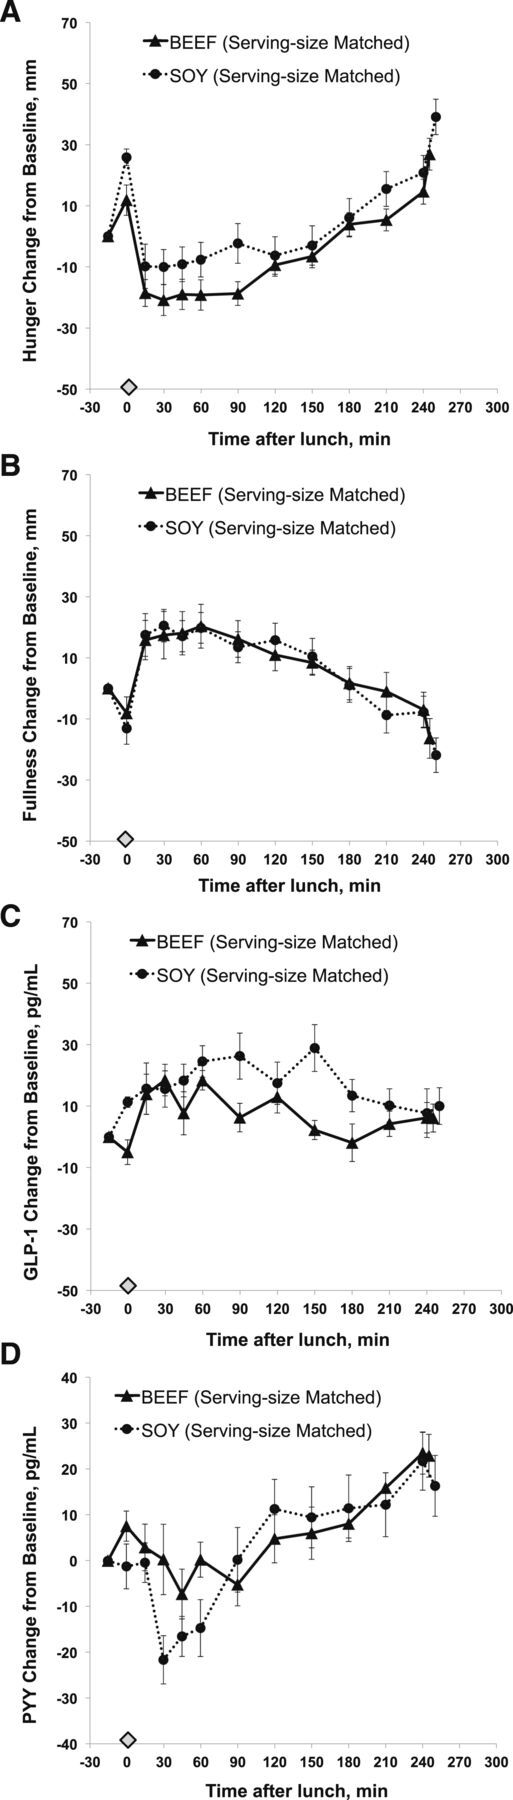
Changes in hunger (A), fullness (B), GLP-1 plasma concentrations (C), and PYY plasma concentrations (D) relative to the consumption of the serving size–matched BEEF and SOY lunch meals in 21 healthy adults. The diamond represents time when lunch was provided. Values are means ± SEMs,n = 21. GLP-1, glucagon-like peptide-1; PYY, peptide YY.
fMRI neural activation.
No differences in the postlunch fMRI neural responses were detected between the BEEF and SOY meals within the macronutrient and fiber–matched condition. However, differences were observed within the serving size–matched comparisons. The brain regions that elicited greater neural activation following the consumption of the serving size-matched SOY lunch compared to the BEEF lunch are shown inFigure 3A. Postlunch brain activity in response to food stimuli was greater in the anterior cingulate (Talairach coordinates: 2; 25; 0; see crosshair) and insula (Talairach coordinates: −40; 10; −8; see crosshair) after the SOY meal compared to BEEF. When expressed as percent signal change (Figure 3B), the consumption of the serving size–matched BEEF meal led to reductions in activation in the anterior cingulate (−22 ± 6%) vs. SOY (+7 ± 9%;P < 0.01) and greater reductions in insular activation (−30 ± 6%) vs. SOY (−7 ± 10%;P < 0.01). No other differences were detected within this condition.
FIGURE 3.
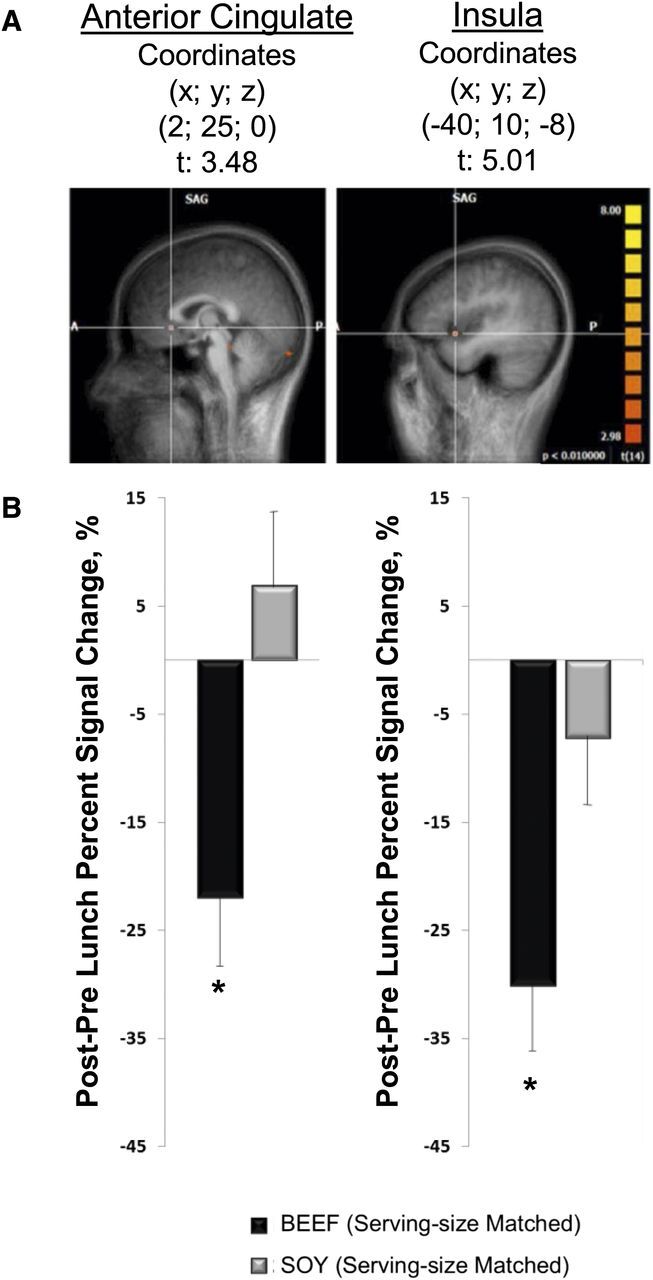
Brain activation contrast maps after the serving size–matched BEEF vs. SOY lunch meals in 21 healthy adults. Panel A depicts the fMRI brain contrast maps in which the change in neural responses after the SOY meal is greater than the BEEF meal (P < 0.01), whereas panel B represents the percent signal change after the BEEF vs. SOY meal. Values are means ± SEMs,n = 21. *Different from SOY,P < 0.05.
Food intake.
Macronutrient and energy content of the ad libitum dinner and evening intake are shown inTable 3. On average, the participants consumed ∼930 kcal at the dinner meal with no differences between the macronutrient and fiber–matched BEEF vs. SOY meals or between the serving size–matched BEEF vs. SOY meals. No differences in the macronutrient content of the dinners were detected between meals. Finally, the energy and macronutrient content throughout the evening were also not different between the macronutrient and fiber–matched BEEF vs. SOY meals or between the serving size–matched BEEF vs. SOY meals (Table 3).
TABLE 3.
Subsequent food intake after the BEEF and SOY lunch meals within the protein comparison and serving size comparison conditions in 21 healthy adults1
| Protein comparison (macronutrient and fiber matched) | Serving size comparison (serving size matched to 1 serving) | |||||
|---|---|---|---|---|---|---|
| BEEF | SOY | P 2 | BEEF | SOY | P 2 | |
| Ad libitum dinner buffet | ||||||
| Energy content, kcal | 920 ± 74 | 970 ± 82 | 0.59 | 920 ± 75 | 900 ± 72 | 0.70 |
| Protein, g | 38 ± 5 | 39 ± 5 | 0.65 | 36 ± 4 | 36 ± 5 | 0.97 |
| Carbohydrates, g | 110 ± 9 | 110 ± 12 | 0.78 | 120 ± 12 | 110 ± 9 | 0.28 |
| Fat, g | 40 ± 5 | 43 ± 5 | 0.43 | 39 ± 4 | 40 ± 4 | 0.64 |
| Evening snacks | ||||||
| Energy content, kcal | 340 ± 74 | 380 ± 90 | 0.58 | 640 ± 130 | 420 ± 120 | 0.24 |
| Protein, g | 14 ± 5 | 13 ± 3 | 0.82 | 24 ± 4 | 12 ± 6 | 0.11 |
| Carbohydrates, g | 43 ± 8 | 46 ± 10 | 0.72 | 83 ± 16 | 48 ± 12 | 0.11 |
| Fat, g | 13 ± 4 | 12 ± 4 | 0.78 | 21 ± 6 | 14 ± 5 | 0.33 |
Values are means ± SEMs,n = 21.
Repeated measures ANOVA: main effect of protein source (BEEF vs. SOY) within protein or serving size comparison.
Discussion
No differences in the appetitive and hormonal signals known to modulate food intake were observed after the consumption of isocaloric, macronutrient and fiber–matched, or serving size–matched BEEF vs. SOY meals in healthy adults. Although the BEEF lunch led to reduced cortico-limbic neural activation compared to the SOY meal, this was only demonstrated within the serving size comparisons when protein and fiber varied. Lastly, eating initiation of the dinner meal and subsequent food intake were not different between the macronutrient and fiber–matched or serving size–matched BEEF vs. SOY meals. Thus, when comparing 2 high-quality protein sources, such as beef and soy, the type of protein consumed within a mixed meal elicited very little effect on the signals that modulate food intake in healthy adults.
Although an increasing number of acute studies have been completed examining the effects of protein quality on appetite control, satiety, and energy intake, only a few have compared animal vs. plant-based proteins. In 3 preload studies, beverages containing soy or gluten were compared to egg, whey, and/or casein (6,9,10). Bowen et al. (9) and Alfenas et al. (10) reported no differences in postprandial perceived sensations, satiety-related hormonal responses, or subsequent meal intake after the consumption of soy vs. whey, casein, and/or gluten preloads. However, Anderson and Moore (6) demonstrated reductions in subsequent meal intake after the consumption of soy vs. egg. Several studies using a mixed-meal approach compared soy, pea, and/or gluten proteins to whey, casein, and/or egg (7,11,23). Although Lang et al. (11) reported no differences in perceived sensations or subsequent meal intake between the plant- vs. animal-based meals, Veldhorst et al. (7) and Acheson et al. (23) demonstrated improvements in appetite control and/or satiety after the consumption of soy vs. whey and/or casein meals. Yet, no differences in subsequent meal intake were observed (7). The conflicting findings may be due to several design limitations.
Specifically, 4 of the studies included beverages instead of solid foods (6,9,10,23). Because beverage consumption elicits a blunted appetitive response compared to solid foods (21,24,25), any slight, yet significant, differences between the protein sources may have been masked by the form of the protein. In addition, the quantities of protein varied widely across studies with some incorporating fairly large quantities of protein (i.e., 70-g protein/meal). This amount may have led to a satiety “ceiling effect,” which may have masked any effect of protein quality. Lastly, none of the previous studies compared solid meals containing whole food and/or muscle protein sources.
Recently, Neacsu et al. (5) compared vegetarian solid meals, primarily composed of soy protein, vs. animal-based solid meals containing beef and chicken. No differences in postprandial perceived sensations (i.e., hunger, fullness, and desire to eat) or hormonal satiety responses (i.e., GLP-1 and PYY) were detected between the vegetarian vs. animal-based meals (5). Our current study confirmed the lack of postprandial differences in perceived sensations and hormonal responses after the consumption of macronutrient and fiber–matched solid meals containing beef vs. soy. Collectively, these data suggest that high-quality proteins, regardless of source, can be used as equivalents when developing protein-rich meals.
In addition to the tightly matched beef vs. soy comparison, we also included a single serving size comparison in which the BEEF meal contained an additional 10-g protein compared to the SOY meal but had less fiber (i.e., 4 g) than the SOY meal. Again, no differences in postprandial perceived sensations or hormonal satiety responses were detected, regardless of the protein and fiber differences. Thus, although speculative, these data suggest that foods containing a combination of fiber and protein elicit a similar satiety response to foods that are primarily rich in protein. This concept is supported by the study of Karhunen et al. (26), which compared the appetite and satiety effects after the consumption of meals that varied in protein and fiber content. No differences in the postprandial perceived sensations (hunger, fullness, desire to eat) and satiety hormonal responses (GLP-1 and PYY) were detected between the high-protein vs. high-fiber meals (i.e., low-protein/high-fiber meal vs. high-protein/low-fiber meal). Furthermore, although the 4-g fiber differential in our study is relatively small, it has been suggested to be sufficient to elicit a satiety effect (27,28). Further work is needed to examine the potential synergistic effect of protein and fiber for appetite control, satiety, and weight management outcomes.
Much of the current research has focused on homeostatic markers of appetite control and satiety, primarily assessing the gastrointestinal satiety hormones in combination with perceived hunger and fullness (satiety). However, the assessment of hedonic, reward-driven eating is also paramount because of the food-centric, obesogenic environment in which we live. Using food-cue–stimulated fMRI, we are able to assess changes in neural activation in select cortico-limbic regions known to control food motivation, cravings, and/or reward in response to the consumption of test meals (3,4). In the current study, no differences in cortico-limbic activation were detected after the consumption of macronutrient and fiber–matched BEEF vs. SOY meals. However, regarding the serving size comparisons, the higher-protein/lower-fiber beef meal led to reduced activation in the anterior cingulate and insula compared to the lower-protein/higher-fiber soy meal. Although preliminary, these data suggest that protein quantity elicits a greater positive effect on indices of reward-driven eating behavior than protein quality. However, it is important to acknowledge the fact that, although these neural differences were detected, they did not translate into reductions in subsequent food intake. Thus, further research assessing the significance and interaction of homeostatic and hedonic eating behavior is warranted.
Limitations.
Although this study included a tightly controlled feeding design, it is an acute trial assessing the protein source–related differences over the course of a single day. As discussed in Blundell et al. (29), this design is the “most influential experimental” approach to assess postprandial appetite because it provides great control over the intervention and study outcomes. Although acute trials are highly valuable and widely used, they do not assess whether the acute changes (or lack thereof) would continue over the longer term. Thus, this study serves as a first step in examining the influence of protein quality and source on appetite control and satiety. Longer-term feeding trials examining practical outcomes of weight management and daily food intake are warranted.
The current study included only 1 type of animal vs. plant-based protein comparison (i.e., beef vs. soy). Given that soy is a high-quality plant source, it is unclear whether other types of plant-based proteins that are incomplete in terms of their amino acid profile (i.e., gluten, nuts, rice, etc.) would elicit a similar response. Along these lines, no single study to date has compared all animal and plant-based sources to comprehensively examine the effects of protein source/quality on appetite control and satiety.
Finally, because previous studies have illustrated satiety differences with the consumption of ∼30-g protein/meal (2), we chose a protein quantity of 34-g/meal for the current study. However, the fairly large amount of protein included within these meals may have reduced the ability to detect slight differences based on protein quality.
Conclusions.
When comparing 2 high-quality protein sources, such as beef and soy, the type of protein consumed elicited very little effect on appetite control, satiety, and subsequent food intake in healthy adults and may be used as equivalents when developing higher-protein meals.
Acknowledgments
We thank Lana Merrick, the metabolic kitchen supervisor and research chef, for the development and preparation of the lunch meals. SMD and HJL designed the research project; SMD, TRL, and HJL substantially contributed to the completion of the testing days, data entry, and data analyses; SMD and HJL completed all statistical analyses; SMD developed the first draft of the manuscript; and SMD and HJL substantially contributed to the completion of the manuscript. All authors read and approved the final manuscript.
Abbreviations
- GLP-1
glucagon-like peptide-1
- niAUC
net incremental area under the curve
- PYY
peptide YY
Footnotes
Funded by the Beef Checkoff.
References
- 1. Ogden CL,Carroll MD,Kit BK,Flegal KM. Prevalence of childhood and adult obesity in the United States, 2011–2012.JAMA 2014;311:806–14. [DOI] [PMC free article] [PubMed] [Google Scholar]
- 2. Leidy HJ,Clifton PM,Astrup A,Wycherley TP,Westerterp-Plantenga MS,Luscombe-Marsh N,Woods SC,Mattes R. The role of protein in weight loss and maintenance.AJCN. In press. [DOI] [PubMed] [Google Scholar]
- 3. Leidy HJ,Lepping RJ,Savage CR,Harris CT. Neural responses to visual food stimuli after a normal vs. higher protein breakfast in breakfast-skipping teens: a pilot fMRI study.Obesity (Silver Spring) 2011;19:2019–25. [DOI] [PMC free article] [PubMed] [Google Scholar]
- 4. Leidy HJ,Ortinau LC,Douglas SM,Hoertel HA. Beneficial effects of a higher-protein breakfast on the appetitive, hormonal, and neural signals controlling energy intake regulation in overweight/obese, "breakfast-skipping," late-adolescent girls.Am J Clin Nutr 2013;97:677–88. [DOI] [PMC free article] [PubMed] [Google Scholar]
- 5. Neacsu M,Fyfe C,Horgan G,Johnstone AM. Appetite control and biomarkers of satiety with vegetarian (soy) and meat-based high-protein diets for weight loss in obese men: a randomized crossover trial.Am J Clin Nutr 2014;100:548–58. [DOI] [PubMed] [Google Scholar]
- 6. Anderson GH,Moore SE. Dietary proteins in the regulation of food intake and body weight in humans.J Nutr 2004;134:974S–9S. [DOI] [PubMed] [Google Scholar]
- 7. Veldhorst MA,Nieuwenhuizen AG,Hochstenbach-Waelen A,van Vught AJ,Westerterp KR,Engelen MP,Brummer RJ,Deutz NE,Westerterp-Plantenga MS. Dose-dependent satiating effect of whey relative to casein or soy.Physiol Behav 2009;96:675–82. [DOI] [PubMed] [Google Scholar]
- 8. Veldhorst MA,Nieuwenhuizen AG,Hochstenbach-Waelen A,Westerterp KR,Engelen MP,Brummer RJ,Deutz NE,Westerterp-Plantenga MS. A breakfast with alpha-lactalbumin, gelatin, or gelatin + TRP lowers energy intake at lunch compared with a breakfast with casein, soy, whey, or whey-GMP.Clin Nutr 2009;28:147–55. [DOI] [PubMed] [Google Scholar]
- 9. Bowen J,Noakes M,Clifton PM. Appetite regulatory hormone responses to various dietary proteins differ by body mass index status despite similar reductions in ad libitum energy intake.J Clin Endocrinol Metab 2006;91:2913–9. [DOI] [PubMed] [Google Scholar]
- 10. Alfenas R C,Bressan J,Paiva AC. Effects of protein quality on appetite and energy metabolism in normal weight subjects.Arq Bras Endocrinol Metabol 2010;54:45–51. [DOI] [PubMed] [Google Scholar]
- 11. Lang V,Bellisle F,Oppert JM,Craplet C,Bornet FR,Slama G,Guy-Grand B. Satiating effect of proteins in healthy subjects: a comparison of egg albumin, casein, gelatin, soy protein, pea protein, and wheat gluten.Am J Clin Nutr 1998;67:1197–204. [DOI] [PubMed] [Google Scholar]
- 12. Agriculture USDo, Services USDoHaH Dietary guidelines for Americans, 2010.7th edWashington (DC):US Government Printing Office;2010. [Google Scholar]
- 13. USDA National Nutrient Database for Standard Reference [Internet]. [cited 2015 Mar 11]. Available from:http://ndb.nal.usda.gov/.
- 14. Birketvedt GS,Aaseth J,Florholmen JR,Ryttig K. Long-term effect of fibre supplement and reduced energy intake on body weight and blood lipids in overweight subjects.Acta Medica (Hradec Kralove) 2000;43:129–32. [PubMed] [Google Scholar]
- 15. Hu X,Gao J,Zhang Q,Fu Y,Li K,Zhu S,Li D. Soy fiber improves weight loss and lipid profile in overweight and obese adults: a randomized controlled trial.Mol Nutr Food Res 2013;57:2147–54. [DOI] [PubMed] [Google Scholar]
- 16. Douglas SM,Ortinau LC,Hoertel HA,Leidy HJ. Low, moderate, or high protein yogurt snacks on appetite control and subsequent eating in healthy women.Appetite 2013;60:117–22. [DOI] [PubMed] [Google Scholar]
- 17. Ortinau LC,Culp JM,Hoertel HA,Douglas SM,Leidy HJ. The effects of increased dietary protein yogurt snack in the afternoon on appetite control and eating initiation in healthy women.Nutr J 2013;12:71. [DOI] [PMC free article] [PubMed] [Google Scholar]
- 18. Ortinau LC,Hoertel HA,Douglas SM,Leidy HJ. Effects of high-protein vs. high-fat snacks on appetite control, satiety, and eating initiation in healthy women.Nutr J 2014;13:97. [DOI] [PMC free article] [PubMed] [Google Scholar]
- 19. Flint A,Raben A,Blundell JE,Astrup A. Reproducibility, power and validity of visual analogue scales in assessment of appetite sensations in single test meal studies.Int J Obes Relat Metab Disord 2000;24:38–48. [DOI] [PubMed] [Google Scholar]
- 20. Leidy HJ,Racki EM. The addition of a protein-rich breakfast and its effects on acute appetite control and food intake in 'breakfast-skipping' adolescents.Int J Obes (Lond) 2010;34:1125–33. [DOI] [PMC free article] [PubMed] [Google Scholar]
- 21. Leidy HJ,Bales-Voelker LI,Harris CT. A protein-rich beverage consumed as a breakfast meal leads to weaker appetitive and dietary responses than a solid breakfast meal in adolescents.Br J Nutr 2011;106:37–41. [DOI] [PMC free article] [PubMed] [Google Scholar]
- 22. Veldhorst MA,Nieuwenhuizen AG,Hochstenbach-Waelen A,Westerterp KR,Engelen MP,Brummer RJ,Deutz NE,Westerterp-Plantenga MS. Effects of high and normal soy protein breakfasts on satiety and subsequent energy intake, including amino acid and ‘satiety’ hormone responses.Eur J Nutr 2009;48:92–100. [DOI] [PubMed] [Google Scholar]
- 23. Acheson KJ,Blondel-Lubrano A,Oguey-Araymon S,Beaumont M,Emady-Azar S,Ammon-Zufferey C,Monnard I,Pinaud S,Nielsen-Moennoz C,Bovetto L. Protein choices targeting thermogenesis and metabolism.Am J Clin Nutr 2011;93:525–34. [DOI] [PubMed] [Google Scholar]
- 24. Mourao DM,Bressan J,Campbell WW,Mattes RD. Effects of food form on appetite and energy intake in lean and obese young adults.Int J Obes (Lond) 2007;31:1688–95. [DOI] [PubMed] [Google Scholar]
- 25. Leidy HJ,Apolzan JW,Mattes RD,Campbell WW. Food form and portion size affect postprandial appetite sensations and hormonal responses in healthy, nonobese, older adults.Obesity (Silver Spring) 2010;18:293–9. [DOI] [PMC free article] [PubMed] [Google Scholar]
- 26. Karhunen LJ,Juvonen KR,Flander SM,Liukkonen KH,Lahteenmaki L,Siloaho M,Laaksonen DE,Herzig KH,Uusitupa MI,Poutanen KS. A psyllium fiber-enriched meal strongly attenuates postprandial gastrointestinal peptide release in healthy young adults.J Nutr 2010;140:737–44. [DOI] [PubMed] [Google Scholar]
- 27. Gustafsson K,Asp NG,Hagander B,Nyman M. Dose-response effects of boiled carrots and effects of carrots in lactic acid in mixed meals on glycaemic response and satiety.Eur J Clin Nutr 1994;48:386–96. [PubMed] [Google Scholar]
- 28. Mathern JR,Raatz SK,Thomas W,Slavin JL. Effect of fenugreek fiber on satiety, blood glucose and insulin response and energy intake in obese subjects. Phytotherapy research.PTR 2009;23:1543–8. [DOI] [PubMed] [Google Scholar]
- 29. Blundell J,de Graaf C,Hulshof T,Jebb S,Livingstone B,Lluch A,Mela D,Salah S,Schuring E,van der Knaap H,et al. . Appetite control: methodological aspects of the evaluation of foods.Obes Rev 2010;11:251–70. [DOI] [PMC free article] [PubMed] [Google Scholar]