Abstract
Objectives
Larval indices have been used for Ae. albopictus surveillance for many years, while there is limited use in assessing dengue transmission risk and adult mosquito emergence. This study is aimed to explore the relationships between larval indices and the Ae. albopictus density captured by BG-mosquito trap (BG-trap) method, with considering the meteorological factors.
Methods
Data on larval density, adult mosquito density and meteorology factors were collected in an entomological survey carried out in Quzhou City, Zhejiang Province of China in 2018. The Spearman’s rank correlation and Pearson correlation were used for the analysis on the correlation of density indices. Generalized additive models were established to analyze the influencing factors of mosquito density.
Results
Breteau index (BI), House index (HI) and Container index (CI) were highly correlated with each other (r>0.7, p<0.05). The Ae. albopictus density was significantly correlated with CI (rs = 0.260, p<0.05), CI pre one week (rs = 0.259, p<0.05), and CI pre three weeks (rs = 0.329, p<0.05). BI was correlated with female Ae. albopictus density pre 4 weeks (r = -0.299, p<0.05). Female Ae. albopictus density was correlated with CI pre 3 weeks (rs = 0.303, p<0.05). The influencing factors of BI were average wind speed pre 1 week, average temperature and female Ae. albopictus density pre 4 weeks. The influencing factors of CI were average humidity pre 3 weeks and average temperature. The influencing factors of HI were average temperature and precipitation pre 4 weeks. The influencing factor of Ae. albopictus density and female Ae. albopictus density was temperature.
Conclusions
The adult Ae. albopictus density had low correlation with certain larval indices. Some of the meteorology factors played significant roles in the density of adult Ae. albopictus and larva with or without a time lag.
Introduction
Aedes albopictus (Skuse), the Asian tiger mosquito, is one of the most invasive insect species in the world with substantial biting activity and high disease vector potential [1]. Aedes albopictus is originally from East Asia and the islands of the Pacific and Indian Ocean, and now can be found in all continents except for Antarctica [2]. Worldwide, in over 100 countries of the tropics and subtropics, dengue fever is mainly transmitted by Ae. aegypti and Ae. albopictus [3–4]. It is estimated that there are 390 million dengue infections each year globally, and among which, 96 million can produce clinical disease, leading to heavy disease burden [5]. Ae. albopictus plays a crucial role in the transmission and reservation of dengue virus, not only because dengue virus can circulate in a horizontal transmission (human-mosquito-human), but also it can be transmitted vertically from adult mosquito to offspring [6], which is considered to be a coping mechanism to maintain the virus level under adverse conditions. In the absence of vaccinations and effective drugs, the prevention and control of dengue fever are still focused on the elimination of the mosquito populations [7–8]. From this perspective, developing appropriate strategies to monitor and control the Ae. albopictus populations should be a priority.
The BG-mosquito trap (BG-trap), which mimics convection currents created by human bodies and releases attractants through a large surface area, can catch significantly more Ae. albopictus than the Center for Disease Control and Prevention (CDC) light trap and Fay-Prince traps in laboratory settings and field trials [9–10]. Besides, BG-trap is not subjected to the ethical problems of the human landing catch methods, and has a higher efficiency than the human-baited double net trap [11–12]. Since BG-trap is an effective method in monitoring adult Ae. albopictus, until now, there are no thresholds of the BG-trap that can be served either as reference to determine the timing and intensity of control activities or as a surrogate of dengue transmission risk. The larval indices such as Breteau index (BI), House index (HI) and Container index (CI), are considered more qualitative and often used in Ae. albopictus density assessment in dengue control [13]. Especially the BI, establishing a relationship between positive containers and houses, is considered the best indices for predicting dengue fever risk [7]. However, incongruences have been found between those larval indices, with the facts that they are limited used in assessing dengue transmission risk and have a poor proxy for measuring adult mosquito emergence [14]. Studies have found that the larval indices are not in accordance with one another or with adult mosquito infestation [13–14], and the strength of correlations between larva and adult populations may depend on season, year, or geographic location [7]. Nevertheless, the relationships of larval indices with adult Ae. albopictus collected by the BG-trap are still uncertain, and more research is needed to confirm.
Based on previous reports, some meteorological features such as temperature, precipitation and humidity significantly influence the development, as well as survival, density and oviposition rate of mosquito [15–17], which have been found to be associated with dengue fever [18–19]. Among the meteorological features, temperature is considered the main fixed factor driving mosquito development rate, to the exclusion of other factors of known importance such as diet and density [20–21]. Dengue transmission cannot be explained by mosquito density alone, while infection rates and meteorological features should also be considered [15, 22].
In 2018, an entomological survey was carried out in the Quzhou City, Zhejiang Province of China, which provided us an opportunity to study the relationships between traditional larval indices and the adult mosquito density monitored by the BG-trap, with considering the meteorological features.
Materials and methods
Study sites and field work
This study was conducted in Quzhou City, Zhejiang Province, located in Southeast China. Considering the aspects of environment, coordination and operability, the Chongwen village (28°53’46.68”N, 118°54’44.02”E) and Songyuan village (28°55’0.37”N, 118°54’15.57”E) exhibited good representatives of the general rural areas in Zhejiang Province and were selected as the study sites. Besides, no major epidemics of dengue fever have occurred in this area during the study period, which could minimize the mosquito density fluctuation for dengue controlling. The study was conducted from April 26 to November 23, 2018 and lasted for 31 weeks. The larval density was monitored in about 50 households every week in Chongwen and Songyuan village, respectively. Trained field workers inspected and recorded household water containers and collected any pupae or larvae present for entomological examination. The water containers included any container with water in or around the households, such as flower pots, water storage containers, idle containers, waste tyres, garbage, rockery pool, open channel, bamboo or tree holes, stone holes, standing water in basement and parking lot, etc. A container was considered positive if it contained at least one larva or pupa.
The BG-trap (model: BG-Mosquitaire CO2, Biogents AG, Germany) baited with a steel cylinder filled with CO2 emitted at a rate of 500g/24h. The trap was placed on the ground, the BG-Lure (Biogents AG, Germany) was placed in the pocket designated for the lure inside the trap, and the steel cylinder was set next to the trap. Each village placed three BG-traps at the peak time of Ae. albopictus with more than 200 meters away from each other, and lasted half an hour. All the captured mosquitoes were collected, and the species were identified morphologically.
The larval density and the adult mosquito density were defined as follows [7]. HI: the percentage of houses with containers positive for Ae. albopictus larvae. CI: the percentage of water-holding containers infested with Ae. albopictus larvae. BI: the number of positive containers per 100 houses inspected. The Ae. albopictus density: the number of Ae. albopictus including male and female trapped per trap in one hour. The female Ae. albopictus density: the number of female Ae. albopictus trapped per trap in one hour. Our filed work has been approved by the ethics committee of Zhejiang Provincial Center for Disease Control and Prevention (CDC). The ethics committee approved the procedure for verbal consent because Zhejiang CDC has the authority of the Zhejiang provincial government to collect the related information, which is part of the disease surveillance work in Zhejiang CDC. All the households were notified that they have the right to refuse or terminate the study at any point. Because we obtained verbal consent, documentation of consent was not required. However, the information collected from each household was kept confidential in Zhejiang CDC.
Meteorological data
The daily meteorological data were collected from National Meteorological Science Data Center, which included precipitation (0.1mm), average air pressure (0.1hpa), average humidity (1%), sunshine hours (0.1h), average temperature(0.1°C), and average wind speed (0.1m/s), etc.
Statistical analyses
The statistical analyses were conducted with Statistical Program for Social Sciences 21.0 software (SPSS, Inc., Chicago, IL, USA) and R 3.6.2 software (The R Foundation for Statistical Computing Platform). A value of P<0.05 was considered as statistically significant. All the parameters were tested for normality. The Spearman’s rank correlation and Pearson correlation with or without time-lag were used to analyze the correlation of the larval density, the adult mosquito density and the meteorological factors according to the data distribution. Generalized additive model (GAM) was used to analyze the influencing factors of the mosquito density.
Results
The general description of the water containers
A total of 3109 households were investigated in the study, of which 1491 households had positive water containers, with a positive rate of 47.96%. 8911 water containers were inspected, 3350 was positive and the positive rate was 37.59%. In the positive containers, the highest percentage was seen in Ae. albopictus (2682, 80.06%), and followed by Culex pipiens pallens (631, 18.84%) and Armigeres obturbans (37, 1.10%). The BI ranged from 20.00 to 223.53 and the mean value of the two villages was 86.25. The mean value of CI was 30.46%, ranging from 5.52% to 66.13%. The mean value of HI was 42.79%, ranging from 18.00% to 76.00%.
Among all the water containers, the highest proportion was idle containers (6991, 78.45%), and followed by water storage containers (1510, 16.95%). Among different water containers, the highest positive rate was from tire water (48.34%), and followed by garbage water (47.62%) (Table 1).
Table 1. Water containers inspected in Chongwen and Songyuan village.
| Chongwen | Songyuan | Total | ||
|---|---|---|---|---|
| Flower pots | N | 120 | 41 | 161 |
| n | 30 | 21 | 51 | |
| Positive rate n/N (%) | 25.00 | 51.22 | 31.68 | |
| Water storage containers | N | 926 | 584 | 1510 |
| n | 275 | 280 | 555 | |
| Positive rate n/N (%) | 29.70 | 47.95 | 36.75 | |
| Idle containers | N | 3527 | 3464 | 6991 |
| n | 1256 | 1374 | 2630 | |
| Positive rate n/N (%) | 35.61 | 39.67 | 37.62 | |
| Waste tyres | N | 131 | 80 | 211 |
| n | 78 | 24 | 102 | |
| Positive rate n/N (%) | 59.54 | 30.00 | 48.34 | |
| Garbage | N | 12 | 9 | 21 |
| n | 3 | 7 | 10 | |
| Positive rate n/N (%) | 25.00 | 77.78 | 47.62 | |
| Other containers | N | 12 | 5 | 17 |
| n | 0 | 2 | 2 | |
| Positive rate n/N (%) | 0.00 | 40.00 | 11.76 | |
| Total water containers | N | 4728 | 4183 | 8911 |
| n | 1642 | 1708 | 3350 | |
| Positive rate n/N (%) | 34.73 | 40.83 | 37.59 |
N: Number of water containers inspected.
n: Number of positive water containers.
Adult mosquitoes captured by BG-traps
A total of 680 adult mosquitoes were captured by BG-traps, including 586 (86.18%) Ae. albopictus, 86 (12.65%) Ar. obturbans, and 8 (1.18%) Culex pipiens pallens. Of all the Ae. albopictus, 483 (82.42%) were females, and 103 (17.58%) were males. In Chongwen and Songyuan village, 438 and 242 adult mosquitoes were captured, accounting for 64.41% and 35.59%, respectively.
Correlation between larval density and adult mosquito density
The correlation between the larval density and the adult mosquito density of Ae. albopictus was analyzed. Considering the possible effect of time lag, 1~4 weeks were selected as the lag effect period. The Ae. albopictus density was correlated with CI (rs = 0.260, p = 0.041), CI pre 1 week (rs = 0.259, p = 0.046), and CI pre 3 weeks (rs = 0.329, p = 0.013). BI was correlated with female Ae. albopictus density pre 4 weeks (r = -0.299, p = 0.028). Female Ae. albopictus density was correlated with CI pre 3 weeks (rs = 0.303, p = 0.023). The three indices of larval density were highly correlated with each other (the r for BI and CI was 0.741, for BI and HI was 0.916, for CI and HI was 0.753, respectively, P<0.05), and were also correlated with a lag effect of 1~4weeks, with correlation coefficients decreased gradually over time.
Correlations between mosquito density and meteorological factors
The correlation analysis was carried out to explore the relationships between meteorological factors and mosquito density, and 1~4 weeks was selected as the lag effect period. The results showed that the meteorological factors such as precipitation, average air pressure, average humidity, sunshine hours, average temperature, and average wind speed were correlated with different indices of the mosquito density, with or without a lag effect. The significant parameters of the correlation were shown in Table 2.
Table 2. The correlations between the mosquito density and the meteorological factors.
| BI | CI | HI | Ae. albopictus (male and female) | Ae. albopictus (female) | ||||||
|---|---|---|---|---|---|---|---|---|---|---|
| r/rs | P | r/rs | P | r/rs | P | rs | P | rs | P | |
| Average air pressure | -0.424* | 0.001 | -0.650* | <0.001 | -0.448* | <0.001 | -0.535 | <0.001 | -0.516 | <0.001 |
| Average temperature | 0.354* | 0.005 | 0.622* | <0.001 | 0.418* | 0.001 | 0.561 | <0.001 | 0.531 | <0.001 |
| Precipitation pre 1week | 0.329 | 0.009 | — | — | 0.277 | 0.029 | — | — | — | — |
| Average air pressure pre 1 week | -0.392* | 0.002 | -0.577* | <0.001 | -0.445* | <0.001 | -0.554 | <0.001 | -0.534 | <0.001 |
| Sunshine hours pre 1 week | — | — | — | — | — | — | 0.441 | <0.001 | 0.427 | <0.001 |
| Average temperature pre 1 week | 0.270* | 0.034 | 0.548* | <0.001 | 0.352* | 0.005 | 0.581 | <0.001 | 0.563 | <0.001 |
| Average wind speed pre1 week | -0.264* | 0.038 | — | — | — | — | 0.278 | 0.029 | 0.275 | 0.030 |
| Precipitation pre 2 weeks | 0.445 | <0.001 | — | — | 0.417 | 0.001 | — | — | — | — |
| Average air pressure pre 2 weeks | -0.336* | 0.008 | -0.529* | <0.001 | -0.416* | 0.001 | -0.552 | <0.001 | -0.540 | <0.001 |
| Sunshine hours pre 2 weeks | — | — | — | — | — | — | 0.351 | 0.005 | 0.389 | 0.002 |
| Average temperature pre 2 weeks | — | — | 0.521* | <0.001 | 0.272* | 0.032 | 0.619 | <0.001 | 0.629 | <0.001 |
| Average wind speed pre 2 weeks | — | — | — | — | — | — | — | — | 0.278 | 0.029 |
| Precipitation pre 3 weeks | 0.484 | <0.001 | 0.435 | <0.001 | 0.463 | <0.001 | — | — | — | — |
| Average air pressure pre 3 weeks | -0.273* | 0.032 | -0.556* | <0.001 | -0.383* | 0.002 | -0.567 | <0.001 | -0.551 | <0.001 |
| Average humidity pre 3 weeks | — | — | 0.369* | 0.003 | — | — | — | — | — | — |
| Sunshine hours pre 3 weeks | — | — | — | — | — | — | 0.333 | 0.008 | 0.350 | 0.005 |
| Average temperature pre 3 weeks | — | — | 0.442* | <0.001 | — | — | 0.595 | <0.001 | 0.589 | <0.001 |
| Average wind speed pre 3 weeks | — | — | — | — | — | — | — | — | 0.256 | 0.045 |
| Precipitation pre 4 weeks | 0.583 | <0.001 | 0.400 | 0.001 | 0.561 | <0.001 | — | — | — | — |
| Average air pressure pre 4 weeks | — | — | -0.490* | <0.001 | — | — | -0.606 | <0.001 | -0.609 | <0.001 |
| Average humidity pre 4 weeks | — | — | 0.252* | 0.048 | — | — | — | — | — | — |
| Average temperature pre 4 weeks | — | — | 0.363* | 0.004 | — | — | 0.607 | <0.001 | 0.621 | <0.001 |
All the parameters listed in Table 2 were significant (P<0.05).
*Stands for r (the correlation coefficient of the Pearson correlation), and the rest values were rs (the correlation coefficient of the Spearman’s rank correlation).
The results of the GAM models
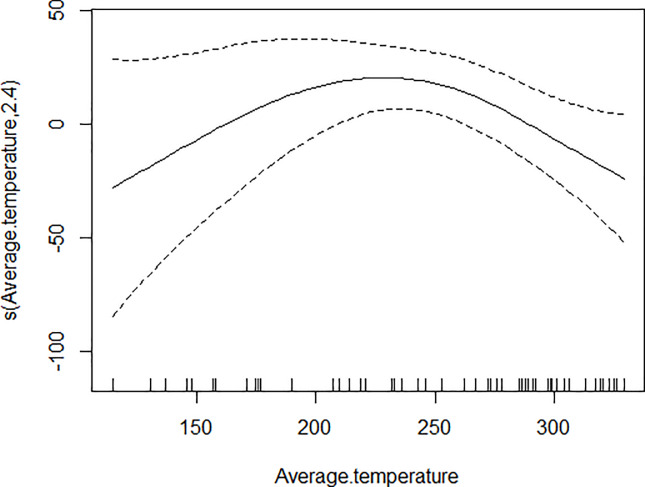
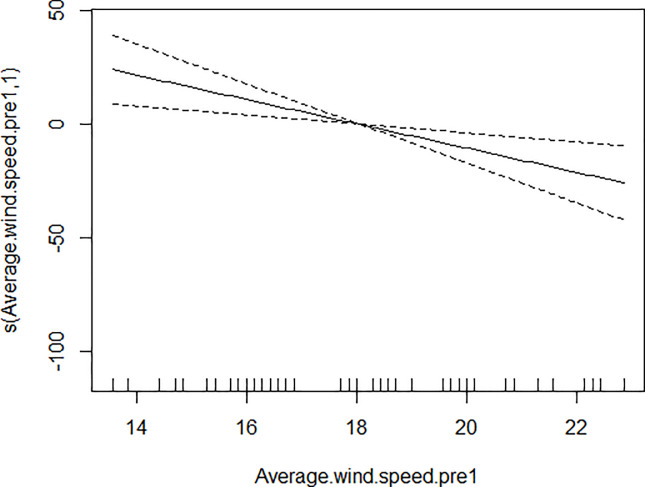
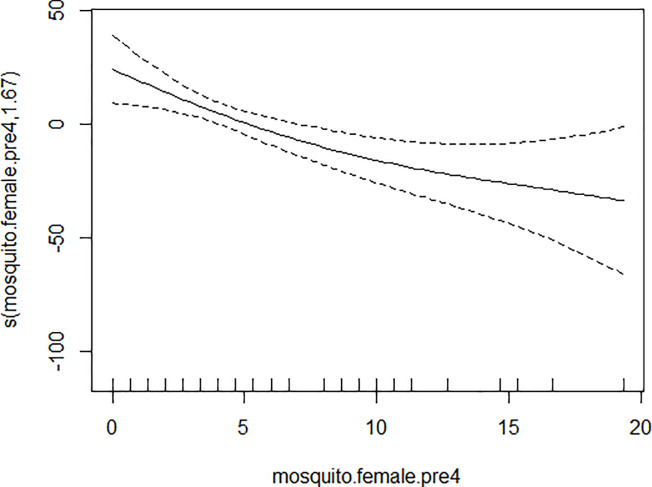
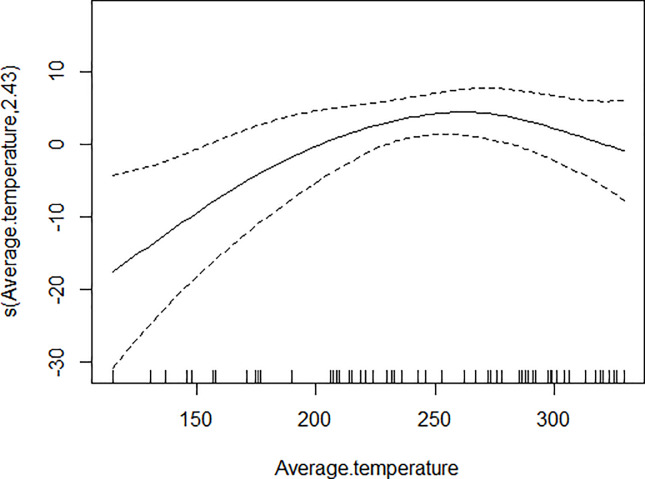
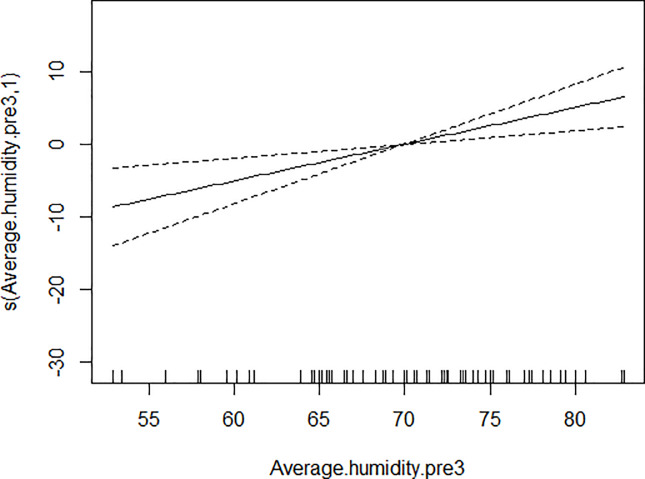
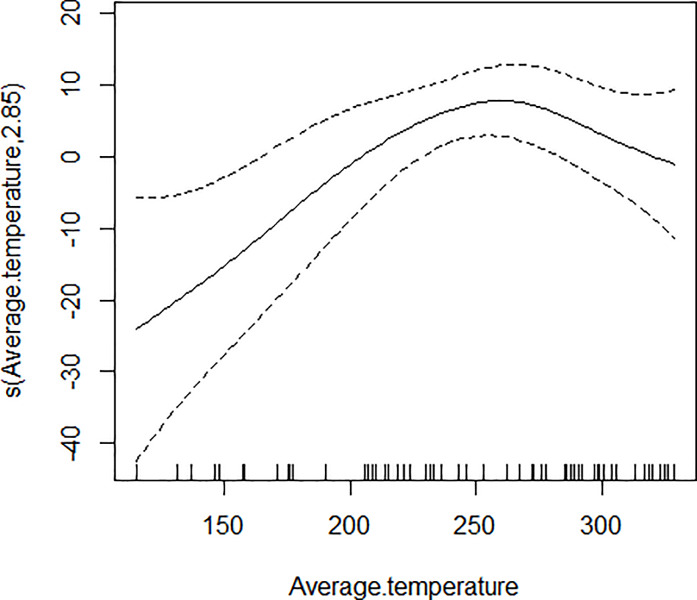
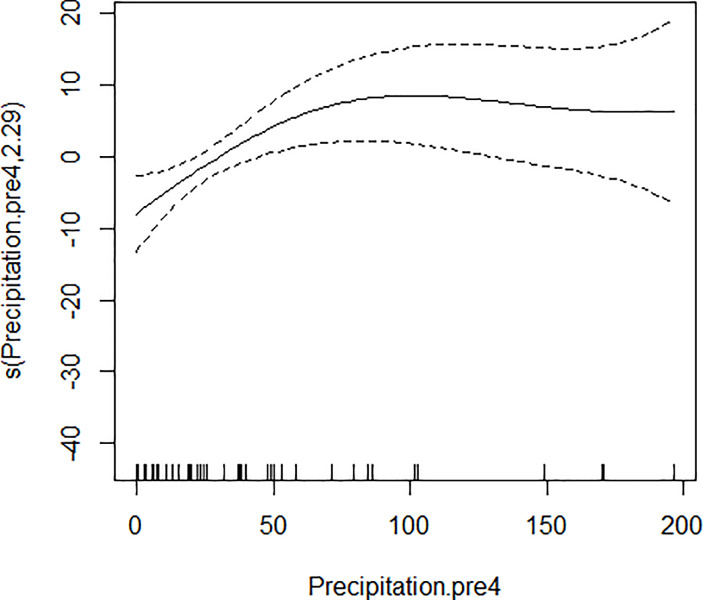
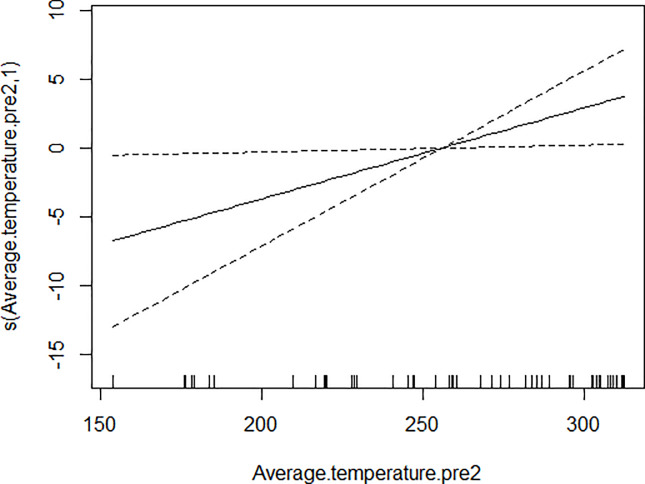
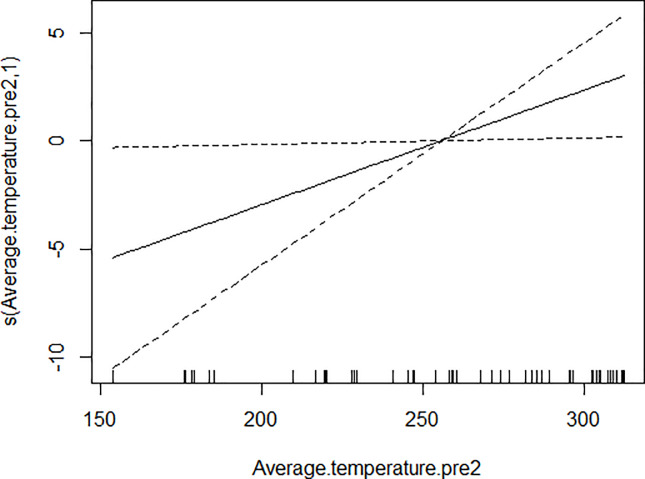
GAM models were used to analyze the influencing factors related to different density indices of Ae. albopictus. The significant variables in the correlation analysis were included in the models, and the best effect time of the same variable was selected with the highest correlation coefficient. Although there were high correlation among BI, CI and HI, they were different aspects of the larval density, and consequently the three indices were not included in the model of each other. As shown in Table 3, BI was significantly associated with average temperature, average wind speed pre 1 week and female Ae. albopictus density pre 4 weeks. BI increased to a peak value first, and then decreased with the increasing of the average temperature (Fig 1), decreased with the increasing of the average wind speed pre 1 week straightly (Fig 2), and decreased smoothly with the increasing of the female Ae. albopictus density pre 4 weeks (Fig 3). CI was significantly associated with average temperature and average humidity pre 3 weeks. CI increased to a peak value first, and then decreased with the increasing of the average temperature (Fig 4), and increased straightly with the increasing of the average humidity pre 3 weeks (Fig 5). HI was significantly associated with average temperature and precipitation pre 4 weeks. The relationship between HI and the temperature was similar to those with BI and CI (Fig 6), and with the increase of precipitation 4 week ago, HI increased first, then reached a plateau period (Fig 7). The Ae. albopictus density or female Ae. albopictus density had linear relationship with the average temperature with a time lag of two weeks (Figs 8 and 9).
Table 3. The results of GAM.
| Outcomes | Variables | Edf | Linear | β | F/t | P | |
|---|---|---|---|---|---|---|---|
| BI | Intercept | — | — | 174.789 | 31.467 | 5.555 | <0.001 |
| Average air pressure | 2.994 | No | — | — | 2.258* | 0.082 | |
| Average wind speed pre1 week | 1.000 | Yes | -5.341 | 1.692 | -3.157 | 0.003 | |
| Average temperature | 2.405 | No | — | — | 3.707* | 0.018 | |
| Precipitation pre 4 weeks | 1.000 | Yes | 0.070 | 0.090 | 0.780 | 0.440 | |
| Female Ae. albopictus pre 4 weeks | 1.670 | No | — | — | 6.767* | 0.003 | |
| CI | Intercept | — | — | 567.478 | 295.566 | 1.920 | 0.060 |
| Average air pressure | 1.000 | Yes | -0.057 | 0.029 | -1.944 | 0.057 | |
| Precipitation pre 3 weeks | 1.000 | Yes | 0.031 | 0.025 | 1.242 | 0.220 | |
| Average humidity pre 3 weeks | 1.000 | Yes | 0.507 | 0.158 | 3.210 | 0.002 | |
| Average temperature | 2.433 | No | — | — | 4.449* | 0.007 | |
| Ae. albopictus | 2.582 | No | — | — | 1.188* | 0.331 | |
| HI | Intercept | — | — | -91.525 | 470.295 | -0.195 | 0.846 |
| Average air pressure | 1.000 | Yes | 0.013 | 0.047 | 0.286 | 0.776 | |
| Average temperature | 2.848 | No | — | — | 4.504* | 0.005 | |
| Precipitation pre 4 weeks | 2.292 | No | — | — | 3.736* | 0.020 | |
| Ae. albopictus | Intercept | — | — | -11.696 | 10.060 | -1.163 | 0.252 |
| Average temperature pre 2 weeks | 1.000 | Yes | 0.066 | 0.031 | 2.144 | 0.038 | |
| Average wind speed pre 1 week | 1.000 | Yes | 0.127 | 0.341 | 0.372 | 0.712 | |
| Average air pressure pre 4 weeks | 4.022 | No | — | — | 2.214* | 0.072 | |
| Sunshine hours pre 1 week | 5.504 | No | — | — | 1.238* | 0.312 | |
| CI pre3 | 1.000 | Yes | -0.024 | 0.069 | -0.344 | 0.733 | |
| Female Ae. albopictus | Intercept | — | — | -6.075 | 6.596 | -0.921 | 0.362 |
| Average temperature pre 2 weeks | 1.000 | Yes | 0.054 | 0.025 | 2.154 | 0.036 | |
| Average wind speed pre 2 weeks | 2.153 | No | — | — | 0.906* | 0.573 | |
| Average air pressure pre 4 weeks | 2.887 | No | — | — | 1.036* | 0.496 | |
| Sunshine hours pre 1 week | 1.000 | Yes | -0.006 | 0.024 | -0.252 | 0.802 | |
| CI pre 3 weeks | 1.000 | Yes | -0.058 | 0.054 | -1.071 | 0.290 |
Edf: degree of freedom. Linear: a linear relationship.β: regression coefficient. : standard error of mean.
F/t: the results of ANOVA / T test. P: Probability.
*Stands for the ANOVA results.
Fig 1. The relationship between BI and average temperature.
Fig 2. The relationship between BI and average wind speed pre 1 week.
Fig 3. The relationship between BI and female Ae. albopictus density pre 4 weeks.
Fig 4. The relationship between CI and average temperature.
Fig 5. The relationship between CI and average humidity pre 3 weeks.
Fig 6. The relationship between HI and average temperature.
Fig 7. The relationship between HI and precipitation pre 4 weeks.
Fig 8. The relationship between Ae. albopictus density and average temperature pre 2 weeks.
Fig 9. The relationship between female Ae. albopictus density and average temperature pre 2 weeks.
Discussion
In the field survey, we found that the Ae. albopictus density had low correlation with CI or with a time lag of one or three weeks. BI had correlation with female Ae. albopictus density with a time lag of 4 weeks. The average temperature, precipitation, average humidity, and average wind speed played significant roles in the density of adult mosquito or larva with or without a time lag.
BI is considered as a decision making parameter for mosquito control and dengue epidemic risk. Generally, the BI value of 5 serves as the lowest threshold. In a scenario where the BI value > 5 with reported dengue cases or BI > 20 even without any dengue case, control measures should be taken [18]. Three different risks of HI, with <0.1% as low, 0.1–5% as medium and >5% as high, were suggested by the Pan American Health Organization to prevent dengue transmission [23]. As for CI, one study found that 11.7 was the optimal cut-off value for discriminating outbreaks of dengue [24]. In this study, we found the average BI value was extremely high (86.25) in two villages, and similar values were also seen in HI (42.79%) and CI (30.46%). Although reasons for the high estimates in our study were complicated, there was possible explanation with respect to the breeding place for Ae. albopictus. As the Ae. albopictus generally breed in artificial water containers, any type of water-holding container with clean water would be a good larval habitat [3, 8]. The two villages investigated in this study had good sanitation conditions, and vegetation was abundant in and around the villages. Besides, considerable idle containers and water cisterns with clean water were put in or around the yard (accounting for 95.4% of the total number of water containers), which would provide perfect breeding place for Ae. albopictus. Furthermore, consistent with a previous study [16], the positive rate for Aedes larval was found to be higher in discarded tires.
As for adult Ae. albopictus monitoring, an effective trap would be less intrusive, labor saving, and more comprehensive coverage with an effective lure or attractant. The BG-trap, using CO2 and the BG-lure to capture host-seeking female mosquitoes, is an effective mosquito monitoring method. Our entomological survey was conducted at the peak period of Ae. albopictus density [25], which were representative to a certain extent. The results showed that 86.18% of the adult mosquitoes captured by BG-traps were Ae. albopictus, indicating that the BG-traps were sensitive for Ae. albopictus. Consistent with a previous study [9], the BG-traps were more effective in capturing female rather than male Ae. Albopictus (82.42% vs. 17.58%).
The thresholds of the classical larval indices for management of dengue epidemics were considered to be less effective and sometimes remained poor in predicting adult emergence [18]. Measuring adult mosquito density was the most representative quantitative estimate to obtain data about mosquito abundance, as larva needed to go through several developmental stages to become adult mosquitoes before they could transmit dengue virus [26]. Study had found that the household larval surveys and trap based surveillance systems were not interchangeable approaches [27]. In our study, the Ae. albopictus density and female Ae. albopictus density were calculated as two indices and the results were not exactly the same. The Ae. albopictus density, contained all the captured Ae. albopictus including male and female, while the female Ae. albopictus density, calculated the female Ae. albopictus only. The correlation analysis indicated that the two indices all were slightly correlated with CI with a certain time lag. While the female Ae. albopictus density pre 4 weeks was negatively correlated with BI, which was consistent with the results of the GAM model but contrary to our common sense. As only female Ae. albopictus was responsible for disease transmission, the indices would be more appropriate towards female mosquitoes directly. One interesting phenomenon found in our study was that, when the BG-traps were put in the grass or small bamboo grove, more mosquitoes would be caught and most of them were male. These findings may lead to bias of the result for different sites the traps placed, and the different emergence time of the male and female mosquito [9]. Consequently, regarding the correlation between the larval and adult mosquito density, it would be more appropriate towards Ae. albopictus density than female Ae. albopictus density.
Climatic factors, particularly the temperature, precipitation and humidity, could directly and indirectly affect the mosquito density and blood feeding behavior [8, 28–29]. In our study, the average temperature was the main influencing factor of the mosquito density, affecting all the study indices. Temperature is crucial for mosquitoes, not only for survival rate but also the lifecycle of the vector including oviposition, hatching, pupation, and emergence processes [16, 30–31]. Higher temperature could reduce the development time of mosquitoes, and increase the propagation speed of the virus [32–34]. Consistent with the above study, our results showed that the adult mosquito density increased straightly with the increase of the average temperature pre two weeks. Studies also found that the effects of temperature on the mortality rate of larvae, pupae and adult mosquitoes could be U-shaped with a lower mortality rate was seen when temperature ranged from 15 to 30°C [20–21, 35]. This probably explained the decrease of the BI, CI and HI from the peak value along with the increase of the average temperature in our study.
Precipitation played a crucial role in the transmission of mosquito borne diseases, due to the fact that mosquito required water for the aquatic larval and pupal breeding stages. Higher pupal productivity and entomological indices was found in the rainy season than dry season [3, 16, 26], and the effect of the precipitation to the larval density may have a time lag from 2 months to 1 month [33]. Precipitation could also influence the adult mosquito capturing. One study found that the BGS traps consistently captured nearly 20% of the marked female Aedes population in the wet season and about 30% in the hot and dry season [36]. Besides, BGS traps could increase the biting rate of mosquito via increasing the contact between humans and mosquitoes, as humans often stayed indoors when it rained [4]. Based on our results, with the increase of precipitation 4 weeks ago, HI increased at the beginning, and then reached a plateau period. Less precipitation reduced amount of water retained in containers which affect mosquito breeding. However, extremely heavy precipitation could lead to water containers saturation or even flush mosquito larvae away from breeding sites, eliminating habitats to decrease the vector population [26], which possible explained the plateaus of HI.
Relative humidity was an important meteorological factor in the life-cycle of mosquitoes [15], especially in lowland plains [16]. Humidity could also increase the transmission rate of human dengue fever infection in the context of imported dengue cases and mosquito density [4, 30]. Relative humidity could affect larvae density by affecting adult mosquito survival, and also had a synergistic effect with the temperature [17]. While in our GAM models, CI increased with the rise of the average humidity pre 3 weeks. The wind speed could influence the effectiveness of the daily captures of mosquitoes [37]. Yin Q et al. suggested that the predicted hourly Ae. albopictus densities generally decreased with wind speed [25]. Endo N et al. found that wind direction and speed could influence the malaria vector populations by affecting the effect of CO2 attraction and enable mosquitoes to identify village location [38]. In our models, the average wind speed was negatively correlated with BI and with one week lag effect. Higher wind speed may affect the dynamics of the mosquito population by affecting wave activity, advection of adult mosquitoes, and CO2 attraction, resulting in a low density of larvae after a period of time.
Our study had several strengths. This is one of the few studies investigating the relationships between larval indices and the adult mosquito with BG-trap method in mainland China. Besides, during the analysis procedure, various meteorological factors were taken into consideration in our study. Meanwhile, some limitations must be recognized in this study. Firstly, as the study sites and samples were only selected from rural area of Zhejiang Province, our results cannot be generalisable to broader national level. Secondly, the study relationships may be confounded by other factors such as socio-economic characteristics and human activity, which were not included in the current analysis.
Conclusions
Our findings suggested that the BG-trap was an effective adult trap for Ae. albopictus, especially for the female mosquitoes. The adult Ae. albopictus density was slightly correlated with certain larval indices. The average temperature, precipitation, average humidity, and average wind speed played significant roles in the density of adult mosquito or larva with or without a time lag. To prevent dengue fever, new monitoring method and thresholds should be developed based on adult mosquitoes, with considering meteorological factors.
Supporting information
(XLS)
Acknowledgments
We thank all the colleagues from Zhejiang CDC and Quzhou CDC participated in the study for their important contributions.
Data Availability
All relevant data are within the paper and its Supporting Information files.
Funding Statement
This work was supported by grant from the National Critical Project for Science and Technology on Infectious Diseases of China (no. 2017ZX10303404) and the grant receiver was ZYG. The funder had no role in study design, data collection and analysis, decision to publish, or preparation of the manuscript.
References
- 1.Crepeau TN, Healy SP, Bartlett-Healy K, Unlu I, Farajollahi A, Fonseca DM. Effects of Biogents Sentinel Trap field placement on capture rates of adult Asian tiger mosquitoes, Aedes albopictus. PLoS One. 2013; 8(3): e60524 10.1371/journal.pone.0060524 [DOI] [PMC free article] [PubMed] [Google Scholar]
- 2.Bonizzoni M, Gasperi G, Chen X, James AA. The invasive mosquito species Aedes albopictus: current knowledge and future perspectives. Trends Parasitol. 2013; 29(9): 460–8. 10.1016/j.pt.2013.07.003 [DOI] [PMC free article] [PubMed] [Google Scholar]
- 3.Jiménez-Alejo A, Morales-Pérez A, Nava-Aguilera E, et al. Pupal productivity in rainy and dry seasons: findings from the impact survey of a randomised controlled trial of dengue prevention in Guerrero, Mexico. BMC Public Health. 2017; 17(Suppl 1): 428 10.1186/s12889-017-4294-8 [DOI] [PMC free article] [PubMed] [Google Scholar]
- 4.Sang S, Yin W, Bi P, et al. Predicting local dengue transmission in Guangzhou, China, through the influence of imported cases, mosquito density and climate variability. PLoS One. 2014; 9 (7): e102755 10.1371/journal.pone.0102755 [DOI] [PMC free article] [PubMed] [Google Scholar]
- 5.Bhatt S, Gething PW, Brady OJ, et al. The global distribution and burden of dengue. Nature. 2013; 496(7446): 504–7. 10.1038/nature12060 [DOI] [PMC free article] [PubMed] [Google Scholar]
- 6.Lequime S, Paul RE, Lambrechts L. Determinants of Arbovirus Vertical Transmission in Mosquitoes. PLoS Pathog. 2016; 12(5): e1005548 10.1371/journal.ppat.1005548 [DOI] [PMC free article] [PubMed] [Google Scholar]
- 7.Sivagnaname N, Gunasekaran K. Need for an efficient adult trap for the surveillance of dengue vectors. Indian J Med Res. 2012; 136 (5): 739–49. [PMC free article] [PubMed] [Google Scholar]
- 8.Estallo EL, Lamfri MA, Scavuzzo CM, et al. Models for predicting Aedes aegypti larval indices based on satellite images and climatic variables. J Am Mosq Control Assoc. 2008; 24 (3): 368–76. 10.2987/5705.1 [DOI] [PubMed] [Google Scholar]
- 9.Li Y, Su X, Zhou G, et al. Comparative evaluation of the efficiency of the BG-Sentinel trap, CDC light trap and Mosquito-oviposition trap for the surveillance of vector mosquitoes. Parasit Vectors. 2016; 9 (1): 446 10.1186/s13071-016-1724-x [DOI] [PMC free article] [PubMed] [Google Scholar]
- 10.Bhalala H, Arias JR. The Zumba mosquito trap and BG-Sentinel trap: novel surveillance tools for host-seeking mosquitoes. J Am Mosq Control Assoc. 2009; 25 (2): 134–9. 10.2987/08-5821.1 [DOI] [PubMed] [Google Scholar]
- 11.Urquhart C, Paulsen D, Moncayo A, Trout Fryxell RT. Evaluating Surveillance Methods for Arboviral Vectors of La Crosse Virus and West Nile Virus of Southern Appalachia. J Am Mosq Control Assoc. 2016; 32 (1): 24–33. 10.2987/8756-971X-32.1.24 [DOI] [PubMed] [Google Scholar]
- 12.Gao Q, Wang F, Lv X, et al. Comparison of the human-baited double net trap with the human landing catch for Aedes albopictus monitoring in Shanghai, China. Parasit Vectors. 2018; 11 (1): 483 10.1186/s13071-018-3053-8 [DOI] [PMC free article] [PubMed] [Google Scholar]
- 13.Manrique-Saide P, Coleman P, McCall PJ, Lenhart A, Vázquez-Prokopec G, Davies CR. Multi-scale analysis of the associations among egg, larval and pupal surveys and the presence and abundance of adult female Aedes aegypti (Stegomyia aegypti) in the city of Merida, Mexico. Med Vet Entomol. 2014; 28 (3): 264–72. 10.1111/mve.12046 [DOI] [PubMed] [Google Scholar]
- 14.Romero-Vivas CM, Falconar AK. Investigation of relationships between Aedes aegypti egg, larvae, pupae, and adult density indices where their main breeding sites were located indoors. J Am Mosq Control Assoc. 2005; 21 (1): 15–21. 10.2987/8756-971X(2005)21[15:IORBAA]2.0.CO;2 [DOI] [PubMed] [Google Scholar]
- 15.Peña-García VH, Triana-Chávez O, Mejía-Jaramillo AM, Díaz FJ, Gómez-Palacio A, Arboleda-Sánchez S. Infection Rates by Dengue Virus in Mosquitoes and the Influence of Temperature May Be Related to Different Endemicity Patterns in Three Colombian Cities. Int J Environ Res Public Health. 2016; 13 (5). pii: E734 10.3390/ijerph13070734 [DOI] [PMC free article] [PubMed] [Google Scholar]
- 16.Tuladhar R, Singh A, Banjara MR, et al. Effect of meteorological factors on the seasonal prevalence of dengue vectors in upland hilly and lowland Terai regions of Nepal. Parasit Vectors. 2019; 12 (1): 42 10.1186/s13071-019-3304-3 [DOI] [PMC free article] [PubMed] [Google Scholar]
- 17.Wijegunawardana NDAD, Gunawardene YINS, Chandrasena TGAN, Dassanayake RS, Udayanga NWBAL, Abeyewickreme W. Evaluation of the Effects of Aedes Vector Indices and Climatic Factors on Dengue Incidence in Gampaha District, Sri Lanka. Biomed Res Int. 2019; 2019: 2950216 10.1155/2019/2950216 [DOI] [PMC free article] [PubMed] [Google Scholar]
- 18.Udayanga L, Gunathilaka N, Iqbal MCM, Najim MMM, Pahalagedara K, Abeyewickreme W. Empirical optimization of risk thresholds for dengue: an approach towards entomological management of Aedes mosquitoes based on larval indices in the Kandy District of Sri Lanka. Parasit Vectors. 2018; 11 (1): 368 10.1186/s13071-018-2961-y [DOI] [PMC free article] [PubMed] [Google Scholar]
- 19.Shen JC, Luo L, Li L, et al. The Impacts of Mosquito Density and Meteorological Factors on Dengue Fever Epidemics in Guangzhou, China, 2006–2014: a Time-series Analysis. Biomed Environ Sci. 2015; 28 (5): 321–9. 10.3967/bes2015.046 [DOI] [PubMed] [Google Scholar]
- 20.Couret J, Dotson E, Benedict MQ. Temperature, larval diet, and density effects on development rate and survival of Aedes aegypti (Diptera: Culicidae). PLoS One. 2014; 9 (2): e87468 10.1371/journal.pone.0087468 [DOI] [PMC free article] [PubMed] [Google Scholar]
- 21.Couret J, Benedict MQ. A meta-analysis of the factors influencing development rate variation in Aedes aegypti (Diptera: Culicidae). BMC Ecol. 2014; 14: 3 10.1186/1472-6785-14-3 [DOI] [PMC free article] [PubMed] [Google Scholar]
- 22.Phuong LTD, Hanh TTT, Nam VS. Climate Variability and Dengue Hemorrhagic Fever in Ba Tri District, Ben Tre Province, Vietnam during 2004–2014. AIMS Public Health. 2016; 3 (4): 769–780. 10.3934/publichealth.2016.4.769 [DOI] [PMC free article] [PubMed] [Google Scholar]
- 23.Pan American Health Organization. Dengue and Dengue Hemorrhagic Fever in the Americas: guidelines for prevention and control. 1995; 116 (Available from https://iris.paho.org/handle/10665.2/40300 March, 2020) [Google Scholar]
- 24.Luo L, Li X, Xiao X, Xu Y, Huang M, Yang Z. Identification of Aedes albopictus larval index thresholds in the transmission of dengue in Guangzhou, China. J Vector Ecol. 2015; 40 (2): 240–6. 10.1111/jvec.12160 [DOI] [PubMed] [Google Scholar]
- 25.Yin Q, Li L, Guo X, et al. A field-based modeling study on ecological characterization of hourly host-seeking behavior and its associated climatic variables in Aedes albopictus. Parasit Vectors. 2019; 12 (1): 474 10.1186/s13071-019-3715-1 [DOI] [PMC free article] [PubMed] [Google Scholar]
- 26.Wijayanti SP, Sunaryo S, Suprihatin S, et al. Dengue in Java, Indonesia: Relevance of Mosquito Indices as Risk Predictors. PLoS Negl Trop Dis. 2016; 10 (3): e0004500 10.1371/journal.pntd.0004500 [DOI] [PMC free article] [PubMed] [Google Scholar]
- 27.Codeço CT, Lima AW, Araújo SC, et al. Surveillance of Aedes aegypti: comparison of house index with four alternative traps. PLoS Negl Trop Dis. 2015; 9 (2): e0003475 10.1371/journal.pntd.0003475 [DOI] [PMC free article] [PubMed] [Google Scholar]
- 28.Rivas AV, Defante R, Delai RM, et al. Building Infestation Index for Aedes aegypti and occurrence of dengue fever in the municipality of Foz do Iguaçu, Paraná, Brazil, from 2001 to 2016. Rev Soc Bras Med Trop. 2018; 51 (1): 71–76. 10.1590/0037-8682-0228-2017 [DOI] [PubMed] [Google Scholar]
- 29.Tsai CH, Chen TH, Lin C, Shu PY, Su CL, Teng HJ. The impact of temperature and Wolbachia infection on vector competence of potential dengue vectors Aedes aegypti and Aedes albopictus in the transmission of dengue virus serotype 1 in southern Taiwan. Parasit Vectors. 2017; 10 (1): 551 10.1186/s13071-017-2493-x [DOI] [PMC free article] [PubMed] [Google Scholar]
- 30.Chen SC, Liao CM, Chio CP, Chou HH, You SH, Cheng YH. Lagged temperature effect with mosquito transmission potential explains dengue variability in southern Taiwan: insights from a statistical analysis. Sci Total Environ. 2010; 408 (19): 4069–75. 10.1016/j.scitotenv.2010.05.021 [DOI] [PubMed] [Google Scholar]
- 31.Roiz D, Rosà R, Arnoldi D, Rizzoli A. Effects of temperature and rainfall on the activity and dynamics of host-seeking Aedes albopictus females in northern Italy. Vector Borne Zoonotic Dis. 2010; 10 (8): 811–6. 10.1089/vbz.2009.0098 [DOI] [PubMed] [Google Scholar]
- 32.Carrington LB, Simmons CP. Human to mosquito transmission of dengue viruses. Front Immunol. 2014; 5: 290 10.3389/fimmu.2014.00290 [DOI] [PMC free article] [PubMed] [Google Scholar]
- 33.Nagao Y, Thavara U, Chitnumsup P, Tawatsin A, Chansang C, Campbell-Lendrum D. Climatic and social risk factors for Aedes infestation in rural Thailand. Trop Med Int Health. 2003; 8 (7): 650–9. 10.1046/j.1365-3156.2003.01075.x [DOI] [PubMed] [Google Scholar]
- 34.Farjana T, Tuno N, Higa Y. Effects of temperature and diet on development and interspecies competition in Aedes aegypti and Aedes albopictus. Med Vet Entomol. 2012; 26 (2): 210–7. 10.1111/j.1365-2915.2011.00971.x [DOI] [PubMed] [Google Scholar]
- 35.Chang FS, Tseng YT, Hsu PS, Chen CD, Lian IeB, Chao DY. Re-assess Vector Indices Threshold as an Early Warning Tool for Predicting Dengue Epidemic in a Dengue Non-endemic Country. PLoS Negl Trop Dis. 2015; 9 (9): e0004043 10.1371/journal.pntd.0004043 [DOI] [PMC free article] [PubMed] [Google Scholar]
- 36.Johnson PH, Spitzauer V, Ritchie SA. Field sampling rate of BG-sentinel traps for Aedes aegypti (Diptera: Culicidae) in suburban Cairns, Australia. J Med Entomol. 2012; 49 (1): 29–34. 10.1603/me11116 [DOI] [PubMed] [Google Scholar]
- 37.Gouagna LC, Dehecq JS, Fontenille D, Dumont Y, Boyer S. Seasonal variation in size estimates of Aedes albopictus population based on standard mark-release-recapture experiments in an urban area on Reunion Island. Acta Trop. 2015; 143:89–96. 10.1016/j.actatropica.2014.12.011 [DOI] [PubMed] [Google Scholar]
- 38.Endo N, Eltahir EAB. Prevention of malaria transmission around reservoirs: an observational and modelling study on the effect of wind direction and village location. Lancet Planet Health. 2018; 2 (9): e406–e413. 10.1016/S2542-5196(18)30175-X [DOI] [PubMed] [Google Scholar]
Associated Data
This section collects any data citations, data availability statements, or supplementary materials included in this article.
Supplementary Materials
(XLS)
Data Availability Statement
All relevant data are within the paper and its Supporting Information files.


