Abstract
Single-molecule localization microscopy is a powerful tool for visualizing subcellular structures, interactions, and protein functions in biological research. However, inhomogeneous refractive indices inside cells and tissues distort the fluorescent signal emitted from single-molecule probes, which rapidly deteriorates resolution with increasing depth. We propose a method that enables the construction of an in situ 3D response of single emitters directly from single-molecule blinking datasets and therefore allows their locations to be pin-pointed with precision that achieves the Cramer-Rao lower bound and uncompromised fidelity. We demonstrate this method, named in situ PSF retrieval (INSPR), across a range of cellular and tissue architectures from mitochondrial networks and nuclear pores in mammalian cells, to amyloid β plaques and dendrites in brain tissues, and elastic fibers in developing cartilage of mice. This advancement expands the routine applicability of super-resolution microscopy from selected cellular targets near coverslips to intra- and extra-cellular targets deep inside tissues.
Editor’s summary
In situ PSF retrieval (INSPR) enables precise single molecule localization in 3D SMLM of whole cells and tissues. It directly determines PSF from a single molecule blinking dataset removing errors associated with sample induced aberrations.
Introduction
Super-resolution fluorescence microscopy techniques, such as stimulated emission depletion (STED) microscopy1, structured illumination microscopy (SIM)2, and single-molecule localization microscopy (SMLM)3–5, have overcome the diffraction barrier and provided unprecedented opportunities to observe cellular functions, interactions, and dynamics at the nanoscale level6–9. Specifically, SMLM (also known as PALM/STORM), as well as its three-dimensional (3D) counterpart10–15, utilizes photo-switchable/convertible dyes or proteins to allow detection and localization of isolated molecules with a precision as low as 5 nm in 3D6,9. The core of 3D SMLM is to infer the location of a single molecule inside the biological specimen from its emission pattern (i.e. point spread function, PSF). This inference process estimates the molecular position relying on a 3D PSF model, which describes the emission pattern with respect to its axial position within the specimen10,16–18. It is, therefore, imperative to obtain an accurate model that reflects the influence of instrument imperfections as well as sample-induced aberrations due to inhomogeneous refractive indices inside the sample.
To account for instrument imperfections or mismatched refractive indices between immersion oil and water-based imaging medium, current approaches rely on the PSF model or calibrations generated from fiducial markers along with their axial positions19–24. However, photons emitted from these fiducial markers never pass through the cell or tissue specimen. In contrast, photons emitted by single molecules inside the specimen are affected by the highly complex biological/optical environment and therefore are distorted in an unpredictable manner. To date, it is still challenging to obtain the underlying in situ PSF generated by single fluorescent probes within a biological specimen. As a result, accurate and precise single-molecule super-resolution 3D imaging in whole cells and tissues remains difficult25.
Here, we propose a method that enables the construction of an in situ PSF response directly from the obtained single-molecule dataset, which allows us to eliminate the PSF mismatch and the resulting imprecision in localization induced by both instrument imperfections and sample-induced aberrations. Retrieving 3D PSF models in situ allows for pin-pointing the positions of single molecules with improved accuracy and precision, and therefore, resolving the intra- and extra-cellular structures within whole-cell and tissue specimens with high resolution and fidelity.
Results
Basic principles of in situ PSF retrieval (INSPR)
We start with a single-molecule dataset, routinely obtained in 3D SMLM experiments. In this dataset, the emission patterns of single molecules can be regarded as random observations at various axial positions sampled from the 3D PSF that we want to retrieve. The key that links these acquired emission patterns to the in situ 3D PSF is the position of each single emitter, in particular, the axial position. This key, however, is missing.
We draw inspiration from the mathematical frameworks of expectation-maximization26 and k-means27 to retrieve the 3D PSF response in the presence of unobserved latent parameters – the axial and lateral positions of single molecules. Pupil function, representing the wave field at the pupil plane of the microscope, is used to describe the 3D PSF response at arbitrary axial positions. This in situ PSF retrieval method (referred as ‘INSPR’ hereafter) iteratively uses two separate steps, namely assignment and update, to build an in situ PSF model from a collection of single-molecule patterns (Fig. 1, Extended Data Fig. 1a, Supplementary Note 2.6). INSPR starts with an ideal PSF (i.e. a constant pupil) and then assigns each detected single-molecule pattern to a temporary axial position through its similarity with this ideal template. These axially assigned single-molecule patterns are subsequently grouped, aligned, and averaged to form a 3D PSF stack, which provides a new pupil estimation (an ‘update’ to the previous pupil) through phase retrieval28. This new pupil is then used in the next assignment step to generate an updated template. This process iterates until the retrieved model no longer changes.
Fig. 1. Concept of INSPR.
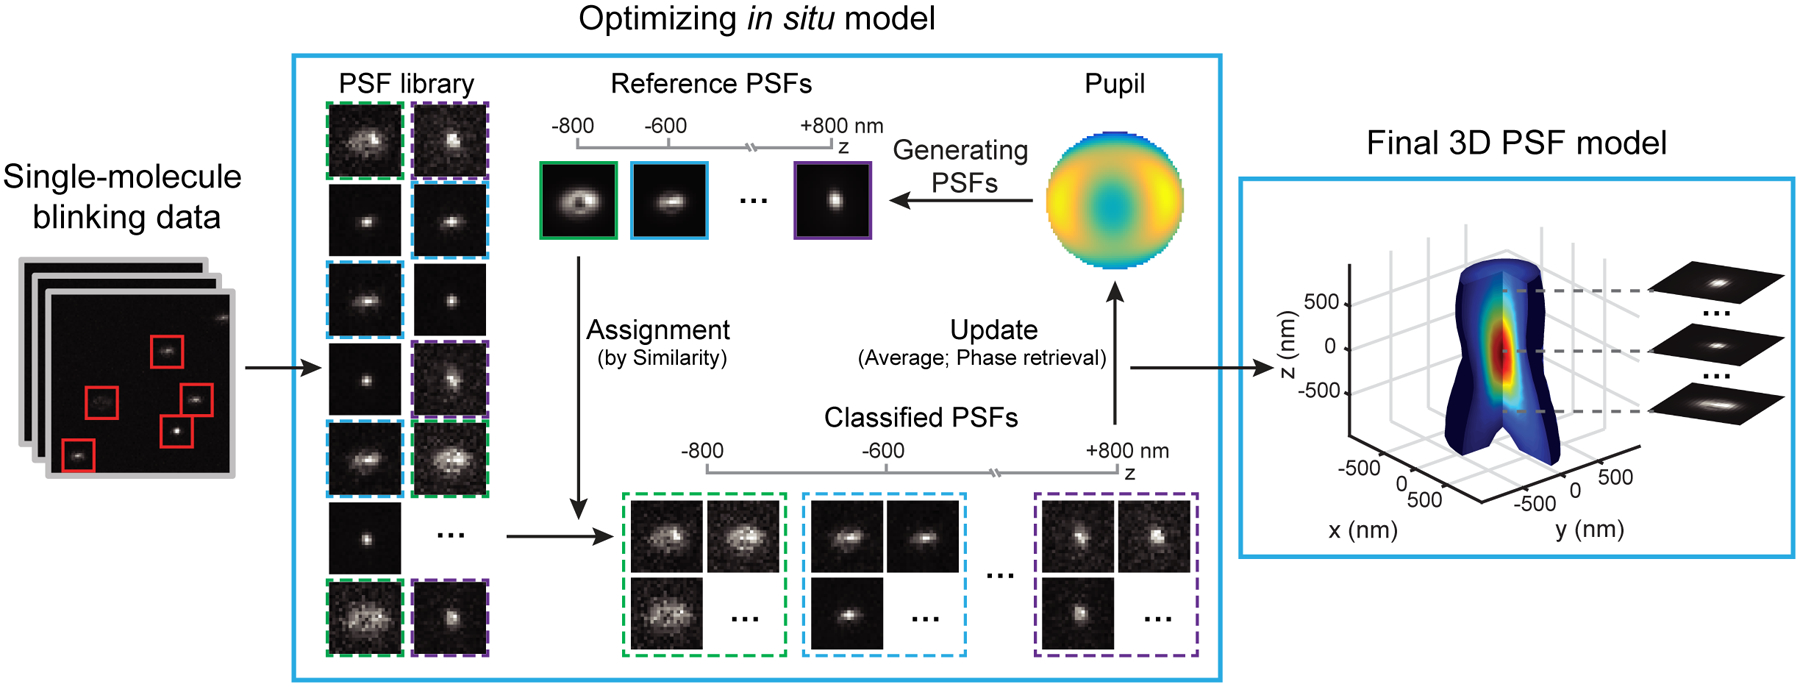
After the single-molecule dataset (left panel) is acquired, a PSF library is obtained. Starting with a constant pupil function, INSPR assigns each detected PSF to a temporary axial position according to its similarity with the template (assignment step, center panel). These axially-assigned PSFs are subsequently grouped, aligned, and averaged to form a 3D PSF stack, which is then used to provide a new pupil estimation through phase retrieval (update step, center panel). The new pupil is used in the next assignment step to generate an updated template. This process iterates until the retrieved 3D PSF model no longer changes, and a final model is obtained (right panel).
To build a unique in situ PSF model, the 3D single-molecule imaging modality must avoid degeneracies. Degeneracy appears when more than one wavefront shape, which describes the aberration introduced by the imaging system and the specimen, leads to the same emission pattern. For example, positive and negative vertical astigmatism aberrations will generate identical emission patterns at opposite axial positions (Extended Data Fig. 1c), making them impossible to be classified in the assignment step. We break up these degeneracies by using a biplane configuration10,29 (Extended Data Fig. 1f,g), where a pair of emission patterns from the same single molecule is detected at two axially separated planes (Extended Data Fig. 1d). By registering this pair of PSFs in the assignment step, we can retrieve the in situ 3D PSF without ambiguity (Supplementary Note 2.6). Besides, this approach can also be used in an astigmatism-based SMLM setup by providing prior knowledge of the astigmatism orientation, as demonstrated in both simulation and experimental datasets (Extended Data Figs. 1e, 3h–n, 4, 5, Supplementary Notes 1.3, 1.4, 3.5, Supplementary Video 2).
To pin-point single-molecule positions with high precision and minimum bias, we combine INSPR with a maximum likelihood estimator (MLE) that incorporates an sCMOS (scientific complementary metal-oxide-semiconductor) camera-specific pixel-dependent noise model30 to allow for applications that rely on fast acquisition speed (e.g. in live-cell imaging) and large field of view (e.g. in high-throughput studies) offered by the CMOS sensor. To maintain the statistical properties of the raw detected camera counts, INSPR generates a channel-specific in situ PSF for each detection plane (Extended Data Fig. 1b, Supplementary Note 2.7). Therefore, this approach avoids imaging artifacts and localization imprecision introduced during transformation between multiple detection planes (Extended Data Fig. 2e,f).
Performance quantification of in situ PSF retrieval with INSPR
We tested the accuracy of INSPR by retrieving a known wavefront distortion from single-molecule emission patterns simulated randomly within an axial range of ±800 nm (Supplementary Video 1 for 30 random trials and Fig. 2a–d for an example). The known wavefront shape consisted of 21 Zernike modes (Wyant order, from vertical astigmatism to tertiary spherical aberration) with their amplitudes randomly sampled from −1 to +1 (unit: λ/2π). INSPR successfully retrieved the in situ pupil with a phase error of 15±6 mλ (measured by root-mean-square error (RMSE), mean±std, Fig. 2b, Supplementary Video 1), and a Zernike amplitude error of 11±4 mλ for the total 21 modes (measured by RMSE, Fig. 2c, Supplementary Video 1). The INSPR retrieved 3D PSF showed high similarity with the ground truth PSF (Fig. 2d). INSPR was further tested through retrieving a previously estimated wavefront distortion at various imaging depths above the coverslip (0, 6.7, 14.35, 27.55, and 45.4 μm)31, showing the ability of INSPR to retrieve in situ PSFs at extended imaging depths (Extended Data Fig. 2a,b).
Fig. 2. Performance quantification of INSPR.
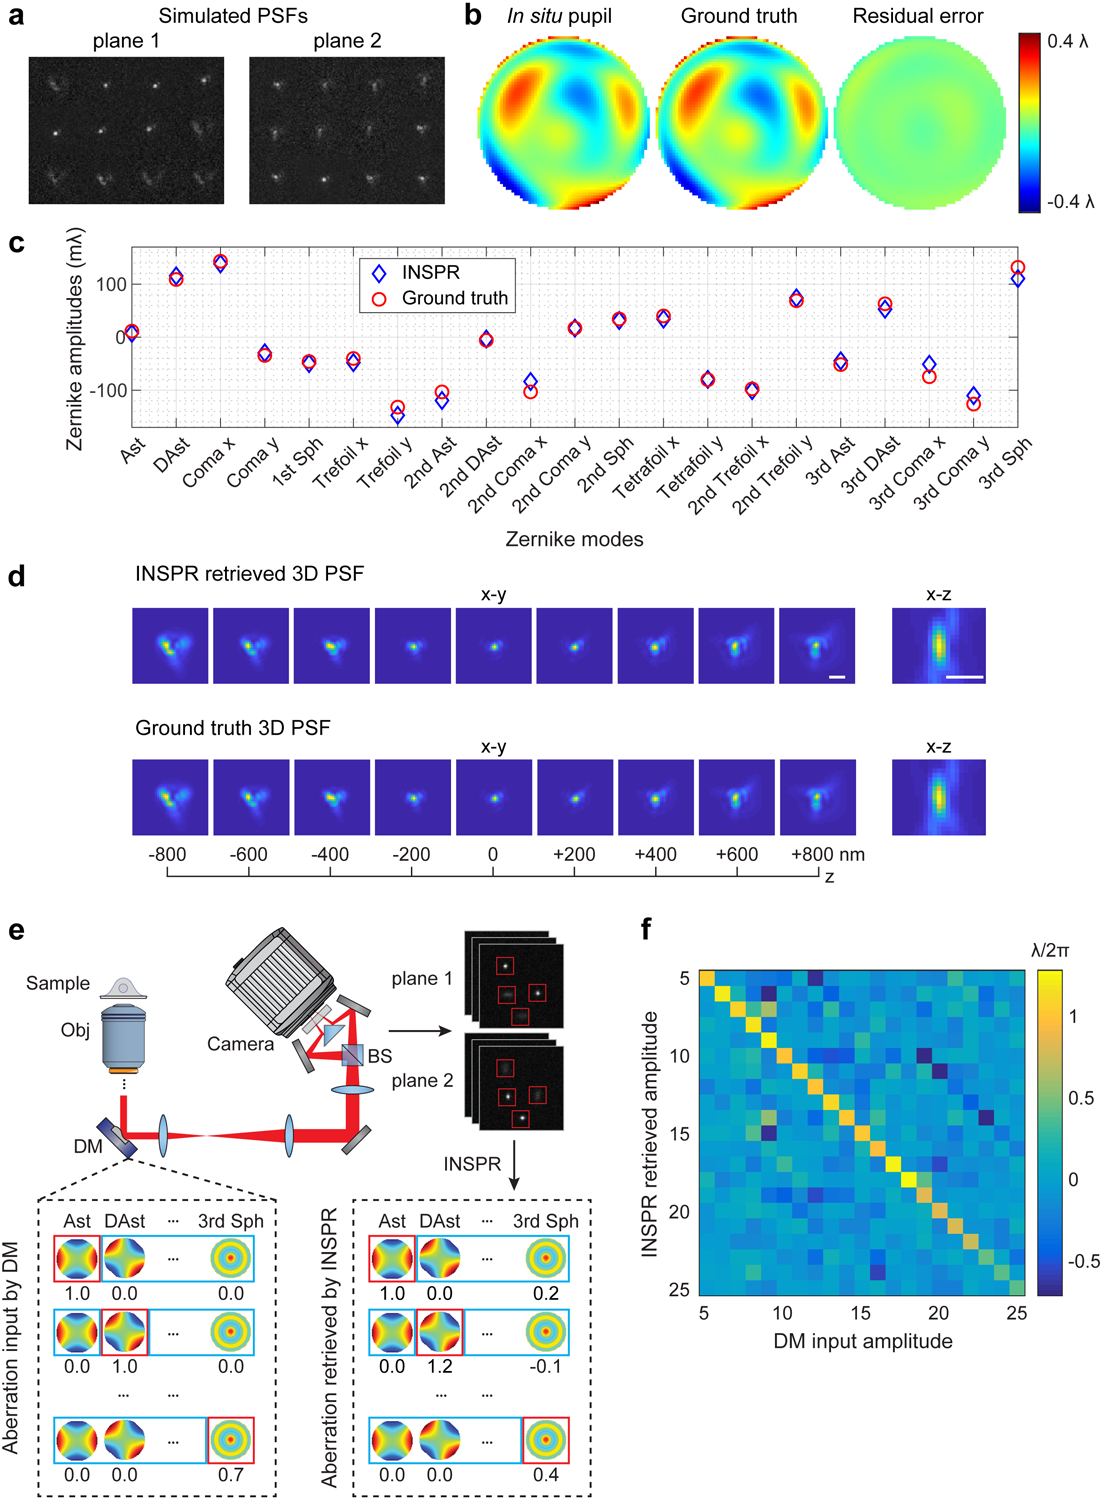
(a) Simulated biplane single-molecule emission patterns located randomly over an axial range from −800 to +800 nm with a known wavefront distortion. (b) Phase of the in situ pupil retrieved by INSPR (left), the ground truth pupil (middle), and the residual error (right). The RMSE is 15.6 mλ. (c) Amplitudes of 21 Zernike modes decomposed from the INSPR retrieved pupil (blue diamonds) compared with the ground truth (red circles). The RMSE is 11.1 mλ for the total 21 modes. (d) x-y and x-z views of the INSPR retrieved PSF (top row), showing high similarity with the ground truth PSF (bottom row). Scale bar: 1 μm. Results shown are representative of 30 trials, whose animated demonstration is shown in Supplementary Video 1. (e) Schematic for testing INSPR in a single-molecule dataset, where a deformable mirror is used to introduce controllable wavefront distortions. Emission patterns distorted by the input Zernike-based aberrations were acquired, and then fed into INSPR to retrieve the in situ pupil and its corresponding aberrations. (f) Heat map showing the relationship between the deformable mirror input and INSPR retrieved amplitudes of 21 Zernike modes. An animated process for generating this heat map is shown in Supplementary Video 3. Ast: vertical astigmatism; DAst: diagonal astigmatism; Sph: spherical aberration; Obj: objective lens; DM: deformable mirror; BS: 50/50 non-polarizing beam splitter.
By inserting a deformable mirror in the pupil plane of the microscope, we introduced controllable wavefront distortions to mimic the conditions when imaging thick specimens (Fig. 2e, Extended Data Fig. 1f, Supplementary Note 3.2). We acquired single-molecule datasets in COS-7 cells by visualizing the immunofluorescence-labeled mitochondrial marker TOM20 through DNA-PAINT (DNA point accumulation for imaging in nanoscale topography)32. The introduced aberrations distorted the emission patterns detected on the camera, which were then fed into INSPR to retrieve the in situ PSF. By comparing the aberration amplitudes induced by the deformable mirror with those retrieved by INSPR, we found that INSPR provided accurate estimations for the first 18 Zernike modes (8% error compared to the phase retrieval result using beads in vitro), with a performance decrease in the last three tertiary aberration modes (41% error) (Fig. 2f, Extended Data Fig. 2d, Supplementary Notes 2.2, 3.2, Supplementary Video 3). This result demonstrates the capability of INSPR to retrieve distorted in situ PSFs directly from single-molecule datasets obtained within cellular contexts.
Furthermore, we used INSPR to perform blind reconstruction of the simulated microtubule structures from the SMLM challenge15 in absence of calibration or ground truth PSF (Fig. 3a–e, Extended Data Fig. 3, Supplementary Note 3.1). INSPR allows us to directly reconstruct 3D PSF from the blinking dataset matching closely the provided calibration PSF (Fig. 3e, Extended Data Fig. 3g,n) and therefore, enables the blind super-resolution reconstruction of aberrated SMLM datasets for biplane and astigmatism-based SMLM modalities.
Fig. 3. Blind reconstruction of microtubules from the SMLM challenge and 3D super-resolution reconstructions of immunofluorescence-labeled TOM20 in COS-7 cells using INSPR and the in vitro approach.
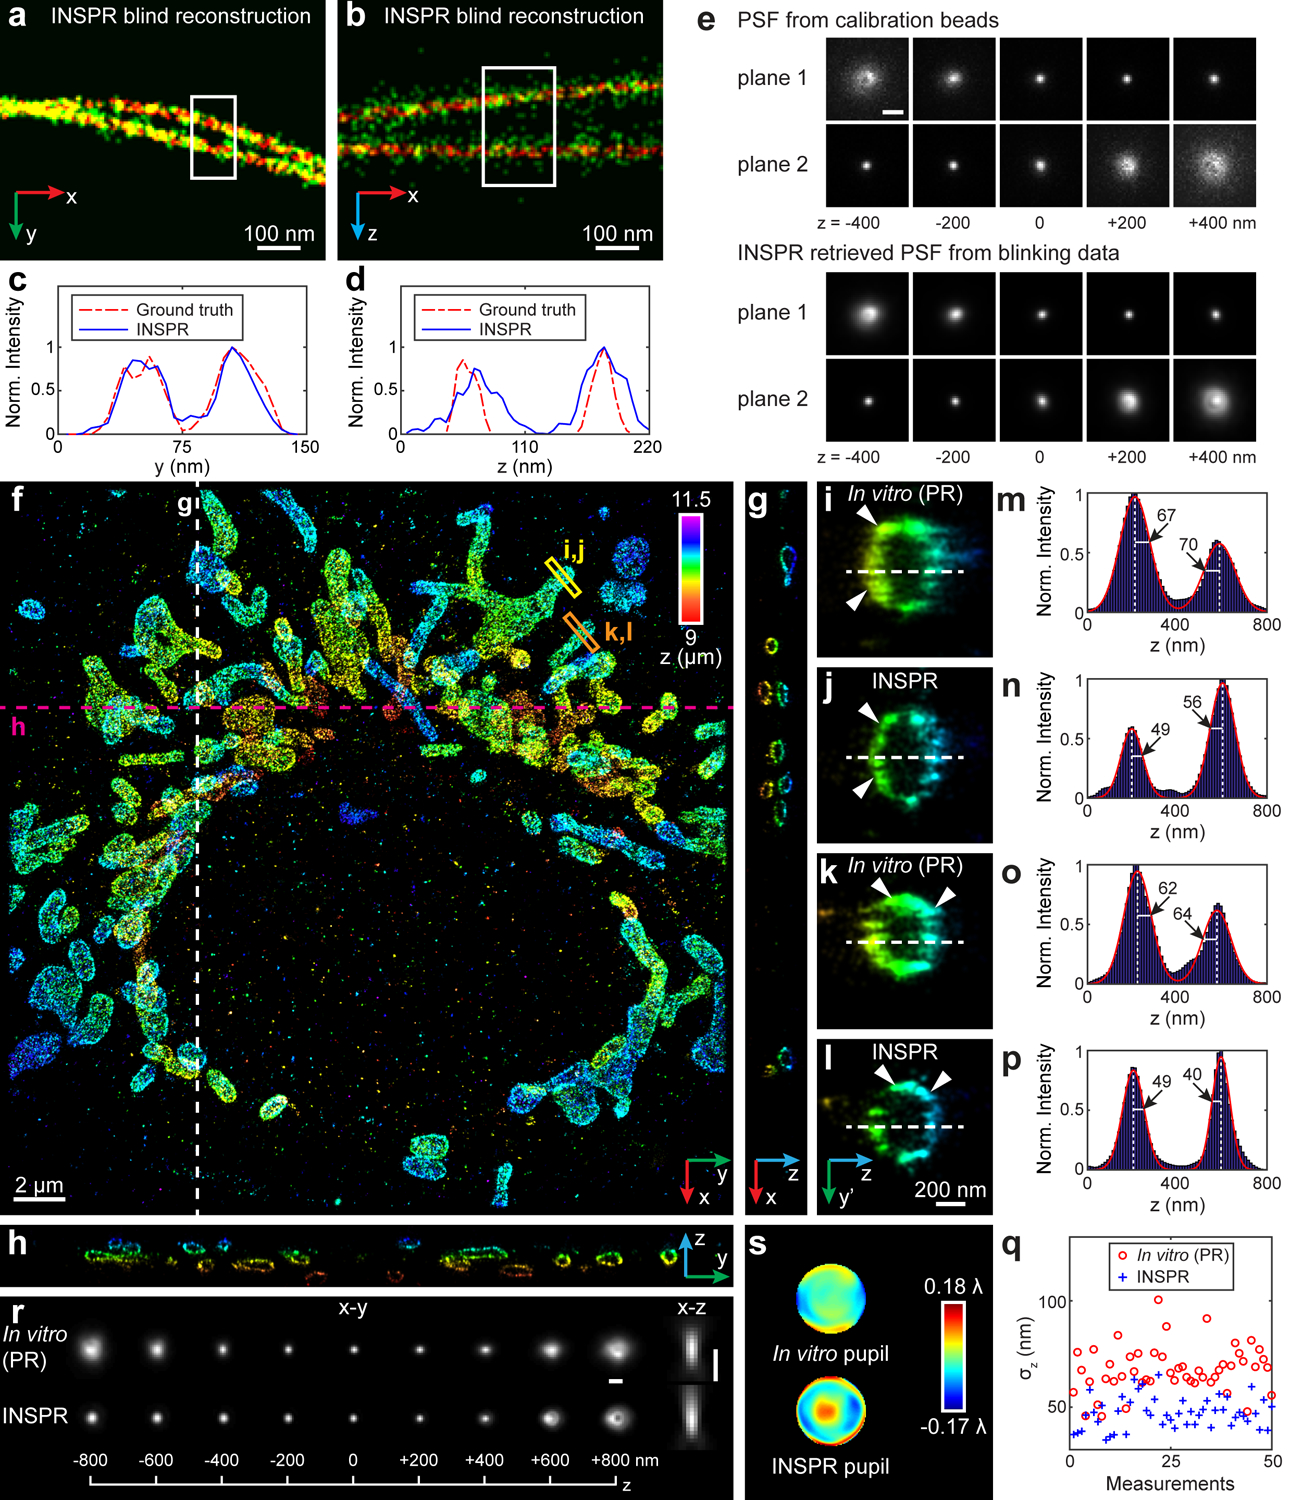
(a,b) Enlarged x-y and x-z views of the blind reconstruction of microtubules from the SMLM challenge (full reconstructions are shown in Extended Data Fig. 3). (c,d) Intensity profiles of the white boxed regions in (a,b), comparing the INSPR resolved profiles (blue solid lines) with the ground truth (red dash-dot lines). (e) x-y views of the provided calibration PSF and the INSPR retrieved PSF from blinking data. Scale bar: 1 μm. (f) x-y overview of the mitochondrial network. An animated 3D reconstruction is shown in Supplementary Video 4. (g,h) x-z and y-z slices along the white and magenta dashed lines in (f). The integration width of the slices in the third dimension is 200 nm. (i–p) Enlarged y’-z views of the membrane contours reconstructed using phase retrieval based on beads attached on the coverslip (in vitro (PR), i,k) and INSPR (j,l) as indicated by the yellow and orange boxed regions in (f), and their intensity profiles along the z direction (m–p). Here the orientation of the cross section is rotated to allow projection of the 3D membrane bounded structures to the 2D image. The numbers near the black arrows in (m–p) indicate σz in nanometers. (q) Distribution of σz obtained from the intensity profiles of 25 typical outer membranes in (f) resolved by INSPR (blue plus signs) and the in vitro approach (red circles). (r,s) x-y and x-z views of the PSFs retrieved by INSPR in the deepest optical section above the bottom coverslip and the in vitro method (r), and their corresponding phase distributions (s). Scale bar in (r): 1 μm. The dataset shown is representative of two datasets of mitochondria with depths of 9 μm from the coverslip. Norm.: normalized.
INSPR depends on the stochastic switching of single molecules to reconstruct the underlying PSF. Consequently, the number of emission patterns needed for a stable reconstruction depends on the signal to background ratio (SBR) of the detected emitters (Extended Data Fig. 2c). We found that, in high SBR cases, conditions usually encountered for fixed-cell imaging with specific labeling methods such as DNA-PAINT or bright organic probes such as Alexa Fluor 647, INSPR required less than 300 emission patterns to converge. In contrast, INSPR required more than 2100 emission patterns in low SBR cases, common conditions for live-cell imaging with fluorescent proteins such as mEos3.2. In these conditions, the required number of emission patterns might limit the temporal resolution of INSPR when rapid temporal variation of wavefront distortion is sought.
3D super-resolution imaging of whole cells and tissues with INSPR
INSPR enables us to measure and compensate sample-induced distortions within the actual imaging volume, as well as capturing its evolution throughout a thick specimen. We demonstrated this capacity through resolving nanoscale details of mitochondrial networks (Fig. 3f–s, Extended Data Figs. 4–6, Supplementary Video 4) and nuclear pores (Fig. 4, Extended Data Fig. 7, Supplementary Video 5) in mammalian cells, amyloid β plaques in mouse brains (Fig. 5, Supplementary Videos 6, 7), dendrites in mouse primary visual cortex (Fig. 6a–g, Extended Data Figs. 8, 9, Supplementary Video 8), and developing cartilage in mouse forelimbs (Fig. 6h–m, Extended Data Fig. 10, Supplementary Video 9). In each optical section, INSPR built a specific in situ PSF model from the acquired single-molecule dataset and used it to localize all the emission events in this section.
Fig. 4. 3D super-resolution reconstruction of immunofluorescence-labeled Nup98 on the nuclear envelope in COS-7 cells.
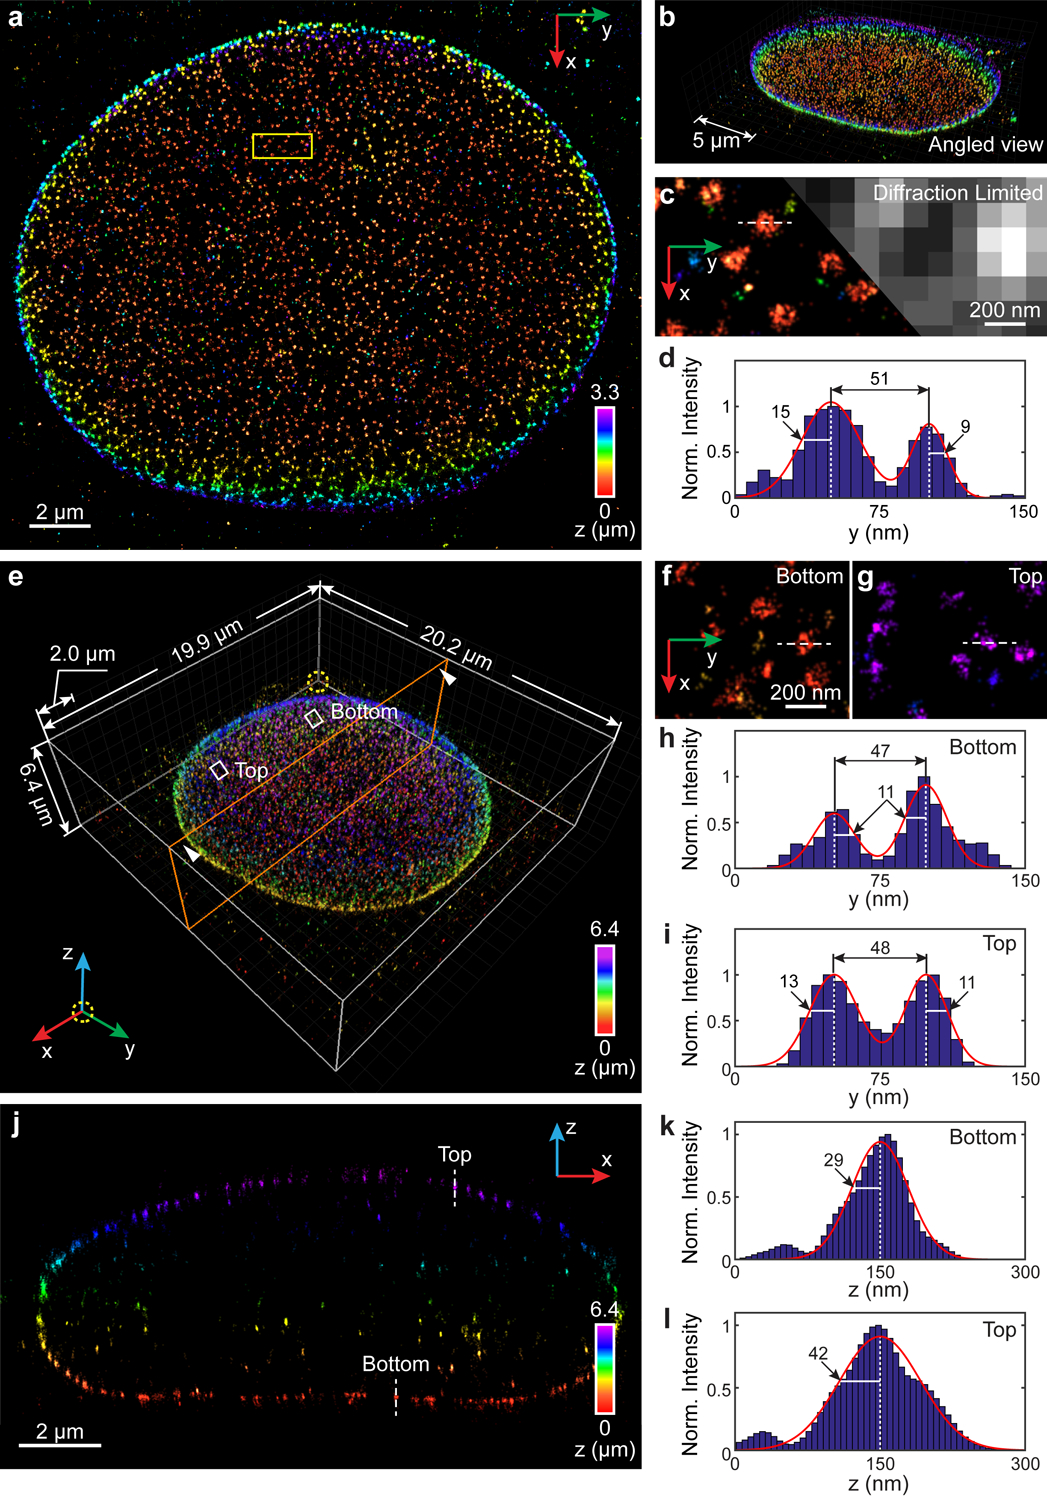
(a) x-y overview of a 3.3-μm-thick volume of the nucleus. (b) Angled view of (a). (c) Sub-region as indicated by the yellow boxed region in (a) showing the ultra-structure of Nup98 (left), which is not resolvable in conventional diffraction-limited microscopy (right). (d) Intensity profile along the white dashed line in (c). The diameter of this Nup98 structure is 51 nm, while σy obtained from the left and right boundaries equals to 15 nm and 9 nm, respectively. (e) Nup98 on the 6.4-μm-thick entire nuclear envelope rendered in 3D. An animated 3D reconstruction is shown in Supplementary Video 5. (f,g) Sub-regions as indicated by the white boxed regions in (e) showing enlarged x-y views of resolved nuclear pores at both bottom (f) and top (g) surfaces. (h,i) Intensity profiles along the white dashed lines in (f,g). The diameters of the Nup98 structures are 47 nm and 48 nm at the bottom (h) and top (i) surface, respectively. The numbers near the black arrows indicate σy in nanometers, which has a mean value of 11.5 nm. (j) x-z cross section along the orange plane in (e). The integration width of the x-z cross section in the y direction is 500 nm. (k,l) Intensity profiles along the white dashed lines in (j). σz equals to 29 nm and 42 nm for the measured structure at the bottom (k) and top (l) surface, respectively. The datasets shown are representative of four datasets of ~3 μm-thick volumes of nucleus and six datasets of the entire nuclear envelope. Norm.: normalized.
Fig. 5. 3D super-resolution reconstruction of immunofluorescence-labeled amyloid β (Aβ) plaques in 30-μm-thick brain sections from an 8-month-old 5XFAD mouse.
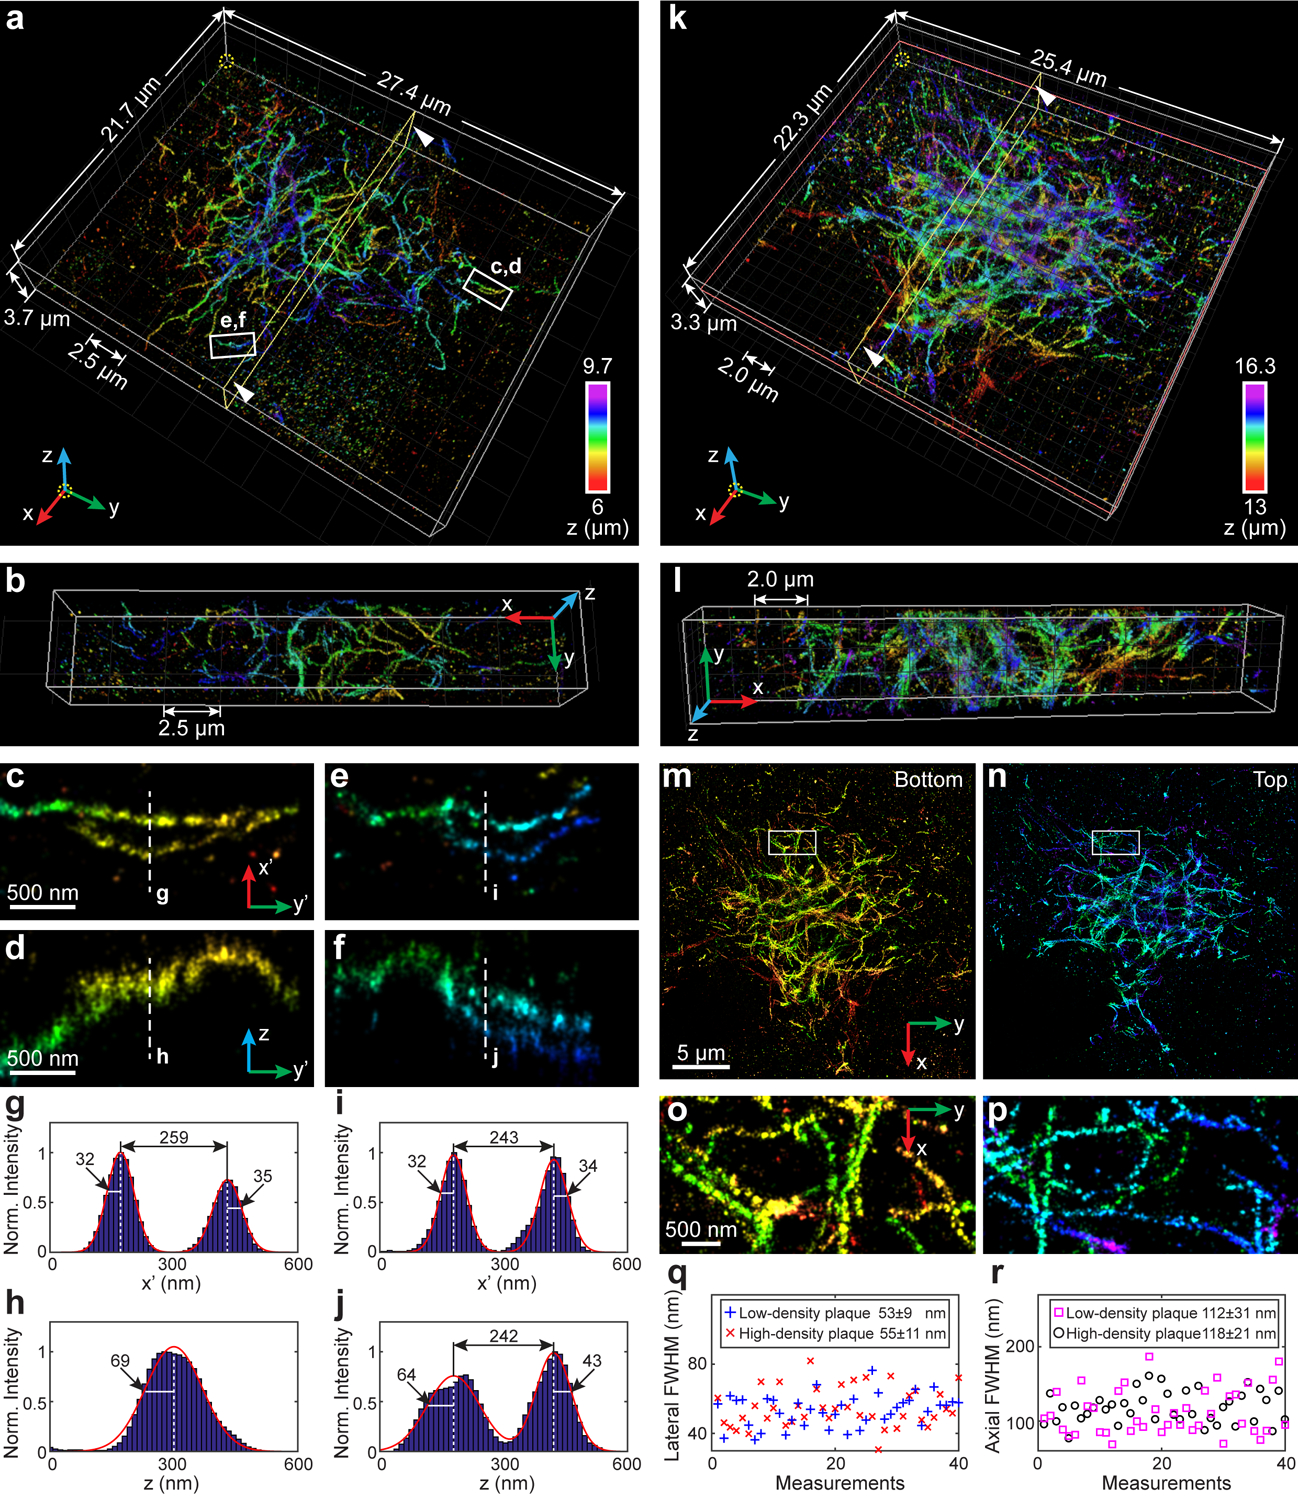
(a) Overview of an Aβ plaque with low-density fibrils. An animated 3D reconstruction is shown in Supplementary Video 6. (b) Cross section along the yellow plane in (a). (c–f) Enlarged y’-x’ and y’-z views of two typical fibrils within the white boxed regions in (a). (g–j) Intensity profiles along the white dashed lines in (c–f). Here the orientation of the cross section is rotated to allow projection of the 3D fibrils to the 2D image. The numbers near the black arrows indicate σx’ or σz in nanometers. (k) Overview of an Aβ plaque with high-density fibrils. An animated 3D reconstruction is shown in Supplementary Video 7. (l) Cross section along the yellow plane in (k). (m,n) x-y views of the bottom (m) and top (n) half of the plaque as divided by the orange plane in (k), each of which contains a network with distinctly resolved Aβ fibrils. (o,p) Enlarged x-y views of the areas as indicated by the white boxed regions in (m,n). (q) Distribution of lateral FWHM measured from 40 fibrils in the x-y plane in the low-density (blue plus signs) and high-density (red crosses) plaques. (r) Distribution of axial FWHM measured from 40 fibrils in the x-z plane in the low-density (magenta squares) and high-density (black circles) plaques. The datasets shown are representative of seven datasets of Aβ plaques with depths of ~6 μm and five datasets of Aβ plaques with depths of ~13 μm. Norm.: normalized.
Fig. 6. 3D super-resolution reconstructions of immunofluorescence-labeled ChR2-EYFP on dendrites in visual cortical circuits and immunofluorescence-labeled elastic fibers in developing cartilage.
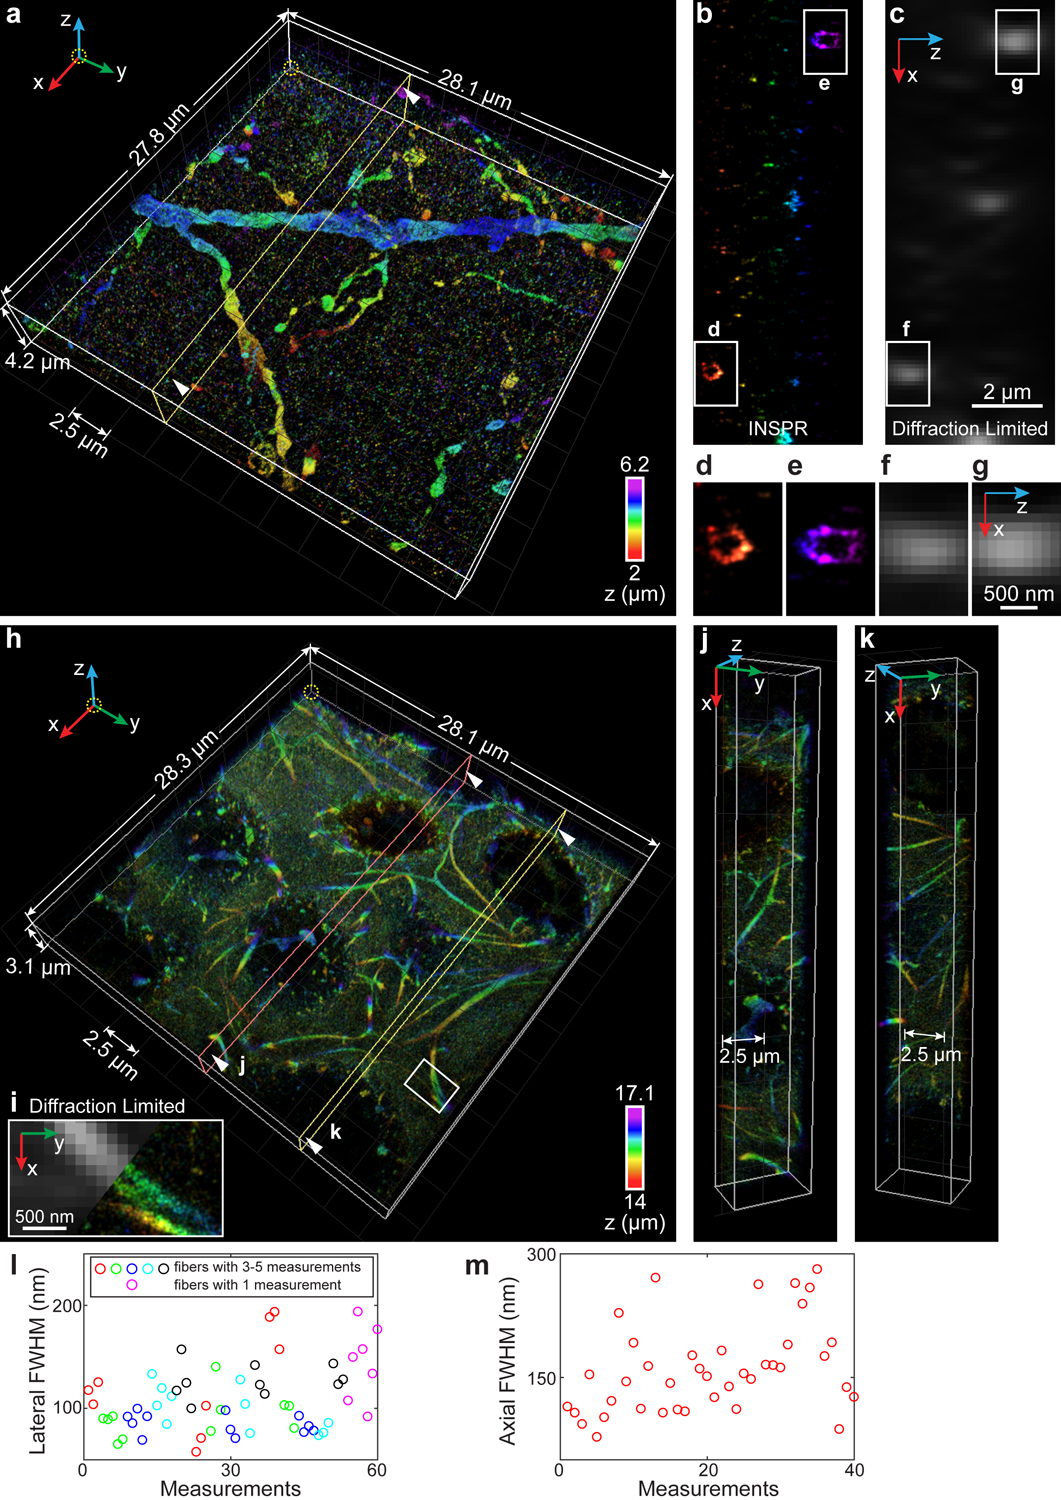
(a) 3D overview of a 4.2-μm-thick super-resolution volume in a 50-μm-thick brain section labeling ChR2-EYFP. An animated 3D reconstruction is shown in Supplementary Video 8. (b) Axial cross sections along the yellow plane in (a). The integration width of the x-z slice in the y direction is 200 nm. (c) Membrane bounded distributions are not resolvable in conventional diffraction-limited microscopy. (d–g) Zoomed in x-z views of the areas as indicated by the white boxed regions in (b,c). (h) 3D overview of a 3.1-μm-thick super-resolution volume in a 20-μm-thick developing cartilage tissue. An animated 3D reconstruction is shown in Supplementary Video 9. (i) Zoomed in x-y view of the area as indicated by the white boxed region in (h), showing the details of a split elastic fiber (right), which is not resolvable in conventional diffraction-limited microscopy (left). (j,k) Cross sections along the orange (j) and yellow (k) planes in (h). (l) Distribution of lateral FWHM, measured from 15 long fibers (3–5 measurements per fiber, indicated by red, green, blue, cyan, and black circles, where adjacent circles with the same color refer to multiple measurements in one fiber) and 7 short fibers (single measurement per fiber, indicated by magenta circles), both in the x-y plane. (m) Distribution of axial FWHM, measured from 40 typical elastic fibers in the x-z plane. The datasets shown are representative of five datasets of dendrites with depths of ~2 μm and two datasets of elastic fibers in developing cartilage with depths of ~14 μm.
Experimental demonstration of INSPR in whole cells
We first imaged immunofluorescence-labeled TOM20 in COS-7 cells in the biplane setup (Fig. 3f–s, Extended Data Fig. 6, Supplementary Video 4). To investigate the feasibility of INSPR when imaging above the coverslip surface, we created a 9-μm-thick sample cavity filled with water-based imaging medium between two coverslips, with the cells on the upper one. By using INSPR, the interconnected mitochondrial network was clearly resolved, where the x-z and y-z cross sections revealed the membrane contour of mitochondria in the axial direction (Fig. 3f–h). Examining reconstructions of the same field of view from both INSPR and the in vitro phase retrieval method based on fluorescent beads attached on the coverslip19,28, we found INSPR resolved the surface contour of each organelle with high resolution in 3D (Supplementary Video 4), whereas reconstructions using the in vitro approach exhibited both distortion and decreased resolution (Fig. 3i–p, Extended Data Fig. 6b). Intensity profiles of 25 typical outer membrane contours (positions shown in Extended Data Fig. 6a) also demonstrated a consistent improvement in resolution (Fig. 3q, Extended Data Fig. 6e). To further explain this difference, we compared the INSPR retrieved PSF models with the in vitro one (Fig. 3r,s, Extended Data Fig. 6c,d). The amount of sample-induced aberrations such as spherical and coma from optical sections increased together with the imaging depth, which was reflected by the INSPR retrieved pupils, their decomposed Zernike amplitudes, and their axially stretched PSFs. In contrast, the PSF retrieved from fluorescent beads characterized instrument imperfections but failed to take into account sample-induced aberrations and their depth-dependent variations due to its in vitro nature. Furthermore, we compared INSPR with other state-of-the-art in vitro localization methods such as ZOLD-3D24, cubic spline21, and microsphere-calibrated Gaussian fitting23 by reconstructing immunofluorescence-labeled TOM20 in COS-7 cells in the astigmatism-based setup (Extended Data Figs. 4, 5, Supplementary Notes 1.3, 1.4, 3.5). While sample-induced aberrations vary from specimen to specimen deteriorating the axial reconstruction for in vitro algorithms, our results show that INSPR is able to consistently achieve high-resolution 3D reconstructions as shown in the 200-nm-thick axial cross section images (Extended Data Figs. 4b–g, 5b–e, h–k).
We next tested INSPR by reconstructing immunofluorescence-labeled nucleoporin Nup98 in COS-7 cells (Fig. 4, Extended Data Fig. 7, Supplementary Video 5), which localizes near the center channel of the nuclear pore complex (NPC). We first reconstructed a super-resolution 3D volume of Nup98 within a relatively small depth of 3.3 μm and found individual ring-like structures covered the bottom surface of the nuclear envelope, displaying slight invaginations and undulations (Fig. 4a–d). We then reconstructed Nup98 on the entire nuclear envelope with a total thickness of 6.4 μm (Fig. 4e–l), and found that not only the individual pores were distinctly resolved throughout the entire envelope, but also the ultra-structures were resolved at both bottom and top surfaces of the nucleus (Fig. 4f,g, Supplementary Video 5). The diameters of these resolved Nup98 structures were 60±9 nm and 57±11 nm (Extended Data Fig. 7e, 40 measurements for each sample, profile positions shown in Extended Data Fig. 7a,c), which was consistent with being localized to the NPC channel walls and its labeling using IgG antibody molecules. Lateral profiles of single boundaries (i.e. ring thickness) of the observed structures resulted in σy of 14±3 nm and 11±3 nm (Extended Data Fig. 7f, 80 measurements for each sample, profile positions shown in Extended Data Fig. 7a,c), while σz of the top envelope surface (46±12 nm) was similar to that of the bottom surface (48±9 nm and 36±11 nm) (Extended Data Fig. 7g, 20 measurements for the bottom surface of the 3.3-μm-thick volume and 10 measurements for each surface of the 6.4-μm-thick volume, profile positions shown in Extended Data Fig. 7b,d). We notice that when using the in vitro approach, the thickness of the central cross section from the entire nuclear envelope was shrunk 32% compared to INSPR (Extended Data Fig. 7h,i) due to the inaccurate PSF model.
Resolving amyloid β fibrils in mouse brain sections
As a demonstration of INSPR in complex tissue architectures, we imaged extracellular deposits of amyloid β (Aβ) in brain sections from an 8-month-old 5XFAD mouse, which is routinely used to assess biological responses associated with Aβ accumulation. In 8-month-old aging animals, the increasing amyloid burden is associated with cognitive deficits, gliosis, and neuroinflammation33. Quantification of deposited Aβ based on conventional microscopy methods can result in contradictory findings34 due to insufficient resolution. By using INSPR, we reconstructed various Aβ plaques with depths up to 16 μm in 30-μm-thick brain slices (Fig. 5, Supplementary Videos 6, 7). In a volume with low-density fibrils (Fig. 5a–j), the distinct arrangement of fibrils in the plaque center was resolved, and the 3D details of individual fibrils within the intercrossing fibril networks were explicitly visualized and traceable as demonstrated in cross sections of both x-y and y-z planes (Fig. 5c–j, Supplementary Video 6). In another volume with high-density fibrils (Fig. 5k–p), we observed two distinct and axially separated layers of an Aβ plaque, each of which contained a network that was highly intercrossed with distinctly resolved fibrils (Fig. 5m–p, Supplementary Video 7). Measuring the resolved cross section of plaque forming fibrils, we obtained lateral profile widths (quantified with full width at half maximum, FWHM) of 53±9 nm and 55±11 nm (Fig. 5q, 40 measurements in each volume) and axial widths of 112±31 nm and 118±21 nm (Fig. 5r, 40 measurements in each volume). These results demonstrate the ability of INSPR to capture and discern individual fibrils within Aβ plaques while maintaining high resolution throughout the imaging depth, which can allow further investigation into the interactions of Aβ species with neuronal processes, adjacent astrocytes, and microglial cells.
Resolving ChR2-EYFP labeled dendrites in visual cortical circuits
We further imaged dendrites of neurons in visual cortical circuits. Dendrites represent the primary sites of information processing within the neuronal circuits of the brain, which is characterized by the structural dynamics associated with synaptic plasticity and correlated with the changes in the synaptic protein profiles35. We performed the injection of the retrograde adeno associated virus (AAV) expressing CRE locally into V1 in transgenic mice which conditionally express Channelrhodopsin-2-EYFP fusion protein in a CRE-dependent way (line Ai32)36. Imaging GFP-antibody labeled ChR2-EYFP inside 50-μm-thick mouse brain sections, the connection specific dendritic structures and the corresponding membrane protein distribution can be visualized in both lateral and axial directions (Fig. 6a–g, Extended Data Figs. 8, 9, Supplementary Video 8). Compared to the reconstruction of INSPR, the in vitro approaches, including phase retrieval based on fluorescent beads attached on the coverslip with/without theoretical refractive index mismatch aberration19,24 and phase retrieval based on beads embedded in agarose gel22, result in altered axial distributions of dendritic structures and sometimes axially distributed artifacts due to tissue-induced aberrations (Extended Data Figs. 8, 9, Supplementary Notes 1.5, 1.6, 3.5). The localization precisions of INSPR achieved ~11 nm in lateral and ~36 nm in axial dimensions (estimated by Cramér-Rao lower bound, Supplementary Table 1, Supplementary Notes 1.8, 2.8). Quantitative nanoscopy mapping of neuronal microcircuits and their key components will help in understanding the underlying mechanisms and logic of synaptic computations and their relevance for the higher-level biological functions such as visual perception and behavior.
Revealing elastic fibers in developing cartilage
We also imaged a decellularized tissue of developing cartilage in the humerus of E14.5 mouse embryos. Cartilage extracellular matrix (ECM) plays a critical role in directing cellular behavior and resisting forces. Due to the weak self-repairing capability of cartilage, there is a significant focus on generating scaffold materials that can restore the function and structure of adult skeletal tissues by recapitulating the environment found during development. However, the structure of cartilage matrix remains elusive as the majority of the ECM networks are unresolvable using conventional diffraction-limited microscopy. Here we reconstructed a super-resolution volume with an axial depth of 14 μm inside a 20-μm-thick developing cartilage tissue (Fig. 6h–m, Extended Data Fig. 10, Supplementary Video 9). INSPR resolved fine elastin-based, elastic fibers in 3D among the proteoglycans (Fig. 6h,i). These elastic fibers, independent of their orientations, were resolved (Fig. 6j,k) with a lateral width quantified by FWHM from 58 nm to 194 nm (Fig. 6l, 109±33 nm, 60 measurements) and an axial width from 78 to 281 nm (Fig. 6m, 160±55 nm, 40 measurements). These elastic fibers evolved along their paths in the tissue with the diameter changing as much as 80% (defined by FWHMmax / FWHMmin – 1, average of 41%, 15 measurements, Fig. 6l) in the lateral plane, an observation in agreement with previous studies using electron microscopy in adult articular cartilage and skin37. In addition, INSPR allowed us to trace individual elastic fibers in 3D within the tissue while observing the dynamic size changes along the path (comparison between INSPR and the in vitro approaches is shown in Extended Data Fig. 10). These observations will help in designing suitable regenerative scaffolds to restore functionality to cartilage and other damaged tissues.
Discussion
We demonstrated INSPR in retrieving in situ 3D PSF responses directly from single molecule datasets and precisely pin-pointing the positions of single molecules in presence of sample induced aberrations, a significant advancement from previous in vitro methods. Our experiments show the capability of INSPR to image whole cells and tissues at a depth of <20 μm with 7–12 nm lateral and 21–45 nm axial precisions in localization (estimated by Cramér-Rao lower bound, Supplementary Table 1, Supplementary Notes 1.8, 2.8). However, imaging beyond the demonstrated depth will be challenged by the constantly decreasing information content (Fisher information, Supplementary Notes 1.1, 2.8) of single-molecule emission patterns due to aberrations. Such information loss cannot be recovered by post-processing techniques but rather requires a physical element that modifies the distorted wavefront prior to detection. The combination of adaptive optics25,31,38,39 with INSPR will allow restoring emission pattern information and pin-pointing 3D location of single molecules with high accuracy simultaneously. In addition, INSPR can be combined with light-sheet illumination approaches40,41 and tissue clearing42 and expansion methods43 to further reduce the fluorescence background and increase the achievable resolution, therefore opening doors to observe nanoscale conformation over extended tissue volumes.
Nanoscopy of specimens that are living, of large volumes44,45, and with multi-color probes will induce time-, region-, and channel-dependent aberrations in single-molecule datasets. Future applications of INSPR will also allow extraction of such temporally, spatially, and spectrally varying 3D responses to ensure localizations with high precision and accuracy. Therefore, we expect INSPR will enable the visualization of cellular structures and protein functions throughout whole cells and tissues across diverse biological and biomedical model systems.
Online Methods
Preparation of fluorescent beads on coverslips
25-mm-diameter coverslips (CSHP-No1.5–25, Bioscience Tools) were cleaned successively in ethanol (2701, Decon) and HPLC grade water (W5–4, Fisher Chemical) three times, and then dried with compressed air. 100-nm-diameter crimson beads (custom-designed, Invitrogen) were diluted to 1:100,000 in deionized water. 200 μL of poly-L-lysine solution (P4707, Sigma-Aldrich) was added on the coverslip, incubated for 20 min and subsequently rinsed with deionized water. 200 μL of diluted bead solution was added on the center of the coverslip and was incubated for 20 min at room temperature (RT). The coverslip was subsequently rinsed with deionized water and drained. The coverslip was placed on a custom-made holder, and 20 μL of 38% 2,2’-Thiodiethanol (166782, Sigma-Aldrich) in 1×PBS (10010023, Gibco) was added on its center. Another 25-mm-diameter coverslip (also cleaned by using the above protocol) was placed on top of this coverslip. This coverslip sandwich was sealed with two-component silicone dental glue (Twinsil speed 22, Dental-Produktions und Vertriebs GmbH).
Preparation of fluorescent beads embedded in agarose gel
A solution containing 1 mL of 1×PBS and 20 mg of agarose powder (A9045, Sigma-Aldrich) was added into a cube, vortexed, and then heated until 70 ℃. 2,2’-Thiodiethanol was added into the solution to adjust the refractive index until it increased to 1.352 to match the refractive index of the imaging medium. 100-nm-diameter crimson beads were diluted to 1:100,000 in this agarose gel solution. A 25-mm-diameter coverslip was placed on a custom-made holder, and 100 μL of the diluted bead solution was added on its center. Another cleaned coverslip was placed on top of this coverslip. This coverslip sandwich was put into the fridge until the agarose gel was solidified. Then this coverslip sandwich was sealed with two-component silicone dental glue.
Preparation of Alexa Fluor 647 labeled microspheres on coverslips
A solution containing 500 μL of deionized water, 500 μL of 1×PBS, 50 μL of 9.78 μm diameter biotin-coated microsphere solution (CP10000, Bangslab), and 0.5 μL of streptavidin-functionalized Alexa Fluor 647 (S21374, Invitrogen) was prepared. This solution was centrifuged for 20 min at 1340 rpm. The liquid was removed and replaced with 500 μL of 1×PBS. 100 μL of the vortexed solution was added on the center of a 25-mm-diameter coverslip, incubated for 20 min at RT, and sequentially rinsed with deionized water. This coverslip was placed on a custom-made holder, and 20 μL of imaging buffer (10% (w/v) glucose in 50 mM Tris (JT4109, J.T.Baker), 50 mM NaCl (S271-500, Fisher Chemical), 10 mM MEA (M6500, Sigma-Aldrich), 50 mM BME (M3148, Sigma-Aldrich), 2 mM COT (138924, Sigma-Aldrich), 2.5 mM PCA (37580, Sigma-Aldrich), and 50 nM PCD (P8279, Sigma-Aldrich), pH 8.0) was added on top of the coverslip. Then another cleaned coverslip was placed on top of the imaging buffer. This coverslip sandwich was sealed with two-component silicone dental glue.
Cell culture
COS-7 cells (CRL-1651, ATCC) were immunofluorescence-labeled with TOM20, α-tubulin, and Nup98. COS-7 cells were grown on coverslips in 6-well plates and cultured in DMEM (30–2002, ATCC) with 10% FBS (30–2020, ATCC) and 1% Penicillin-Streptomycin (15140122, Gibco) at 37 °C with 5% CO2 until their confluence reaches about 80%.
BS-C-1 cells (CCL-26, ATCC) in collagen embedded 3D cultures were immunofluorescence-labeled with α-tubulin. 50,000 BS-C-1 cells were centrifuged and re-suspended in 100 μL of 4 mg/mL collagen I (5201–1KIT, Advanced BioMatrix). The suspension containing collagen I and BS-C-1 cells was then dispensed onto coverslips in 6-well plates. After incubation at 37 °C for 20 min to solidify the collagen, cells on the coverslips were cultured in EMEM (30–2003, ATCC) with 10% FBS at 37 °C with 5% CO2 until their confluence reaches about 80%.
Fixation and labeling of TOM20, α-tubulin, and Nup98
In preparation of TOM20 and α-tubulin specimens, cultured cells were first fixed with 37 °C pre-warmed 3% PFA (15710, Electron Microscopy Sciences) and 0.5% GA (16019, Electron Microscopy Sciences) in 1×PBS at RT for 15 min. In preparation of Nup98 specimens, cultured cells were first rinsed with 37 °C pre-warmed 2.4% PFA in 1×PBS for 20 s, and then extracted with 37 °C pre-warmed 0.4% Triton X-100 (X100, Sigma-Aldrich) in 1×PBS for 3 min. Then, cells were fixed with 2.4% PFA in 1×PBS for 30 min. After fixation, cells were washed twice with 1×PBS and then quenched with freshly-prepared 0.1% NaBH4 (452882, Sigma-Aldrich) in 1×PBS for 7 min. Subsequently, cells were washed three times with 1×PBS and then treated with blocking buffer (3% BSA (001-000-162, Jackson ImmunoResearch) and 0.2% Triton X-100 in 1×PBS for TOM20 and α-tubulin, and 5% BSA in 1×PBS for Nup98) for 1 h, gently rocked at RT. Then, cells were incubated with primary antibodies (sc-11415, Santa Cruz Biotechnology, for TOM20; T5168, Sigma-Aldrich, for α-tubulin; and 2598, Cell Signaling Technology, for Nup98; all diluted at 1:500) at 4 °C overnight. After washed three times for 5 min each time with wash buffer (0.05% Triton X-100 in 1×PBS), cells were then incubated with secondary antibodies (A21245 and A21236, Invitrogen, for Alexa Fluor 647, diluted at 1:500; DNA-conjugated anti-mouse P1, anti-rabbit P1, and anti-rabbit P432 for DNA-PAINT, diluted at 1:50) at RT for 5 h. Both primary and secondary antibodies were diluted in antibody dilution buffer (1% BSA and 0.2% Triton X-100 in 1×PBS for TOM20 and α-tubulin, and 5% BSA in 1×PBS for Nup98). After washed three times (5 min each time with wash buffer), cells were post-fixed with 4% PFA in 1×PBS for 10 min. Cells were then washed three times with 1×PBS and stored in 1×PBS at 4 °C until imaging.
Fixation and labeling of amyloid β in mouse brain sections
An 8-month-old 5XFAD mouse was anesthetized with Tribromoethanol (Avertin) 125–250mg/kg IP and transcardially perfused with saline. Brain was post-fixed with 4% PFA in PBST (0.1% Tween (0777, VWR) in 1×PBS) for 24 h. Tissue was then transferred to 30% sucrose (57-50-1, Fisher Chemical). Tissue was embedded in O.C.T. compound (23-730-571, Fisher Healthcare) and hemibrain was sagitally sectioned on a cryostat (CM1950, Leica) at 30 μm thick. Sections were stored at −20 °C in cryoprotectant (30% glycerol (G5516, Sigma-Aldrich) and 30% ethylene glycol (293237, Sigma-Aldrich) in 1×PBS). Prior to staining, sections were washed three times in PBST for 10 min each time and then treated for antigen retrieval with 10 mM sodium citrate (S279–500, Fisher Chemical) and 0.5% Tween in PBST at 85 °C for 10 min. Sections were blocked in normal donkey serum (D9663, Sigma-Aldrich) for 1 h and incubated with anti-β-amyloid antibody (2454, Cell Signaling Technology) at 4 °C overnight. Following three PBST washes, sections were then stained with donkey anti-rabbit Alexa Fluor 647 conjugated antibody (A31573, Invitrogen) at RT for 1 h. Both primary and secondary antibodies were diluted to 1:1000 in blocking buffer. Nuclei were stained with DAPI (10236276001, Sigma-Aldrich) diluted to 1:10,000 in PBST at RT for 2 min. Sections were then wet mounted onto coverslips and dried at 4 °C overnight before imaging.
Fixation and labeling of ChR2-EYFP in mouse brain sections
To perform infections, Ai32 mice (male postnatal day 89 and 273, RCL-ChR2(H134R)/EYFP, Jackson Lab) were first anesthetized with inhaled isoflurane (5% for induction, and 1.5% for maintenance in room air, using SomnoSuite system). Then the primary visual cortex was identified (stereotaxic coordinates: 0.3 mm anterior, 3.0 mm lateral, relative to the lambda reference point) and a small craniotomy was made using a dental drill to allow injection glass pipette to go in. 200 nL of pAAV-Ef1a-mCherry-IRES-Cre (55632-AAVrg, Addgene) was injected at 300 μm and 700 μm underneath the brain surface (1 nL/s, 100 nL for each depth) using a micro-injector (3000037, Drummond Scientific). After injection, metabond dental cement (Parkell) was applied on top of the mouse skull to form a protective head cap. 5 weeks were allowed for viral infection and protein expression before perfusion. To perform trans-cardiac perfusion, mice were first anesthetized with 100 mg/kg ketamine (59399-114-10, Akron) and 16 mg/kg xylazine (343750, HVS) through intra-peritoneal injection. After anesthetized state was confirmed by toe pinch, the abdomen was opened to expose the heart. A needle was inserted into the left ventricle and a small incision was made on the right atrium of the heart. Mice were first perfused with 1×PBS (1:10 diluted from DSP32060, Dot Scientific) until the liver was cleared, and then with 4% PFA (P6148, Sigma-Aldrich) in 1×PBS for fixation. Mouse brains were carefully extracted and post-fixed in 4% PFA for 12–24 h before slicing. Brain tissues were sliced using a vibrating microtome (1000 Plus, TPI Vibratome) at 50 μm thick. Before immunohistochemistry, slices were washed three times for 15 min each time in wash buffer (0.1% Triton X-100 in 1×PBS), then treated with blocking buffer (5% BSA (A9647, Sigma-Aldrich) in 1×PBS) at RT for 1.5 h. After that, slices were incubated with chicken anti-GFP antibody (ab13970, Abcam, diluted to 1:1000 in blocking buffer) at 4°C overnight, washed three times (15 min each time with wash buffer), and then incubated with goat anti-chicken Alexa Fluor 647 conjugated antibody (A21449, Invitrogen, diluted to 1:600 in wash buffer) at RT for 2 h. Slices were then wet mounted onto coverslips and dried at 4 °C overnight before imaging.
Fixation and labeling of elastic fibers in developing cartilage
E14.5 mouse embryos were generated by the timed mating of wild type C57Bl/6 mice. Mice were euthanized via CO2 inhalation and confirmed by cervical dislocation. Embryos were removed from the uterine horns and rinsed with 1×PBS. Forelimbs were removed from the embryos and mounted in 1% low gelling agarose cubes. Agarose cubes were submerged in 0.05% SDS (0837, VWR) and 2% Penicillin-Streptomycin in 1×PBS, and gently rocked at RT. The SDS buffer was replaced every 48 h until decellularization was completed (3–5 d). Upon decellularization, agarose cubes were rinsed with 1×PBS for 1 h, and then fixed with 4% PFA (J19943K2, Thermo Scientific) in 1×PBS for 1 h, rinsed with 1×PBS for 1 h again gently rocked at RT. Forelimbs were removed from the agarose cubes for cryosectioning. Forelimbs were submerged in 15% sucrose (84097, Sigma-Aldrich) at 4 °C until equilibrated (indicated by the specimen sinking to the bottom of the tube), and then submerged in 30% sucrose at 4 °C until equilibrated. Forelimbs were embedded in O.C.T. compound (4583, Sakura Finetek), frozen in dry-ice-cooled isopentane, and stored at −80 °C until sectioning. 20-μm-thick cryosections containing cartilage from the humerus were collected on coverslips and stored at −20 °C. Before staining, cryosections were rinsed with 1×PBS for 5 min to remove any residual O.C.T. compound, fixed with 4% PFA in 1×PBS for 15 min, and rinsed with 1×PBS for 5 min again. Cryosections were then quenched with 0.1% NaBH4 in 1×PBS for 15 min, and washed with 1×PBS for 5 min. Cryosections were blocked with 10% donkey serum (S30, Sigma-Aldrich) and 0.2% BSA (A9418, Sigma-Aldrich) in 1×PBS for 1 h, and then incubated with Alexa Fluor 647 conjugated WGA (W32466, Invitrogen) diluted to 1:200 in 1×PBS at 4 °C overnight. After that, cryosections were washed three times with 1×PBS and stored in 1×PBS at 4 °C until imaging.
Imaging buffers and sample mounting
Immediately before imaging samples labeled with Alexa Fluor 647, the coverslip with specimens on top of it was placed on a custom-made holder. 20–40 μL of imaging buffer (10% (w/v) glucose in 50 mM Tris, 50 mM NaCl, 10 mM MEA, 50 mM BME, 2 mM COT, 2.5 mM PCA, and 50 nM PCD, pH 8.0) was added on top of the coverslip. Then another cleaned coverslip was placed on top of the imaging buffer. This coverslip sandwich was sealed with melted valap (1:1:1 [w/w/w] mixture of lanolin, paraffin, and Vaseline (L7387, 18634, and 16415, Sigma-Aldrich)) or two-component silicone dental glue. The sample cavity with immunofluorescence-labeled cells on the top coverslip was prepared in a similar way by placing the cleaned coverslip at the bottom and the coverslip with cells on top of it with the cell side surface facing down.
Immediately before imaging samples tagged with DNA-PAINT probes, the coverslip with cells on top of it was placed on a cell chamber (A7816, Invitrogen). 600 μL of imaging buffer (2 nM ATTO 655 conjugated DNA imager strand diluted in 500 mM NaCl in 1×PBS) was added into the chamber. In the distorted wavefront control experiment, P1 imager strand was used to image mitochondria. In Exchange-PAINT imaging, the chamber was mounted firmly on the sample stage to minimize the lateral drift. We first added imaging buffer with P4 strand to image mitochondria, and then used syringes to remove the buffer, wash samples with 1×PBS for several times, and add imaging buffer with P1 strand to image microtubules.
Microscope Setup
The system (Extended Data Fig. 1f) was built around an Olympus IX-73 microscope stand (IX-73, Olympus America) equipped with a 100×/1.35-NA silicone-oil-immersion objective lens (FV-U2B714, Olympus America) and a PIFOC objective positioner (ND72Z2LAQ, Physik Instrumente). Three laser lines at wavelengths of 642 nm (2RU-VFL-P-2000–642-B1R, MPB Communications), 560 nm (2RU-VFL-P-500–560, MPB Communications), and 405 nm (DL-405–100, Crystalaser) were coupled into a polarization-maintaining single-mode fiber (PM-S405-XP, Thorlabs) after passing through an acousto-optic tunable filter (AOTFnC-400.650-TN, AA Opto-electronic) for wavelength selection and power modulation. The excitation light coming out of the fiber was focused to the pupil plane of the objective lens after passing through a filter cube holding a quadband dichroic mirror (Di03-R405/488/561/635-t1, Semrock). The focus of excitation light in the pupil plane could be translated sideways by a mirror conjugated to the sample plane for switching between epi-illumination and highly inclined and laminated optical sheet (HILO) imaging modalities46. Additionally, a transmitted Köhler illuminator inside the microscope stand equipped with a motorized shutter (87–208, Edmund Optics) illuminated the sample between acquisition cycles for focus stabilization47. Besides, to observe the nucleus labeled with DAPI, an alternative illumination module was used, where light from a mercury light source (U-LH100HG, Olympus America) was directed by a motorized flip mirror, passed through a filter cube holding a bandpass filter (AT350/50x, Chroma) and a dichroic mirror (T400LP, Chroma), and then illuminated the sample. The pupil plane of the objective lens was imaged onto a deformable mirror (Multi-3.5, Boston Micromachines), which allowed for introducing controlled amount of wavefront aberrations to test the performance of INSPR experimentally. The fluorescent signal was magnified by relay lenses arranged in a 4f alignment to a final magnification of ~54, and then was split with a 50/50 non-polarizing beam splitter (BS016, Thorlabs) mounted on a kinematic base (KB25/M, Thorlabs). The separated fluorescent signals were delivered by two mirrors onto a 90° specialty mirror (47–005, Edmund Optics), passed through a motorized filter wheel holding five alternative bandpass filters (FF01–731/137–25 and FF01–600/52–25, Semrock; ET665LP, ET700/75m, and ET460/50m, Chroma), and were then projected on an sCMOS camera (Orca-Flash4.0v3, Hamamatsu) with an effective pixel size of 120 nm. The detection planes that received the signals transmitted and reflected by the beam splitter were referred as plane 1 and plane 2, respectively (Extended Data Fig. 1g). To adjust the distance between the two detection planes, two piezo inertia actuators (PIAK10 and PIA13, Thorlabs) were equipped on the mirror that delivered the reflected signal onto the 90° specialty mirror. When the system worked as an astigmatism-based setup, the beam splitter was removed so that the camera only detected the transmitted signal, while the correction collar of the objective lens was adjusted to minimize spherical aberrations. In this case, we used the deformable mirror (DM) to induce vertical astigmatism with an amplitude of +1.5 (unit: λ/2π). The imaging system was controlled by a custom-written program in LabVIEW (National Instruments).
Data acquisition
The SMLM setup is extremely susceptible to sample drift in the axial direction for its long data acquisition time, typically from tens of minutes to hours. To compensate this drift, we implemented a focus stabilization module47. Before fluorescence imaging, we recorded a series of bright-field images of the sample along the axial direction (from −1 to +1 μm, with a step size of 100 nm) as reference images. During fluorescence imaging, we recorded a real-time bright-field image of the sample after each acquisition cycle (1000 or 2000 frames, depending on the sample stability), and compared the similarities between this real-time image and reference images by calculating their 2D correlation. The correlation values of the most similar reference image and its nine adjacent images, together with their z positions, were fitted with third degree polynomials. The z position corresponding to the maximum correlation value in the fitting curve was treated as the sample drift. Then we moved the objective lens in the inverse direction to compensate this drift. In this way, focus stabilization can be achieved during data acquisition.
The biplane datasets for measuring the biplane distance (Extended Data Fig. 1g) and building the in vitro model (Fig. 3f–s, Extended Data Figs. 6–10) were separately collected by imaging fluorescent beads on the coverslip or in the agarose gel over an axial range from −1.5 to +1.5 μm with a step size of 100 nm, and taking 50 frames per step with a frame rate of 10 Hz. The biplane distance (Supplementary Note 2.1) was estimated to be 580 nm for distorted wavefront control (Fig. 2e,f), 286 nm for imaging TOM20 labeled with Alexa Fluor 647 (Fig. 3f–s), 568 nm for imaging dendrites with depths of 7 μm and 11 μm (Extended Data Fig. 9), and 558 nm for all the other imaging sessions (Figs. 4–6).
The astigmatism-based dataset for building the in vitro cubic spline model (Extended Data Fig. 4) was collected by imaging fluorescent beads on the coverslip over an axial range from −1 to +1 μm with a step size of 50 nm, and taking 50 frames per step with a frame rate of 10 Hz (~5 beads in each dataset, 3 datasets in total). Here we used DM to induce vertical astigmatism with an amplitude of +1.5 (unit: λ/2π). Due to instrument imperfections, the setup itself has vertical astigmatism with an amplitude of −0.3 (unit: λ/2π), so the resulting vertical astigmatism has an amplitude of +1.2 (unit: λ/2π) as prior knowledge.
The astigmatism-based SMLM dataset for obtaining the calibration curve from microspheres (Extended Data Fig. 5) was collected by imaging Alexa Fluor 647 labeled microspheres on the coverslip. The microsphere sample was first illuminated with the transmitted light to record a bright-field image at the equatorial plane of the microspheres, which was used to measure both the radius R and the center (x0, y0) of each microsphere. Then the objective lens was moved axially to the selected imaging depth. Before fluorescence imaging, bright-field images of this region were recorded over an axial range from −1 to +1 μm with a step size of 100 nm as reference images for focus stabilization. Then the blinking data were collected at the illumination of the 642-nm laser. The laser power was 17 kW/cm2 to get low density of molecules. 1000 frames were collected per cycle with a frame rate of 50 Hz and ~15 cycles were collected.
In biological imaging (Figs. 2f, 3f–s, 4–6, Extended Data Figs. 4, 5, 9), the sample was first excited with the 642-nm laser at a low intensity of ~50 W/cm2 to find a region of interest. The depth from this region to the bottom coverslip was measured by recording a first position of the objective lens when the dusts on the bottom coverslip were in focus, then recording a second position of the objective lens when the region of interest was in focus. The difference between these two recorded positions was treated as the depth of this region. Before fluorescence imaging, bright-field images of this region were recorded over an axial range from −1 to +1 μm with a step size of 100 nm as reference images for focus stabilization. Then the blinking data were collected at a laser intensity of 2–6 kW/cm2 and a frame rate of 50 Hz. For distorted wavefront control (Fig. 2f), 2000 frames were collected for each Zernike-based aberration mode with its amplitude set at ±1 (unit: λ/2π). For single-section imaging (Extended Data Fig. 5), 2000 frames were collected per cycle and ~50 cycles were collected. For multi-section imaging (Figs. 3f–s, 4–6, Extended Data Figs. 4, 9), the sample was scanned axially by translating the objective lens with a step size of 400 nm in biplane setup and 250 nm in astigmatism-based setup from the bottom to the top of the sample. 1000 or 2000 frames were collected for each cycle in one optical section, 5–14 optical sections were collected according to the thickness of the sample, and 8–25 cycles were collected in total (Supplementary Table 1).
Animals
All animal procedures associated with mice were approved by Indiana University School of Medicine Institutional Animal Care and Use Committee (IACUC) and Purdue Animal Care and Use Committee (PACUC), and complied with all relevant ethical regulations.
Reporting Summary
Further information on research design is available in the Nature Research Reporting Summary linked to this article.
Data availability
The data that support the findings of this study are available from the corresponding authors upon request. Example data are available in software packages. 3D point clouds resolved by INSPR for Supplementary Videos 4–9 are provided from figshare (https://doi.org/10.6084/m9.figshare.11962764).
Code availability
The INSPR toolbox for in situ model estimation and 3D localization is available as supplementary software. INSPR works for commonly used biplane and astigmatism configurations. Further updates will be made freely available at https://github.com/HuanglabPurdue/INSPR. The software package features an easy-to-use user interface including all steps of 3D single-molecule localization from INSPR model generation, pupil-based 3D localization (including both CPU and GPU versions), drift correction, volume alignment, to super-resolution image reconstruction.
Extended Data
Extended Data Fig. 1. INSPR framework, degeneracy illustration, and setup diagram.
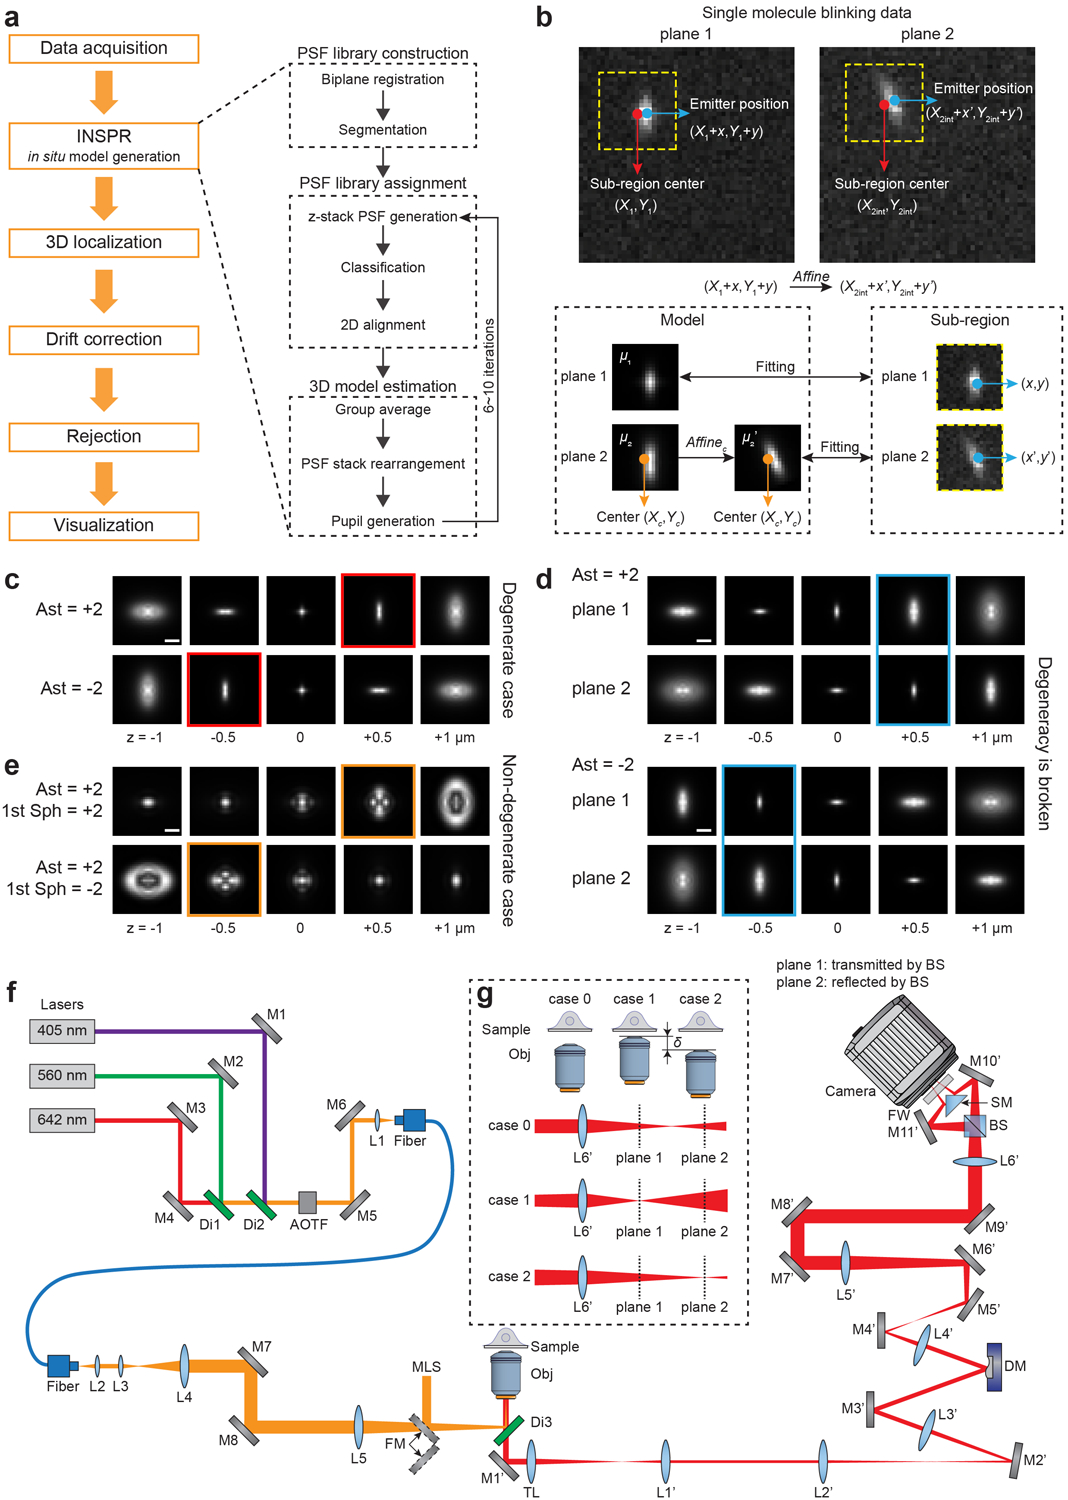
(a) INSPR framework and detailed process of in situ model generation. (b) Single molecules are localized by a pair of channel-specific models which share the same shape information with the corresponding sub-regions. (c) Degeneracy exists in single plane configuration, where PSFs with positive and negative vertical astigmatism aberrations (Ast) are identical at opposite axial positions. (d) Degeneracy is broken in biplane configuration, where PSF pairs with positive and negative vertical astigmatism aberrations are different at opposite axial positions. (e) Degeneracy is absent in single plane configuration with prior knowledge of astigmatism orientation, where PSFs with additional positive and negative primary spherical aberrations (1st Sph) are different at opposite axial positions. Scale bar in (c–e): 1 μm. (f) Setup diagram. M1–M8: mirrors in the excitation path; Di1–Di3: dichroic mirrors; AOTF: acousto-optic tunable filter; L1–L5: lenses in the excitation path; FM: flip mirror; MLS: mercury light source; Obj: objective lens; M1’–M11’: mirrors in the emission path; TL: tube lens; L1’–L6’: lenses in the emission path; DM: deformable mirror; BS: 50/50 non-polarizing beam splitter; SM: 90° specialty mirror; FW: filter wheel. Nominal focal lengths of lenses are, L1: 19 mm, L2: 19 mm, L3: 20 mm, L4: 125 mm, L5: 400 mm, Obj: 1.8 mm, TL: 180 mm, L1’: 88.9 mm, L2’: 250 mm, L3’: 400 mm, L4’: 150 mm, L5’: 500 mm, L6’: 250 mm. (g) Definition of biplane distance. The objective lens is moved axially to make plane 1 (case 1) and plane 2 (case 2) in focus successively. The axial movement is defined as biplane distance δ.
Extended Data Fig. 2. Performance quantification of INSPR in biplane setup.
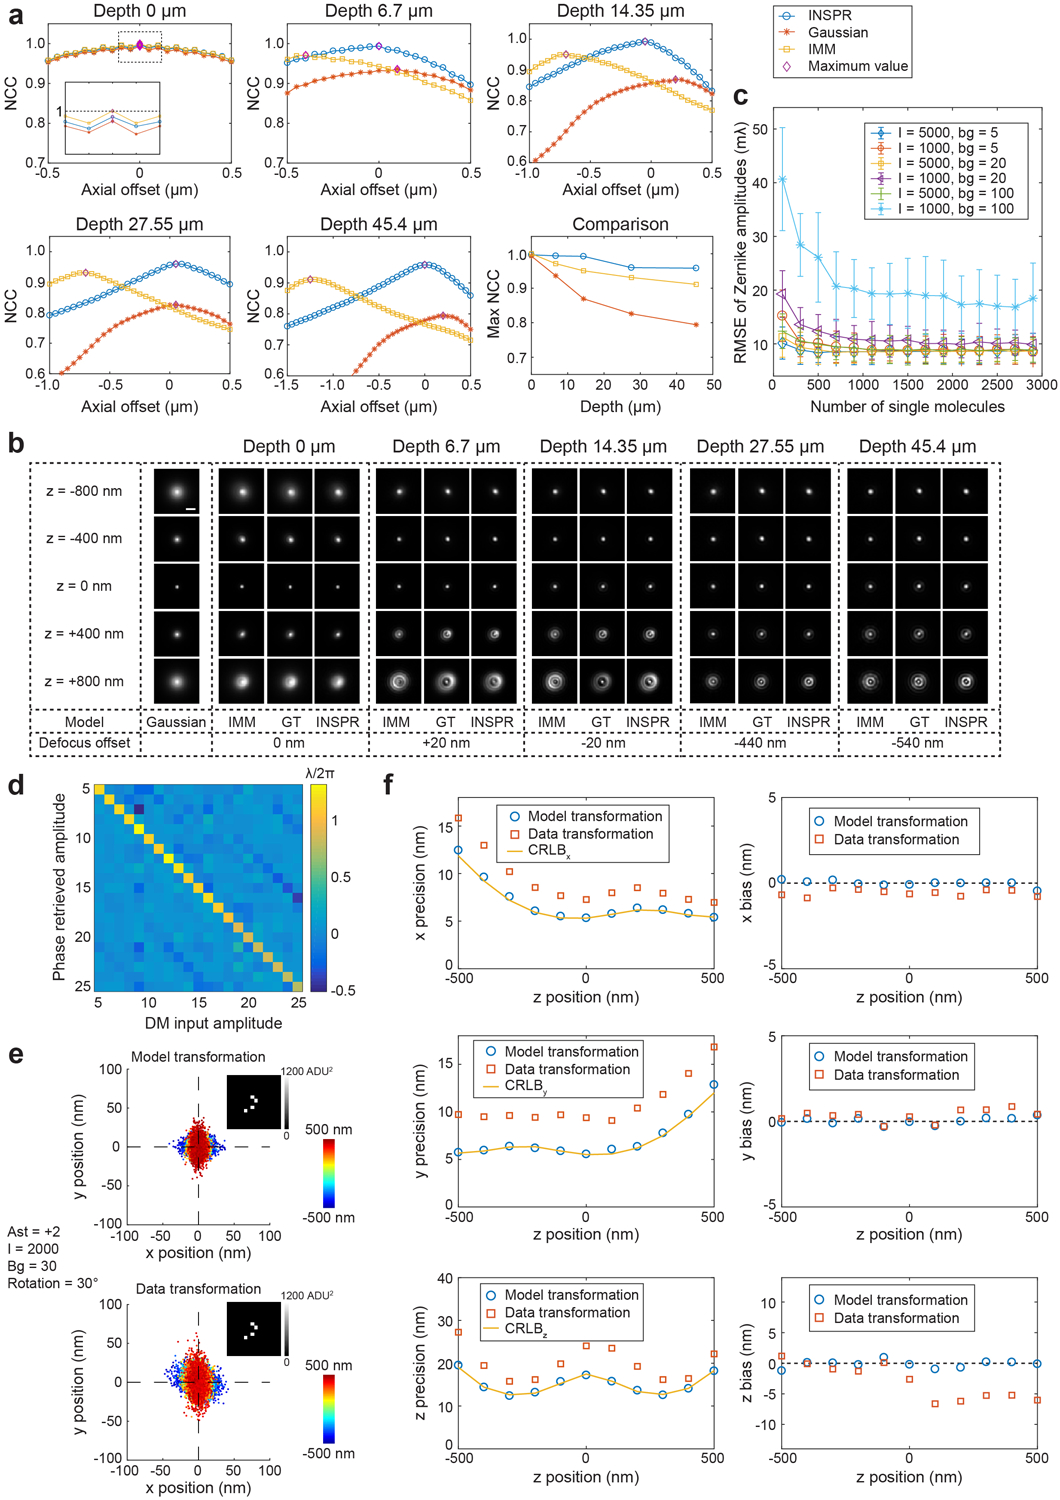
(a) Similarity between the ground truth 3D PSFs and the 3D PSFs at different imaging depths when using INSPR (blue circles), Gaussian model (orange stars), and theoretical index mismatch model (IMM, yellow squares). For each depth, 3D normalized cross correlation (NCC) coefficients between the ground truth PSFs and the PSFs generated using three methods at different axial offsets are shown, with the maximum values marked (purple diamonds). (b) 3D PSFs retrieved using Gaussian, IMM, and INSPR in comparison to the ground truth (GT) at different depths, when NCC reaches the maximum at each depth (purple diamonds in (a)). The defocus offset (i.e., the axial shift from the actual focal plane) is obtained by finding the maximum-intensity plane of the ground truth PSFs along the axial direction. Scale bar: 1 μm. (c) Root-mean-square error (RMSE) between the decomposed Zernike amplitudes of INSPR retrieved model and the ground truth amplitudes in different photon (I) and background (bg) conditions. In each condition, the amplitudes of the ground truth are randomly sampled from −1 to +1 (unit: λ/2π) for each trial (11 trials in total). (d) Heat map showing the relationship between the input and phase retrieved amplitudes of 21 Zernike modes. (e) Scatter plots of lateral localizations using model transformation (top) and data transformation (bottom) for PSFs with vertical astigmatism (Ast). The total photon count per emission event I is 2000, and the background count per pixel bg is 30. Plane 1 and plane 2 are related with an affine transformation including a rotation of 30 degrees. Both Poisson noise and pixel-dependent sCMOS readout noise (the variance distribution is shown in the inset) are considered. (f) Localization precisions and biases in the x, y, and z dimensions for the dataset in (e).
Extended Data Fig. 3. Blind reconstruction of 3D training datasets of microtubules (MT0.N1.LD) from the SMLM challenge.
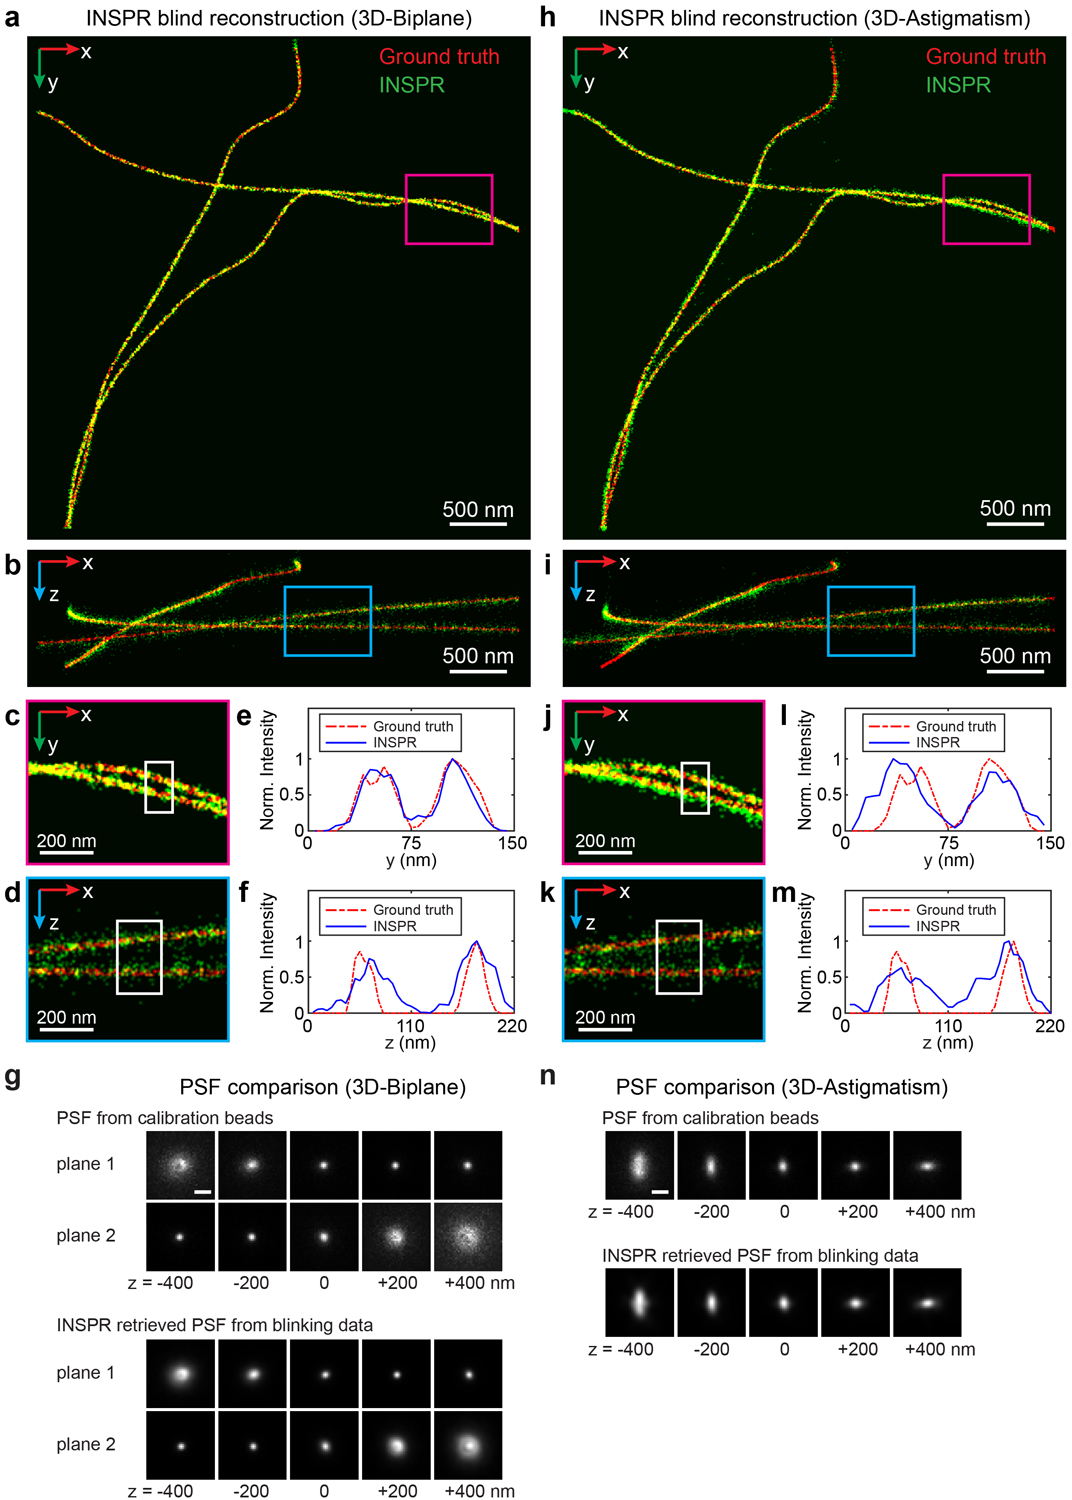
(a,b) x-y and x-z overviews of the microtubules resolved by INSPR from the 3D-Biplane data. (c,d) Enlarged x-y and x-z views of the areas as indicated by the magenta and blue boxed regions in (a) and (b), respectively. (e,f) Intensity profiles along the y and z directions within the white boxed regions in (c,d), comparing the INSPR resolved profiles (blue solid lines) with the ground truth (red dash-dot lines). (g) x-y views of the provided calibration PSF (3D-Biplane, top rows) and the INSPR retrieved PSF from blinking data (bottom rows). (h,i) x-y and x-z overviews of the microtubules resolved by INSPR from the 3D-Astigmatism data. (j,k) Enlarged x-y and x-z views of the areas as indicated by the magenta and blue boxed regions in (h) and (i), respectively. (l,m) Intensity profiles along the y and z directions within the white boxed regions in (j,k), comparing the INSPR resolved profiles (blue solid lines) with the ground truth (red dash-dot lines). (n) x-y views of the provided calibration PSF (3D-Astigmatism, top rows) and the INSPR retrieved PSF from blinking data (bottom rows). Scale bar in (g,n): 1 μm. Norm.: normalized.
Extended Data Fig. 4. 3D super-resolution reconstructions of immunofluorescence-labeled TOM20 in COS-7 cells using INSPR, ZOLA-3D, and cubic spline in astigmatism-based setup.
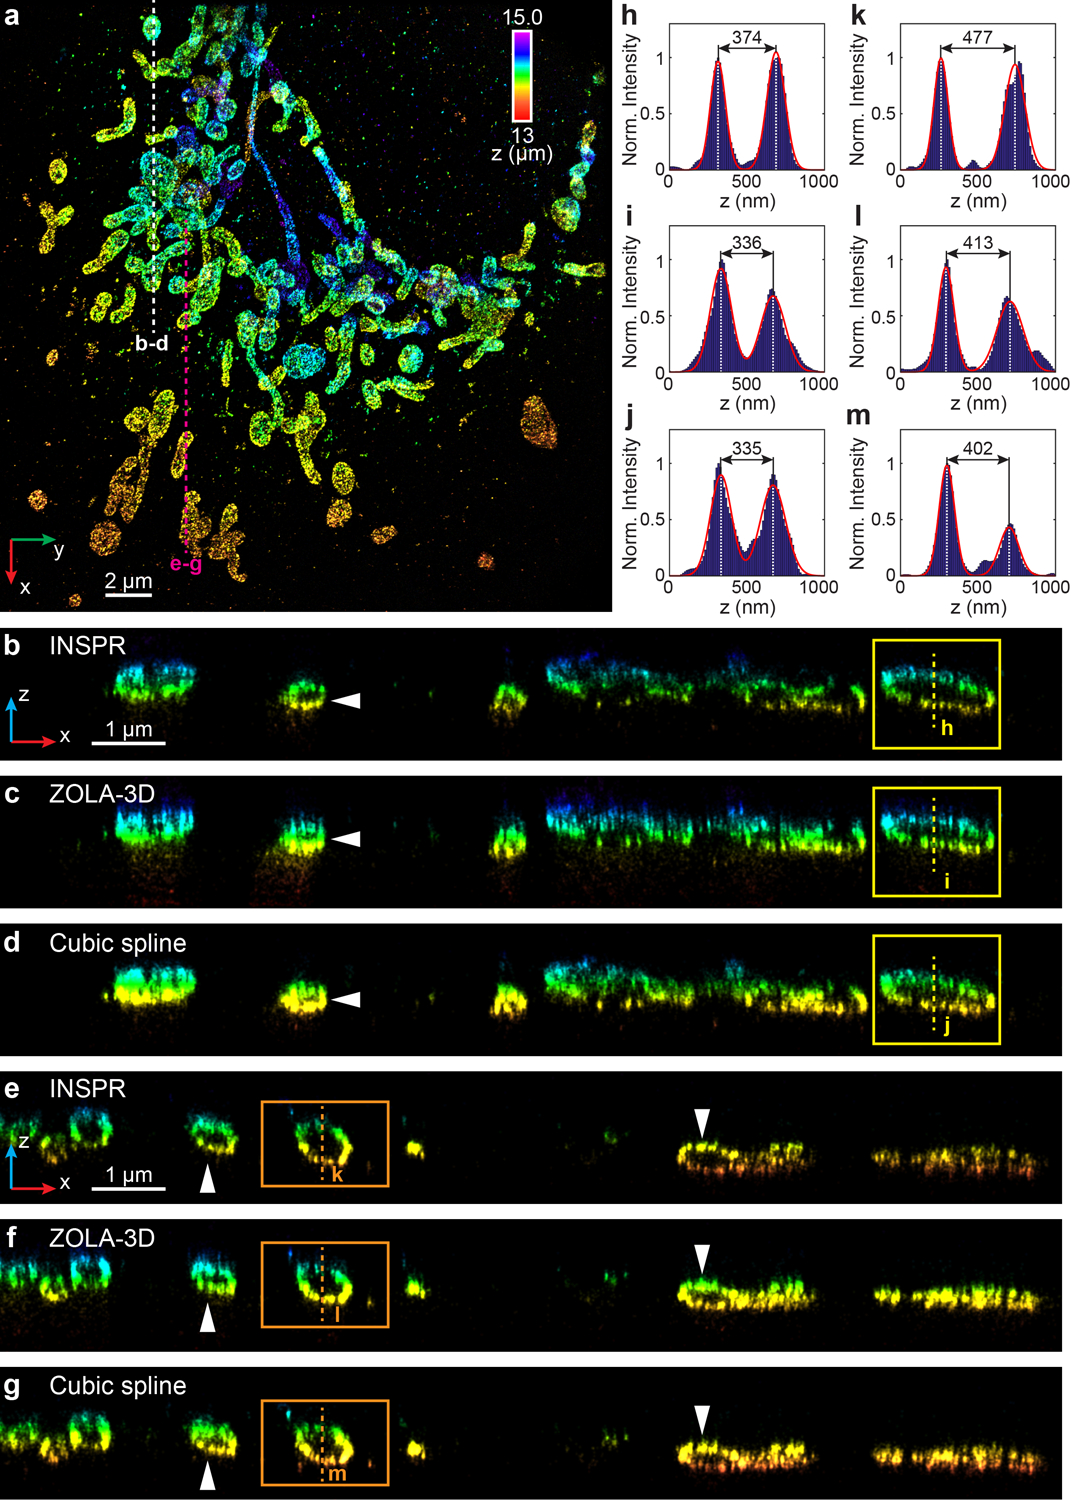
(a) x-y overview of the mitochondrial network resolved by INSPR, with a depth of 13 μm from the coverslip. (b–d) x-z slices along the white dashed line in (a), reconstructed using INSPR (b), ZOLA-3D which considers PSF distortions inside the refractive index mismatched medium (c), and cubic spline from beads on the coverslip (d). The white arrows and yellow boxes highlight the differences in axial reconstructions among three methods. (e–g) x-z slices along the magenta dashed line in (a), reconstructed using INSPR (e), ZOLA-3D (f), and cubic spline (g). The white arrows and orange boxes highlight the differences in axial reconstructions among three methods. (h–j) Intensity profiles along the yellow dashed lines in (b–d), showing the difference in the axial width of the outer membrane contour is 10% for both ZOLA-3D and cubic spline as compared to INSPR. (k–m) Intensity profiles along the orange dashed lines in (e–g), showing the differences in the axial width of the outer membrane contour are 13% and 16% for ZOLA-3D and cubic spline as compared to INSPR, respectively. The integration width of the x-z slices in (b–g) in the y direction is 200 nm. The dataset shown is representative of four datasets of mitochondria with depths of ~13 μm from the coverslip. Norm.: normalized.
Extended Data Fig. 5. 3D super-resolution reconstructions of immunofluorescence-labeled TOM20 in COS-7 cells using INSPR and microsphere-calibrated Gaussian fitting in astigmatism-based setup.
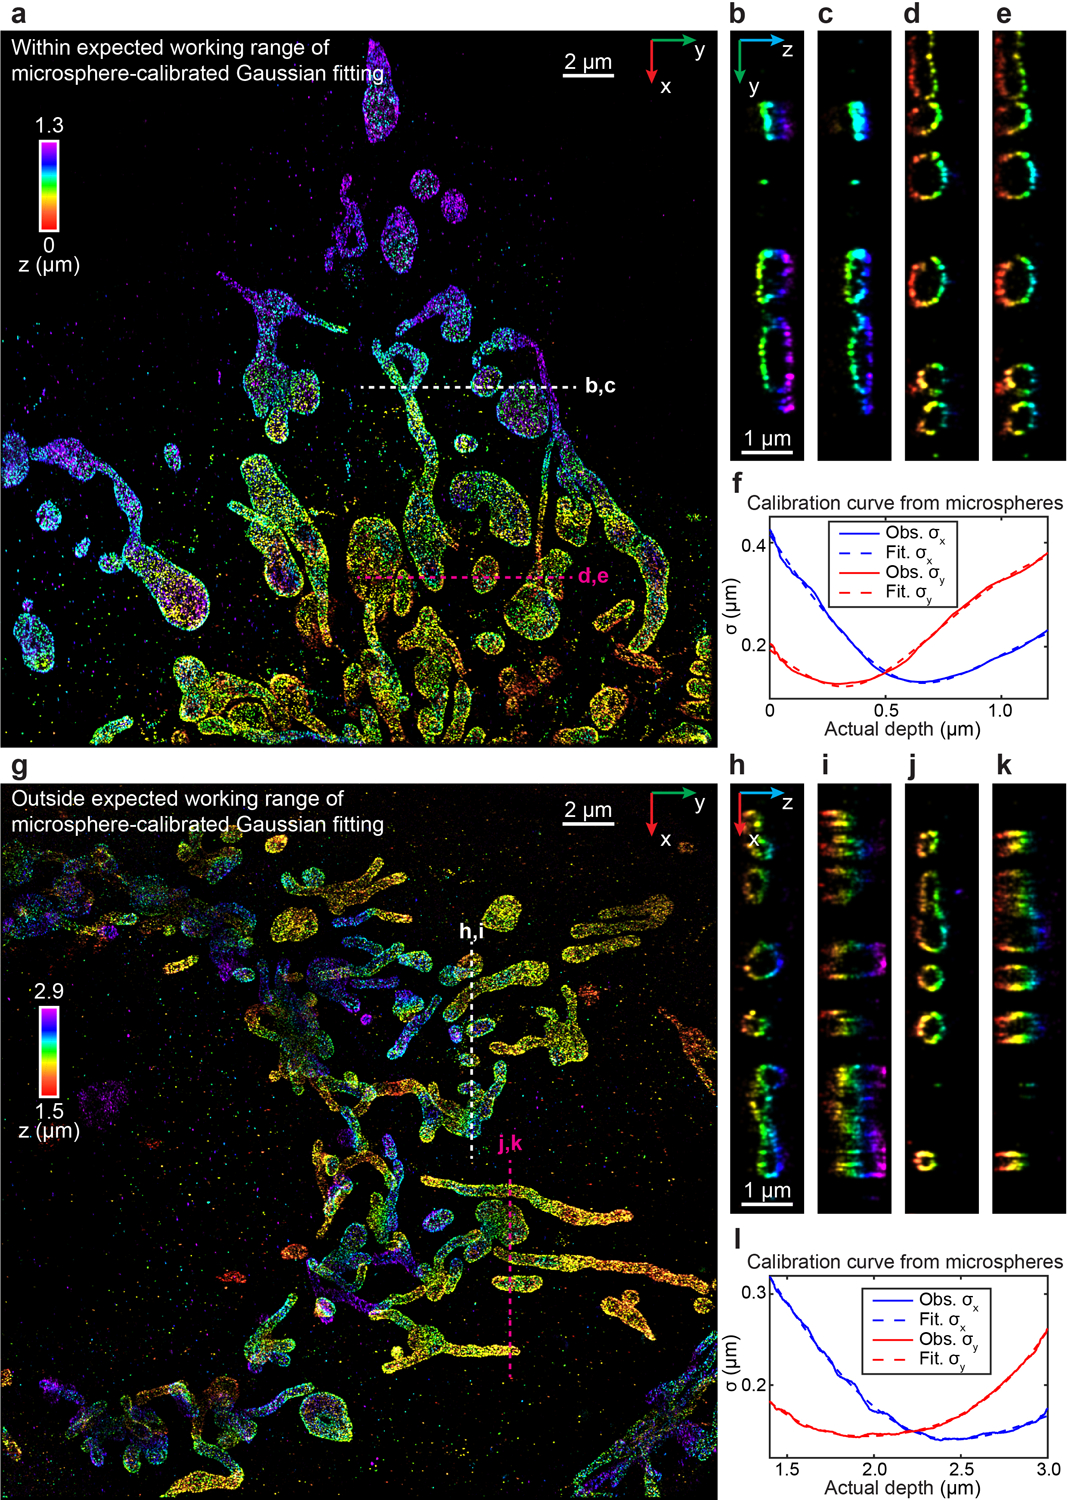
(a) x-y overview of the mitochondrial network resolved by INSPR on the bottom coverslip, within the expected working range of microsphere-calibrated Gaussian fitting. (b–e) y-z slices along the white and magenta dashed lines in (a), reconstructed using INSPR (b,d) and microsphere-calibrated Gaussian fitting (c,e). (f) Calibration curves showing σx and σy observed (solid lines) and fitted (dashed lines) obtained from the blinking data of microspheres as a function of the depth from the bottom coverslip. The crossover point of σx and σy is at the depth of 0.5 μm. (g) x-y overview of the mitochondrial network resolved by INSPR with a depth of 1.5 μm from the bottom coverslip, outside the working range of microsphere-calibrated Gaussian fitting. (h–k) x-z slices along the white and magenta dashed lines in (g), reconstructed using INSPR (h,j) and microsphere-calibrated Gaussian fitting (i,k). (l) Calibration curves showing σx and σy observed (solid lines) and fitted (dashed lines) obtained from the blinking data of microspheres as a function of the depth from the bottom coverslip. The crossover point of σx and σy is at the depth of 2.2 μm. The integration width of the slices in (b–e, h–k) in the third dimension is 200 nm. The datasets shown are representative of four datasets of mitochondria on the coverslip and four datasets of mitochondria with depths of ~1.5 μm from the coverslip. Obs.: observed. Fit.: fitted.
Extended Data Fig. 6. 3D super-resolution reconstructions of immunofluorescence-labeled TOM20 in COS-7 cells using INSPR and the in vitro method in biplane setup.
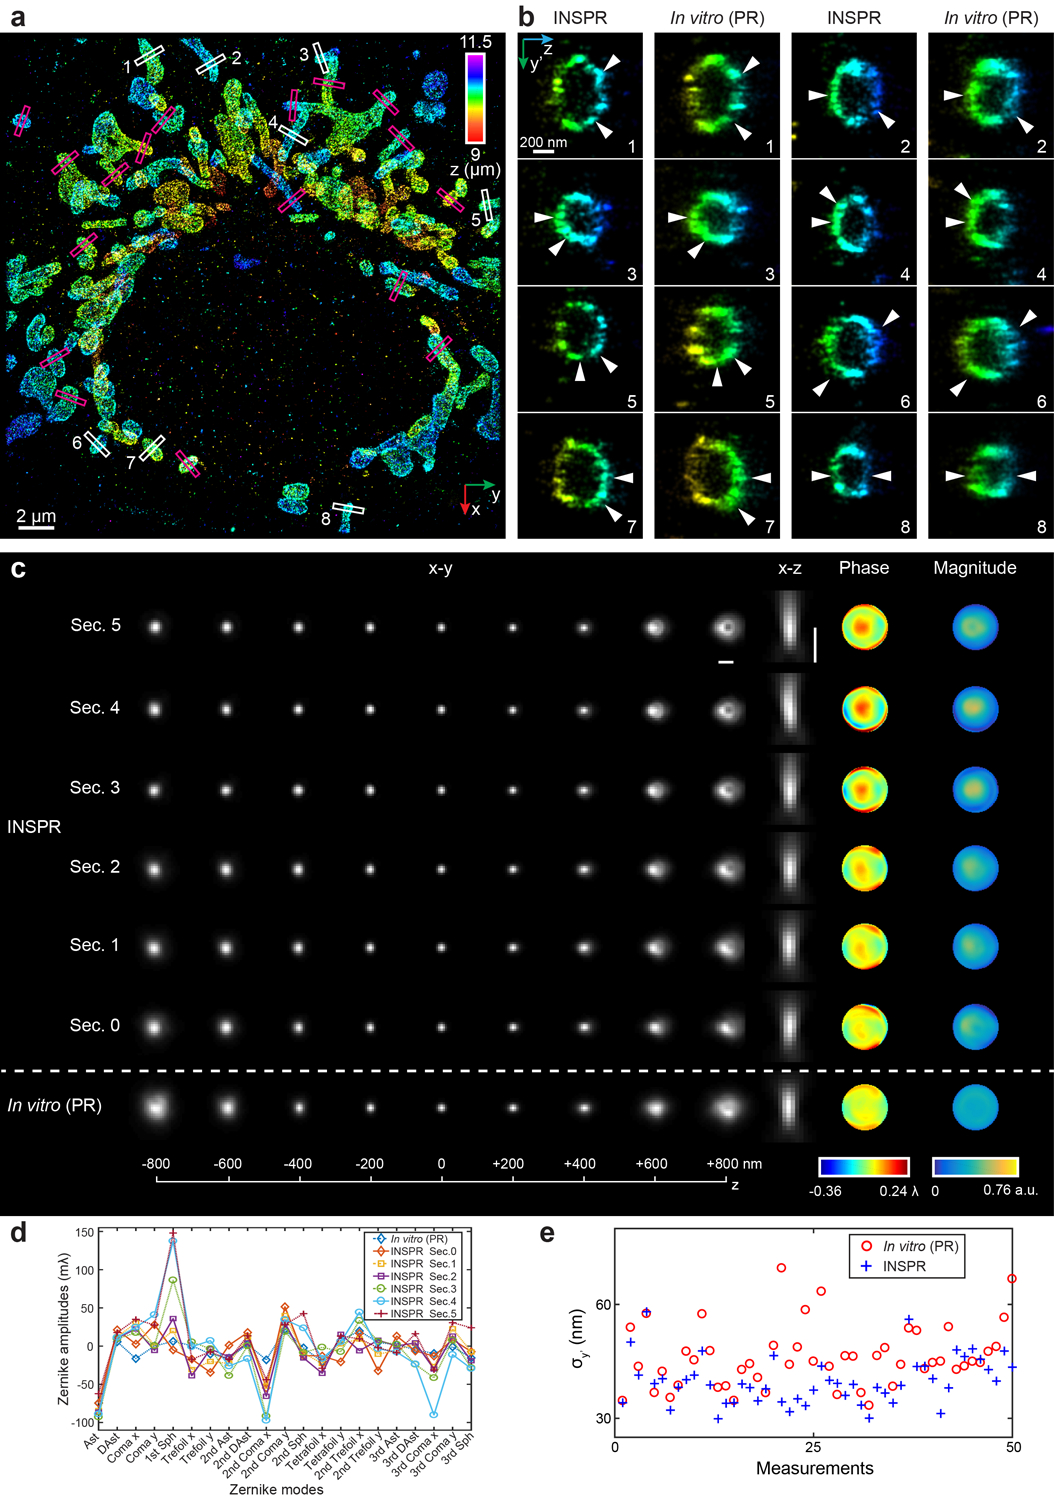
(a) x-y overview of the mitochondrial network showing the positions of 25 typical outer membrane contours as indicated by the magenta and white boxed regions. (b) Enlarged y’-z views of the outer membrane structures as indicated by the white boxed regions in (a), showing the reconstructed images using INSPR (left) and phase retrieval based on beads on the coverslip (in vitro (PR), right). Here the orientation of the cross section is rotated to allow projection of the 3D membrane bounded structures to the 2D image. (c) x-y and x-z views of the PSFs retrieved by INSPR in different optical sections and those retrieved by in vitro PR, as well as the phase and magnitude of the corresponding pupils. Scale bar: 1 μm. (d) Amplitudes of 21 Zernike modes (Wyant order, from vertical astigmatism to tertiary spherical aberration) decomposed from the pupils retrieved by INSPR and in vitro PR. (e) Distribution of σy’ obtained from the intensity profiles of 25 typical outer membranes in (a) reconstructed using INSPR (blue plus signs) and in vitro PR (red circles). Sec.: optical section.
Extended Data Fig. 7. 3D super-resolution reconstructions of immunofluorescence-labeled Nup98 in COS-7 cells using INSPR and the in vitro method in biplane setup.
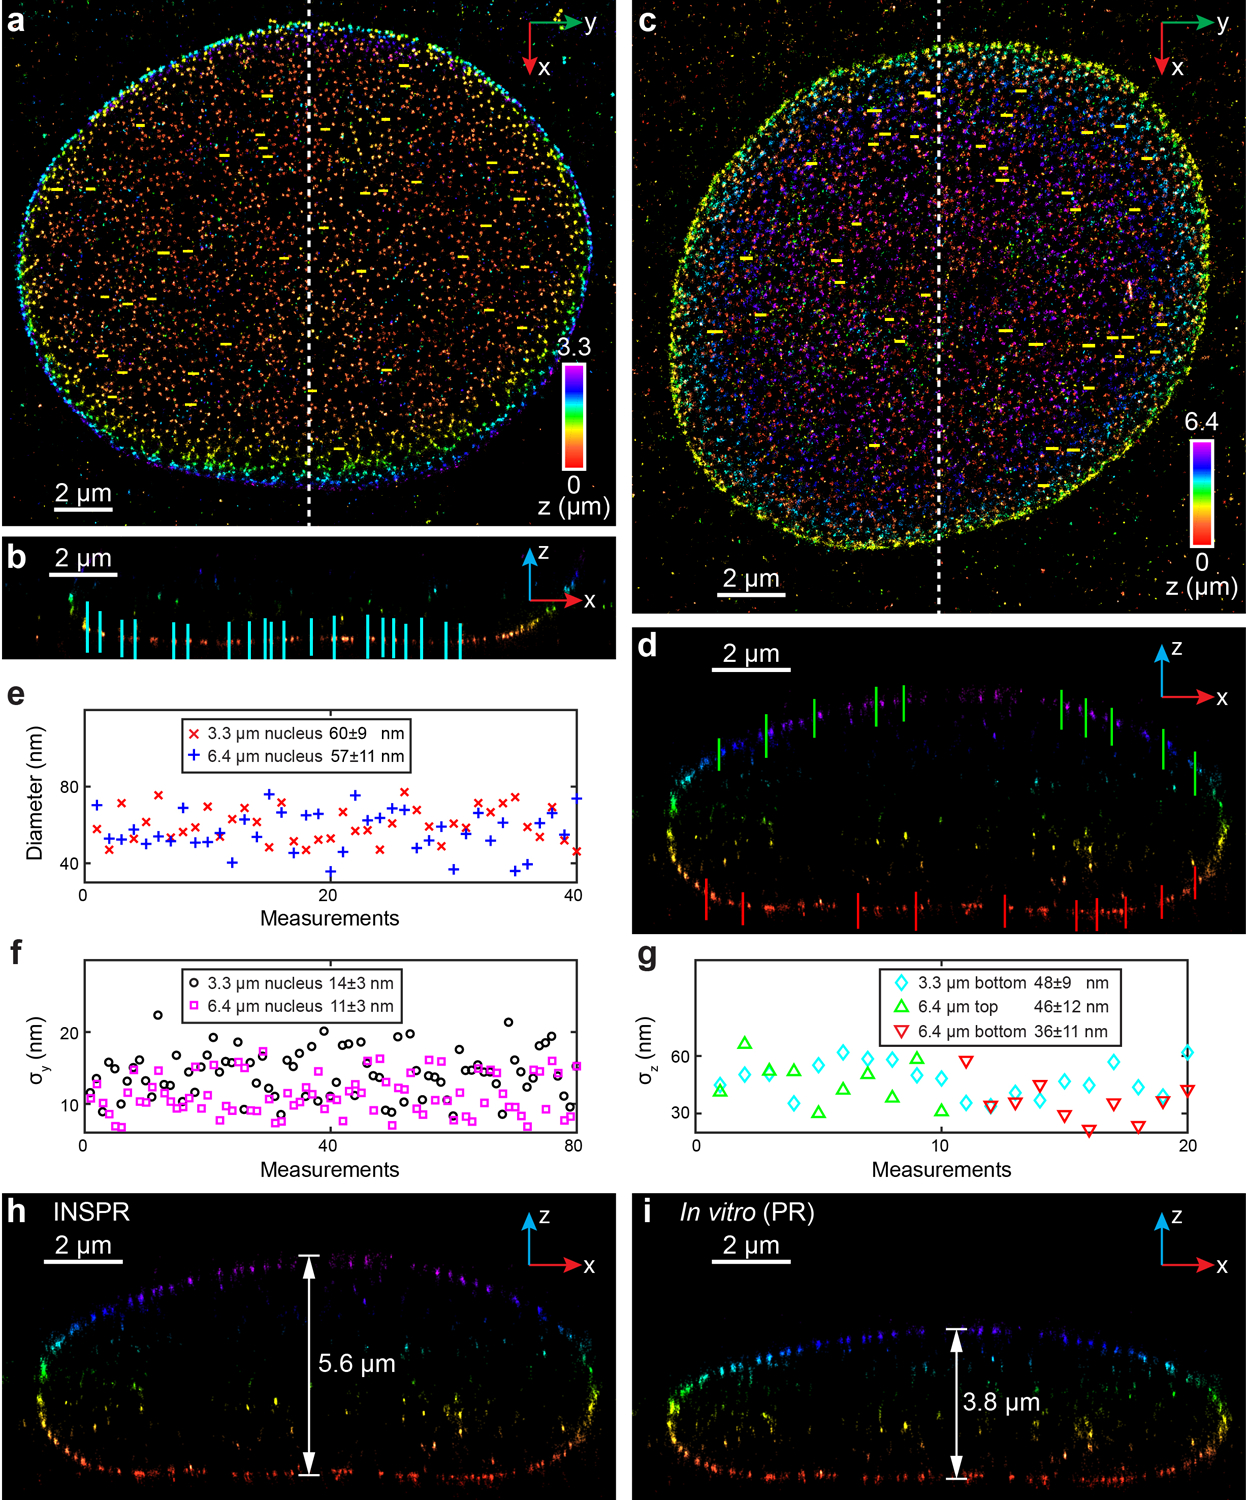
(a) x-y overview of the 3.3-μm-thick volume of the nucleus showing the positions of 40 typical Nup98 structures (yellow lines). (b) x-z slice along the white dashed line in (a), showing the positions of 20 typical Nup98 structures (cyan lines). (c) x-y overview of the 6.4-μm-thick entire nuclear envelope showing the positions of 40 typical Nup98 structures (yellow lines). (d) x-z slice along the white dashed line in (c), showing the positions of 10 typical Nup98 structures on the top (green lines) and bottom (red lines) surfaces. (e) Distribution of diameters measured from Nup98 structures in the x-y plane shown in (a,c). The diameter is 60±9 nm for the 3.3-μm-thick volume (mean±std, 40 measurements, red crosses), and 57±11 nm for the 6.4-μm-thick volume (40 measurements, blue plus signs). (f) Distribution of σy measured from Nup98 structures in the x-y plane shown in (a,c). σy is 14±3 nm for the 3.3-μm-thick volume (80 measurements, black circles), and 11±3 nm for the 6.4-μm-thick volume (80 measurements, magenta squares). (g) Distribution of σz measured from Nup98 structures in the x-z plane shown in (b,d). For the 3.3-μm-thick volume, σz is 48±9 nm (20 measurements, cyan diamonds). For the 6.4-μm-thick volume, σz is 46±12 nm for the top surface (10 measurements, green upward-pointing triangles), and 36±11 nm for the bottom surface (10 measurements, red downward-pointing triangles). (h,i) x-z slice along the white dashed line in (c), reconstructed using INSPR (h) and in vitro phase retrieval based on beads on the coverslip (in vitro (PR), i). The integration width of the x-z slices in (b,d,h,i) in the y direction is 500 nm.
Extended Data Fig. 8. 3D super-resolution reconstructions of immunofluorescence-labeled ChR2-EYFP on dendrites using INSPR and in vitro methods in biplane setup (depth: 2 – 6.2 μm).
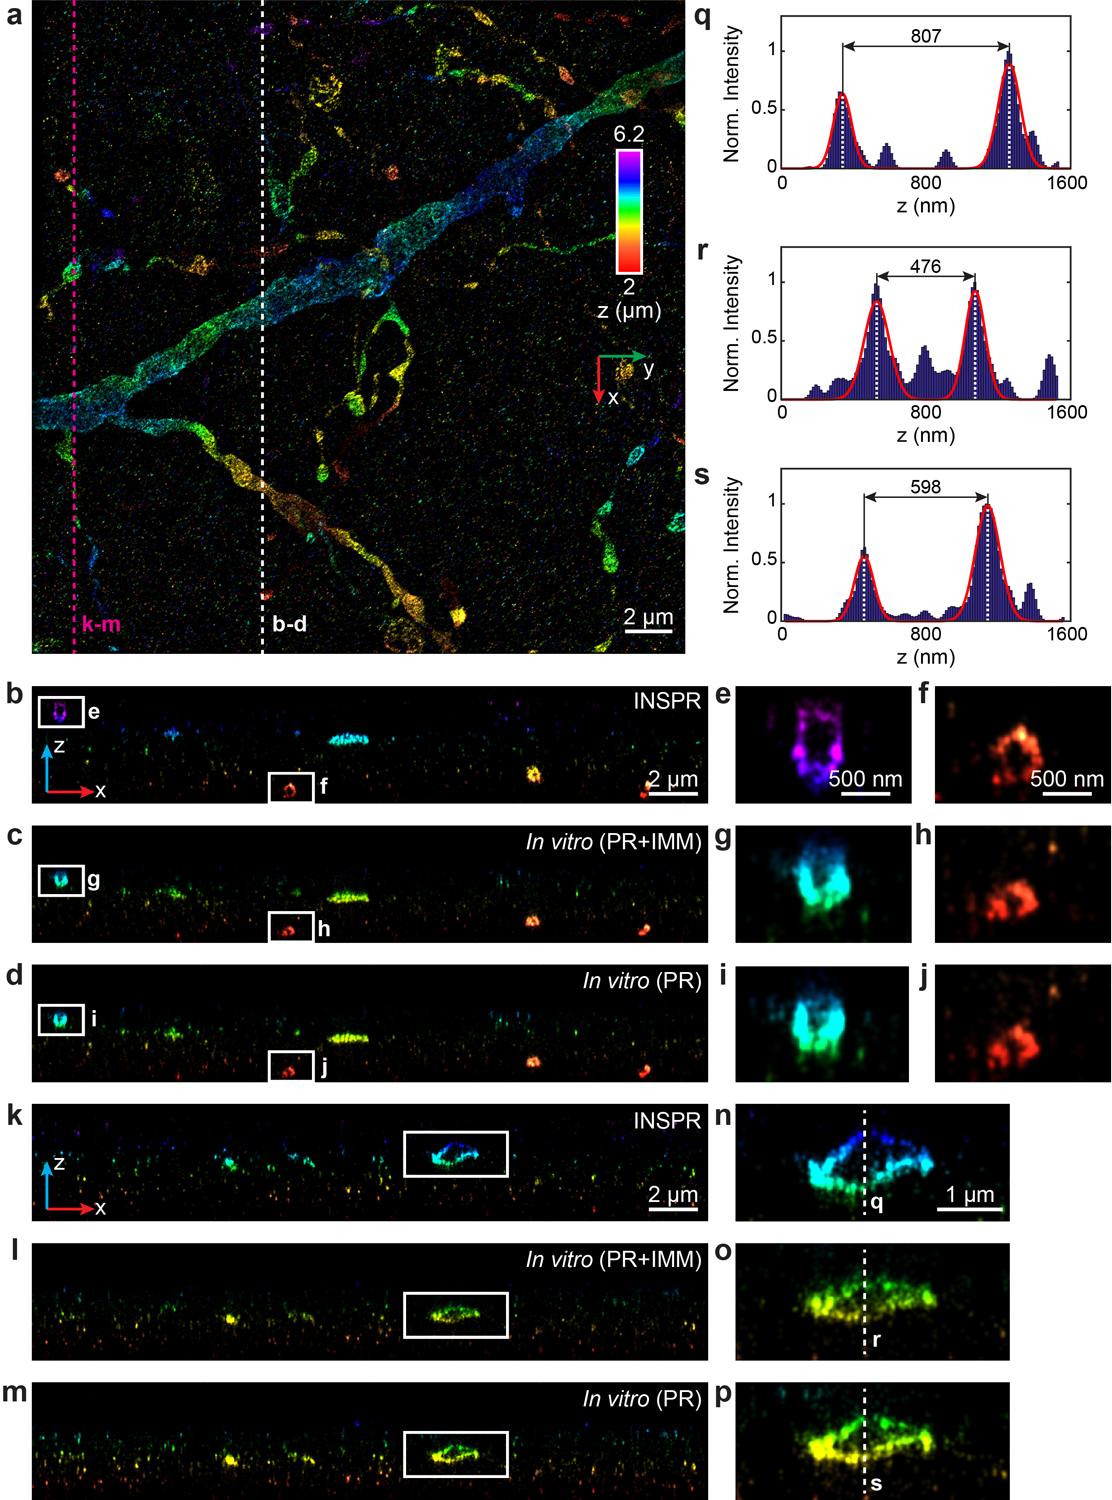
(a) x-y overview of the super-resolution volume of immunofluorescence-labeled ChR2-EYFP on dendrites resolved by INSPR, with a depth of 2 μm from the coverslip. (b–d) x-z slices along the white dashed line in (a), reconstructed using INSPR (b), phase retrieval method based on beads on the coverslip with theoretical index mismatch model (PR+IMM, c), and phase retrieval method based on beads on the coverslip (PR, d). (e–j) Zoomed in x-z views of the areas as indicated by the white boxed regions in (b–d). (k–m) x-z slices along the magenta dashed line in (a), reconstructed using INSPR (k), PR+IMM (l), and PR (m). (n–p) Zoomed in x-z views of the areas as indicated by the white boxed regions in (k–m). (q–s) Intensity profiles along the white dashed lines in (n–p), showing the differences in the axial width of the selected contour are 41% and 26% for PR+IMM and PR as compared to INSPR, respectively. The integration width of the x-z slices in (b–p) in the y direction is 200 nm. Norm.: normalized.
Extended Data Fig. 9. 3D super-resolution reconstructions of immunofluorescence-labeled ChR2-EYFP on dendrites using INSPR and phase retrieval method based on beads embedded in agarose gel in biplane setup.
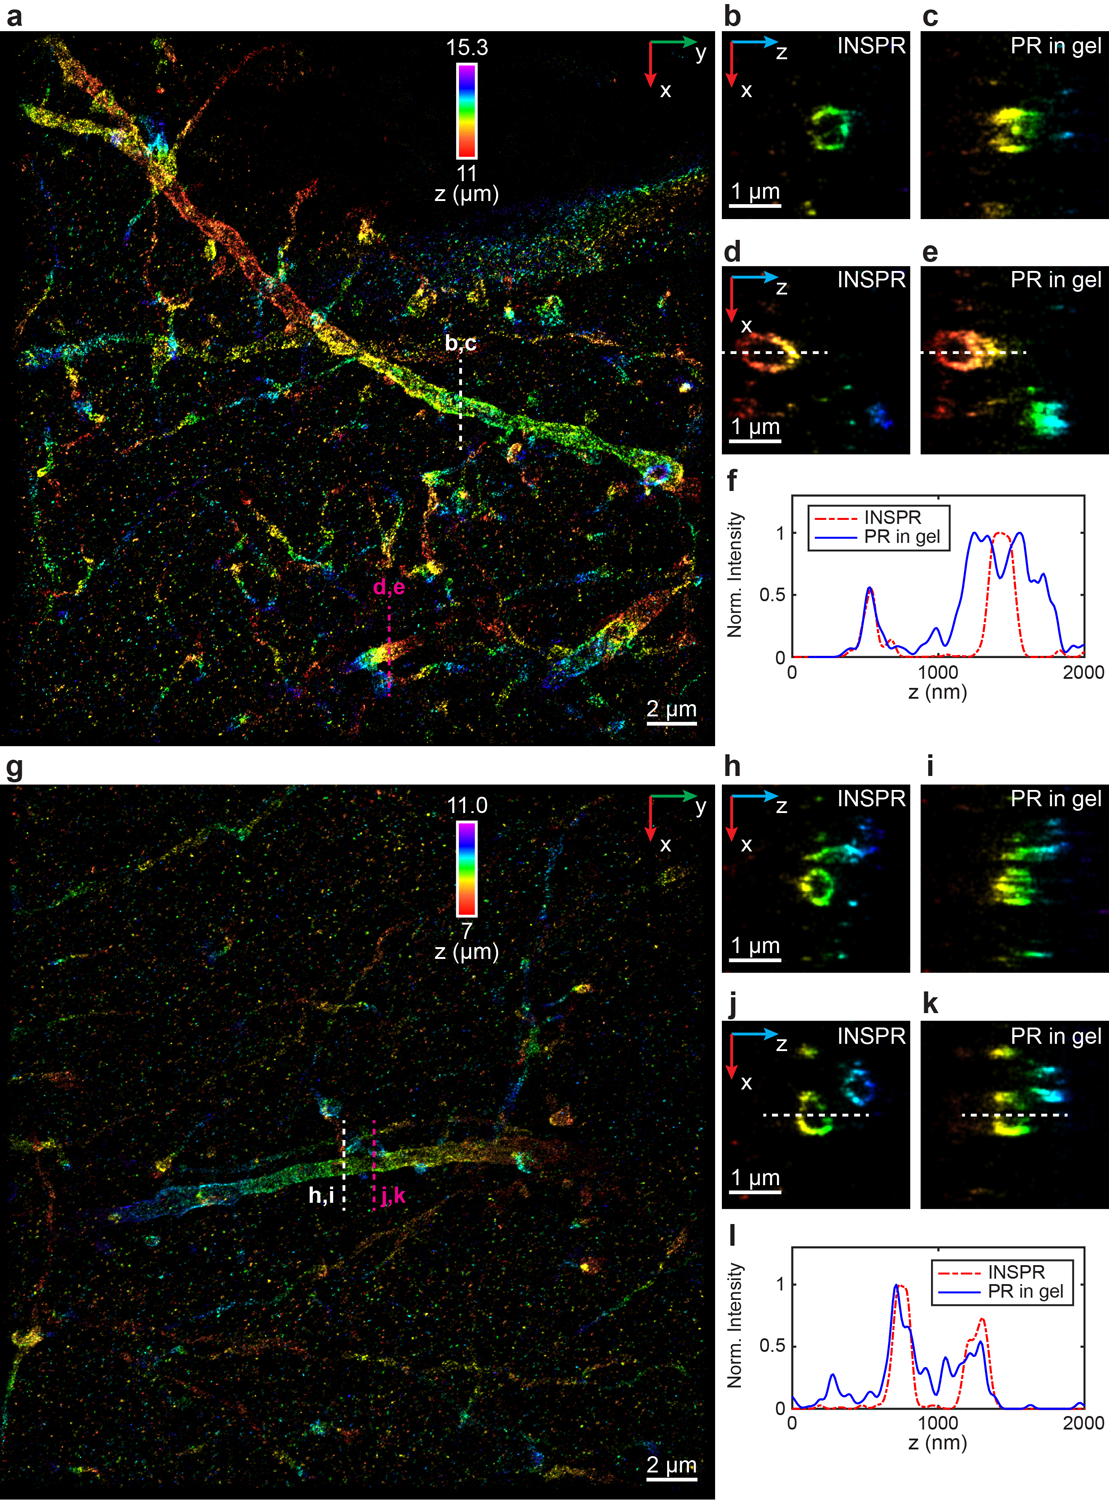
(a) x-y overview of the super-resolution volume of immunofluorescence-labeled ChR2-EYFP on dendrites resolved by INSPR, with a depth of 11 μm from the coverslip. (b–e) x-z slices along the white and magenta dashed lines in (a), reconstructed using INSPR (b,d) and phase retrieval method based on beads embedded in agarose gel (PR in gel, c,e). (f) Intensity profiles along the white dashed lines in (d,e), showing the difference between reconstructions using INSPR (red dash-dot lines) and PR in gel (blue solid lines). (g) x-y overview of the super-resolution volume of immunofluorescence-labeled ChR2-EYFP on dendrites resolved by INSPR, with a depth of 7 μm from the coverslip. (h–k) x-z slices along the white and magenta dashed lines in (g), reconstructed using INSPR (h,j) and PR in gel (i,k). (l) Intensity profiles along the white dashed lines in (j,k), showing the difference between reconstructions using INSPR (red dash-dot lines) and PR in gel (blue solid lines). The integration width of the x-z slices in (b–e, h–k) in the y direction is 200 nm. These experiments are performed twice and both of them are shown here. Norm.: normalized.
Extended Data Fig. 10. 3D super-resolution reconstructions of immunofluorescence-labeled elastic fibers in developing cartilage using INSPR and in vitro methods in biplane setup.
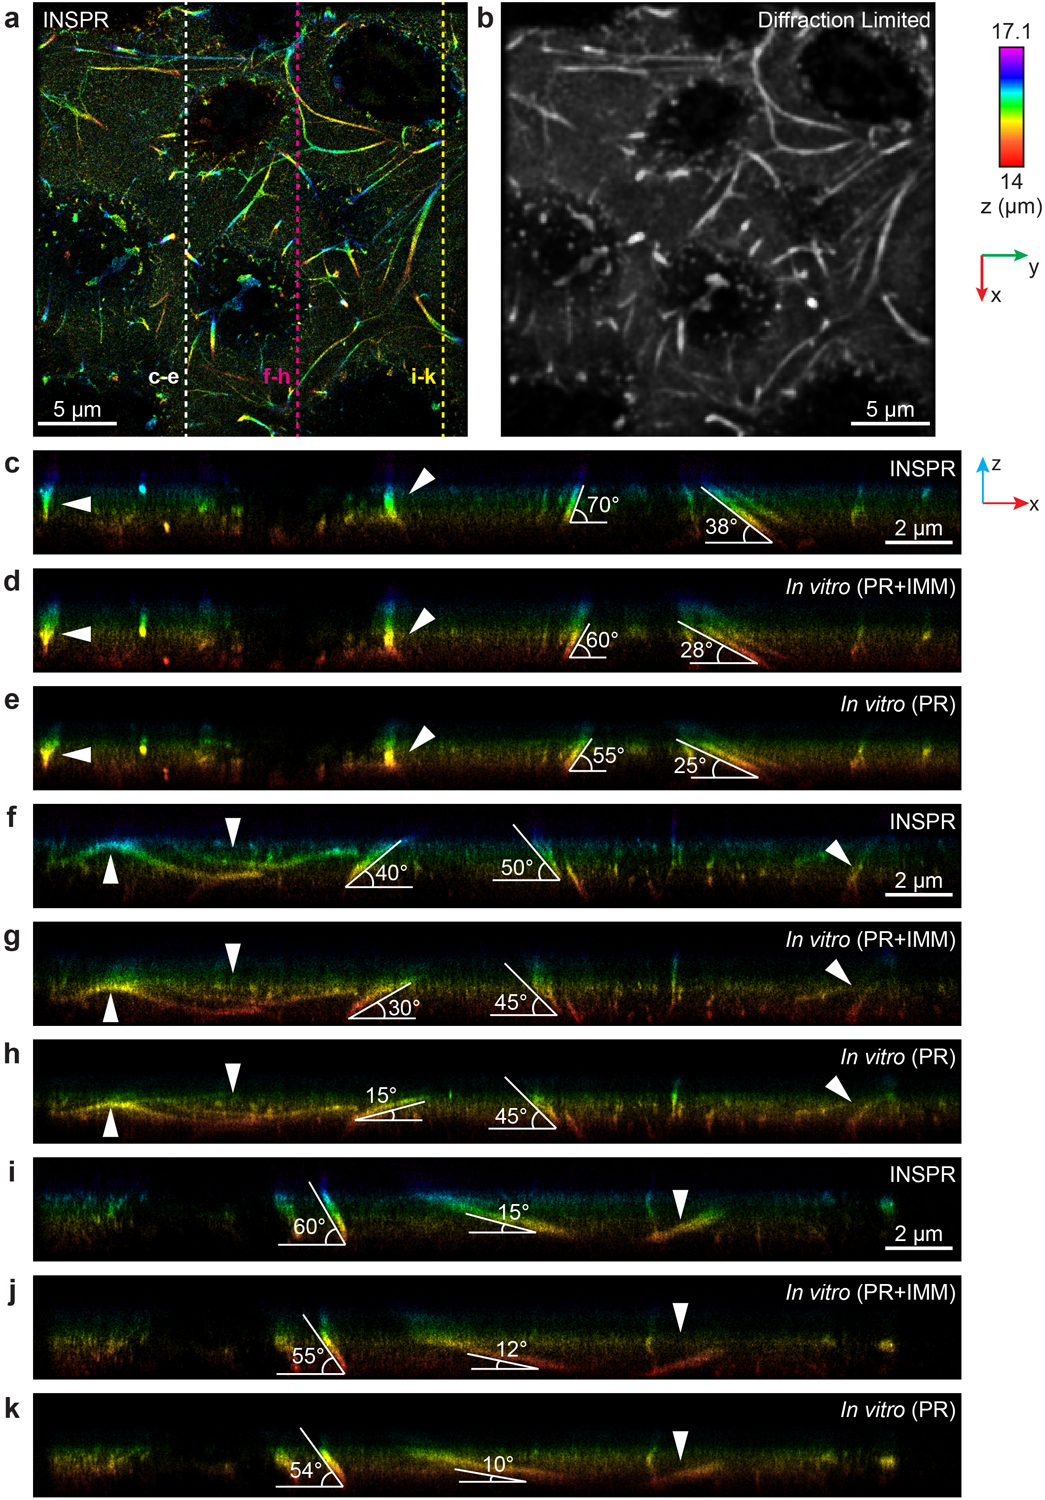
(a) x-y overview of the reconstructed volume of immunofluorescence-labeled elastic fibers in developing cartilage using INSPR. (b) Diffraction-limited image of (a). (c–k) x-z slices along the white, magenta, and yellow dashed lines in (a), reconstructed using INSPR (c,f,i), phase retrieval method based on beads on the coverslip with theoretical index mismatch model (PR+IMM, d,g,j), and phase retrieval method based on beads on the coverslip (PR, e,h,k). The integration width of the x-z slices in the y direction is 2 μm.
Supplementary Material
Acknowledgements
We would like to thank Karthigeyan Dhanasekaran and Patrick Lusk (Yale University) for sharing the labeling protocol of Nup98 and interpretation of the resolved Nup98 structures. We thank Michael J. Mlodzianoski for initial instrument design, Sha An for help in instrument alignment and sample preparation, and David A. Miller for providing labeling protocols of mitochondria and microtubules. F.X., D.M., S.L., C.B., and F.H. were supported by grants from the NIH (R35GM119785) and DARPA (D16AP00093). K.P.M. and G.E.L were supported by grants from the NIH (RF1AG051495 and RF1AG050597). Y.B. and S.C. were supported by a grant from the NIH (R01AR071359). Y.W. and P.Y. were supported by a grant from the NIH (1R01EB018659) and Harvard Medical School Dean’s Initiative Grant.
Footnotes
Competing interests
F.X., D.M., and F.H. are inventors on patent application submitted by Purdue University that covers basic principles of INSPR.
References
- 1.Hell SW & Wichmann J Breaking the diffraction resolution limit by stimulated emission: stimulated-emission-depletion fluorescence microscopy. Opt. Lett 19, 780–782 (1994). [DOI] [PubMed] [Google Scholar]
- 2.Wu Y & Shroff H Faster, sharper, and deeper: structured illumination microscopy for biological imaging. Nat. Methods 15, 1011–1019 (2018). [DOI] [PubMed] [Google Scholar]
- 3.Betzig E et al. Imaging intracellular fluorescent proteins at nanometer resolution. Science 313, 1642–1645 (2006). [DOI] [PubMed] [Google Scholar]
- 4.Hess ST, Girirajan TPK & Mason MD Ultra-high resolution imaging by fluorescence photoactivation localization microscopy. Biophys. J 91, 4258–4272 (2006). [DOI] [PMC free article] [PubMed] [Google Scholar]
- 5.Rust MJ, Bates M & Zhuang X Sub-diffraction-limit imaging by stochastic optical reconstruction microscopy (STORM). Nat. Methods 3, 793–796 (2006). [DOI] [PMC free article] [PubMed] [Google Scholar]
- 6.Huang F et al. Ultra-high resolution 3D imaging of whole cells. Cell 166, 1028–1040 (2016). [DOI] [PMC free article] [PubMed] [Google Scholar]
- 7.Liu T-L et al. Observing the cell in its native state: imaging subcellular dynamics in multicellular organisms. Science 360, eaaq1392 (2018). [DOI] [PMC free article] [PubMed] [Google Scholar]
- 8.Guo Y et al. Visualizing intracellular organelle and crytoskeletal interactions at nanoscale resolution on millisecond timescales. Cell 175, 1430–1442 (2018). [DOI] [PubMed] [Google Scholar]
- 9.Schlichthaerle T et al. Direct visualization of single nuclear pore complex proteins using genetically-encoded probes for DNA-PAINT. Angew. Chem. Int. Ed 58, 1–6 (2019). [DOI] [PMC free article] [PubMed] [Google Scholar]
- 10.Juette MF et al. Three-dimensional sub-100 nm resolution fluorescence microscopy of thick samples. Nat. Methods 5, 527–529 (2008). [DOI] [PubMed] [Google Scholar]
- 11.Huang B, Wang W, Bates M & Zhuang X Three-dimensional super-resolution imaging by stochastic optical reconstruction microscopy. Science 319, 810–813 (2008). [DOI] [PMC free article] [PubMed] [Google Scholar]
- 12.Pavani SRP et al. Three-dimensional, single-molecule fluorescence imaging beyond the diffraction limit by using a double-helix point spread function. Proc. Natl. Acad. Sci. USA 106, 2995–2999 (2009). [DOI] [PMC free article] [PubMed] [Google Scholar]
- 13.Aquino D et al. Two-color nanoscopy of three-dimensional volumes by 4Pi detection of stochastically switched fluorophores. Nat. Methods 8, 353–359 (2011). [DOI] [PubMed] [Google Scholar]
- 14.Bon P et al. Self-interference 3D super-resolution microscopy for deep tissue investigations. Nat. Methods 15, 449–454 (2018). [DOI] [PubMed] [Google Scholar]
- 15.Sage D et al. Super-resolution fight club: assessment of 2D and 3D single-molecule localization microscopy software. Nat. Methods 16, 387–395 (2019). [DOI] [PMC free article] [PubMed] [Google Scholar]
- 16.Small A & Stahlheber S Fluorophore localization algorithms for super-resolution microscopy. Nat. Methods 11, 267–279 (2014). [DOI] [PubMed] [Google Scholar]
- 17.Nehme E, Weiss LE, Michaeli T & Shechtman Y Deep-STORM: super-resolution single-molecule microscopy by deep learning. Optica 5, 458–464 (2018). [Google Scholar]
- 18.Zhang P et al. Analyzing complex single-molecule emission patterns with deep learning. Nat. Methods 15, 913–916 (2018). [DOI] [PMC free article] [PubMed] [Google Scholar]
- 19.Liu S, Kromann EB, Krueger WD, Bewersdorf J & Lidke KA Three dimensional single molecule localization using a phase retrieved pupil function. Opt. Express 21, 29462–29487 (2013). [DOI] [PMC free article] [PubMed] [Google Scholar]
- 20.Petrov PN, Shechtman Y & Moerner WE Measurement-based estimation of global pupil functions in 3D localization microscopy. Opt. Express 25, 7945–7959 (2017). [DOI] [PMC free article] [PubMed] [Google Scholar]
- 21.Li Y et al. Real-time 3D single-molecule localization using experimental point spread functions. Nat. Methods 15, 367–369 (2018). [DOI] [PMC free article] [PubMed] [Google Scholar]
- 22.Li Y, Wu Y-L, Hoess P, Mund M & Ries J Depth-dependent PSF calibration and aberration correction for 3D single-molecule localization. Biomed. Opt. Express 10, 2708–2718 (2019). [DOI] [PMC free article] [PubMed] [Google Scholar]
- 23.Cabriel C, Bourg N, Dupuis G & Lévêque-Fort S Aberration-accounting calibration for 3D single-molecule localization microscopy. Opt. Lett 43, 174–177 (2018). [DOI] [PubMed] [Google Scholar]
- 24.Aristov A, Lelandais B, Rensen E, & Zimmer C ZOLA-3D allows flexible 3D localization microscopy over an adjustable axial range. Nat. Commun 9, 2409 (2018). [DOI] [PMC free article] [PubMed] [Google Scholar]
- 25.Booth MJ, Andrade D, Burke D, Patton B & Zurauskas M Aberrations and adaptive optics in super-resolution microscopy. Microscopy 64, 251–261 (2015). [DOI] [PMC free article] [PubMed] [Google Scholar]
- 26.Dempster AP, Laird NM & Rubin DB Maximum likelihood from incomplete data via the EM algorithm. J. R. Stat. Soc. Series B Methodol 39, 1–38 (1977). [Google Scholar]
- 27.Hartigan JA & Wong MA A k-means clustering algorithm. J. R. Stat. Soc. Series C Appl. Stat 28, 100–108 (1979). [Google Scholar]
- 28.Hanser BM, Gustafsson MGL, Agard DA & Sedat JW Phase-retrieved pupil functions in wide-field fluorescence microscopy. J. Microsc 216, 32–48 (2004). [DOI] [PubMed] [Google Scholar]
- 29.Prabhat P, Ram S, Ward ES, & Ober RJ Simultaneous imaging of different focal planes in fluorescence microscopy for the study of cellular dynamics in three dimensions. IEEE Trans. Nanobiosci 3, 237–242 (2004). [DOI] [PMC free article] [PubMed] [Google Scholar]
- 30.Huang F et al. Video-rate nanoscopy using sCMOS camera-specific single-molecule localization algorithms. Nat. Methods 10, 653–658 (2013). [DOI] [PMC free article] [PubMed] [Google Scholar]
- 31.Mlodzianoski MJ et al. Active PSF shaping and adaptive optics enable volumetric localization microscopy through brain sections. Nat. Methods 15, 583–586 (2018). [DOI] [PMC free article] [PubMed] [Google Scholar]
- 32.Jungmann R et al. Multiplexed 3D cellular super-resolution imaging with DNA-PAINT and Exchange-PAINT. Nat. Methods 11, 313–318 (2014). [DOI] [PMC free article] [PubMed] [Google Scholar]
- 33.Oakley H et al. Intraneuronal β-amyloid aggregates, neurodegeneration, and neuron loss in transgenic mice with five familial Alzheimer’s disease mutations: potential factors in amyloid plaque formation. J. Neurosci 26, 10129–10140 (2006). [DOI] [PMC free article] [PubMed] [Google Scholar]
- 34.Jay TR et al. Disease progression-dependent effects of TREM2 deficiency in a mouse model of Alzheimer’s disease. J. Neurosci 37, 637–647 (2017). [DOI] [PMC free article] [PubMed] [Google Scholar]
- 35.Hruska M, Henderson N, Marchand SJL, Jafri H, & Dalva MB Synaptic nanomodules underlie the organization and plasticity of spine synapses. Nat. Neurosci 21, 671–682 (2018). [DOI] [PMC free article] [PubMed] [Google Scholar]
- 36.Madisen L et al. A toolbox of Cre-dependent optogenetic transgenic mice for light-induced activation and silencing. Nat. Neurosci 15, 793–802 (2012). [DOI] [PMC free article] [PubMed] [Google Scholar]
- 37.Pasquali-Ronchetti I & Baccarani-Contri M Elastic fiber during development and aging. Microsc. Res. Tech 38, 428–435 (1997). [DOI] [PubMed] [Google Scholar]
- 38.Burke D, Patton B, Huang F, Bewersdorf J & Booth MJ Adaptive optics correction of specimen-induced aberrations in single-molecule switching microscopy. Optica 2, 177–185 (2015). [Google Scholar]
- 39.Ji N Adaptive optical fluorescence microscopy. Nat. Methods 14, 374–380 (2017). [DOI] [PubMed] [Google Scholar]
- 40.Power RM & Huisken J A guide to light-sheet fluorescence microscopy for multiscale imaging. Nat. Methods 14, 360–373 (2017). [DOI] [PubMed] [Google Scholar]
- 41.Legant WR et al. High-density three-dimensional localization microscopy across large volumes. Nat. Methods 13, 359–365 (2016). [DOI] [PMC free article] [PubMed] [Google Scholar]
- 42.Gradinaru V, Treweek J, Overton K & Deisseroth K Hydrogel-tissue chemistry: principles and applications. Annu. Rev. Biophys 47, 355–376 (2018). [DOI] [PMC free article] [PubMed] [Google Scholar]
- 43.Chen F, Tillberg PW & Boyden ES Expansion microscopy. Science 347, 543–548 (2015). [DOI] [PMC free article] [PubMed] [Google Scholar]
- 44.Douglass KM, Sieben C, Archetti A, Lambert A & Manley S Super-resolution imaging of multiple cells by optimized flat-field epi-illumination. Nat. Photonics 10, 705–708 (2016). [DOI] [PMC free article] [PubMed] [Google Scholar]
- 45.Stehr F, Stein J, Schueder F, Schwille P & Jungmann R Flat-top TIRF illumination boosts DNA-PAINT imaging and quantification. Nat. Commun 10, 1268 (2019). [DOI] [PMC free article] [PubMed] [Google Scholar]
- 46.Tokunaga M, Imamoto N & Sakata-Sogawa K Highly inclined thin illumination enables clear single-molecule imaging in cells. Nat. Methods 5, 159–161 (2008). [DOI] [PubMed] [Google Scholar]
- 47.McGorty R, Kamiyama D & Huang B Active microscope stabilization in three dimensions using image correlation. Opt. Nanoscopy 2, 3 (2013). [DOI] [PMC free article] [PubMed] [Google Scholar]
Associated Data
This section collects any data citations, data availability statements, or supplementary materials included in this article.
Supplementary Materials
Data Availability Statement
The data that support the findings of this study are available from the corresponding authors upon request. Example data are available in software packages. 3D point clouds resolved by INSPR for Supplementary Videos 4–9 are provided from figshare (https://doi.org/10.6084/m9.figshare.11962764).


