. 2020 May 26;9:e57410. doi: 10.7554/eLife.57410

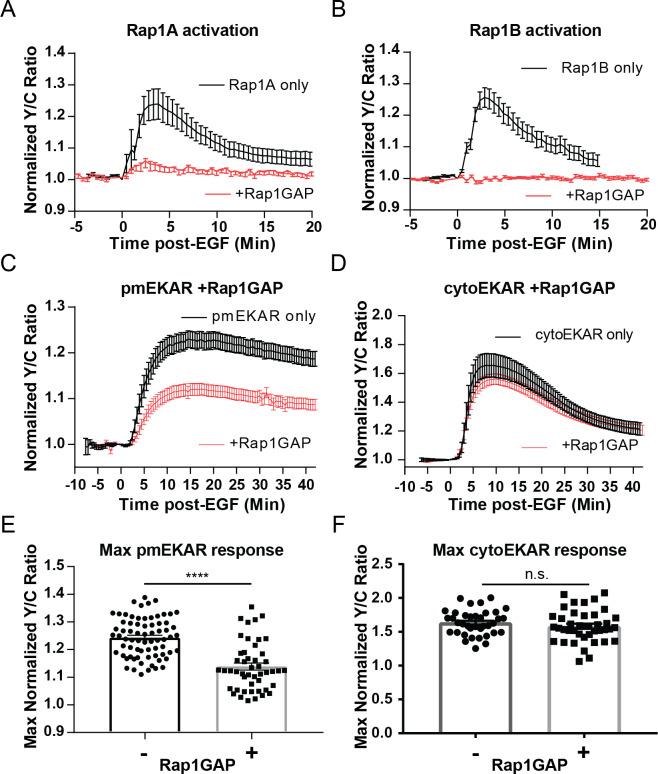
Figure 3. Rap1 GTPase regulates EGF-induced ERK activity at the plasma membrane.

Cells expressing either (A) diffusible Rap1A FLARE (n = 11) or (B) diffusible Rap1B FLARE (n = 9) were treated with EGF at time 0, increase in yellow over cyan (Y/C) emission ratio indicates Rap1 activation. The observed increases in ratio are abrogated by co-expression of the Rap1-specific GAP Rap1GAP (red curves, n = 14, n = 15, respectively). (C, E) Rap1GAP expression significantly dampened pmEKAR4 response (n = 40). (D, F) Rap1GAP expression had no significant effect on cytosolic ERK activity (n = 40). (****p<0.0001, n.s. = not significant, calculated using student’s t-test with Welch’s correction) See also Figure 3—figure supplements 16.

Figure 3—source data 1.
elife-57410-fig3-data1.xlsx (469.9KB, xlsx)

Figure 3.

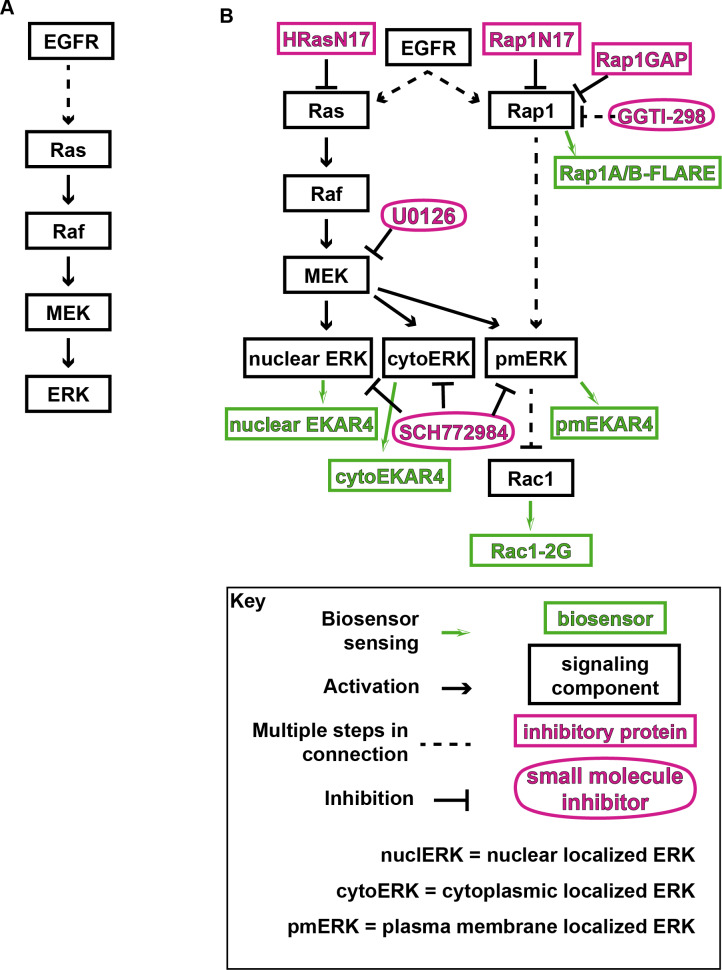
Figure 3—figure supplement 1. Model of ERK and tested pathways.

Figure 3—figure supplement 1.

(A) Canonical ERK/MAPK signaling pathway. (B) EGFR signaling pathway components with inhibitors and biosensors used in this study.
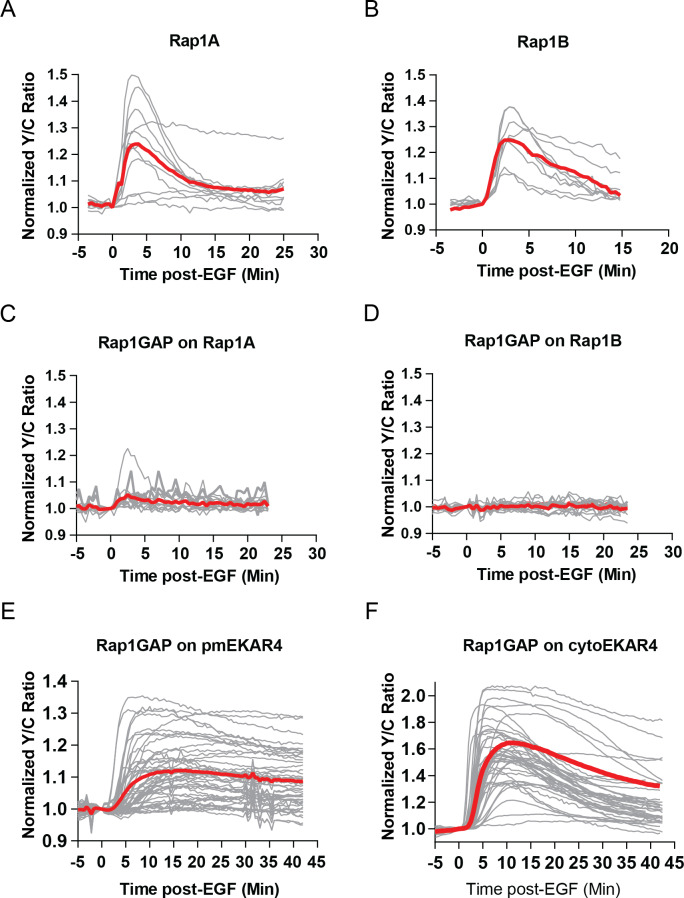
Figure 3—figure supplement 2. Rap1-FLARE responses of all replicates.

Figure 3—figure supplement 2.

(A) Rap1A FLARE responses of all replicates, average shown in red (n = 11). (B) Rap1B FLARE responses of all replicates with average shown in red (n = 9). (C) Effect of Rap1GAP expression on Rap1A FLARE response, all replicates (n = 14). (D) Effect of Rap1GAP on Rap1B Flare response, all replicates (n = 15). (E) Effect of Rap1GAP on pmEKAR4 responses, all replicates (n = 40). (F) Effect of Rap1GAP on cytoEKAR4 responses, all replicates (n = 40).
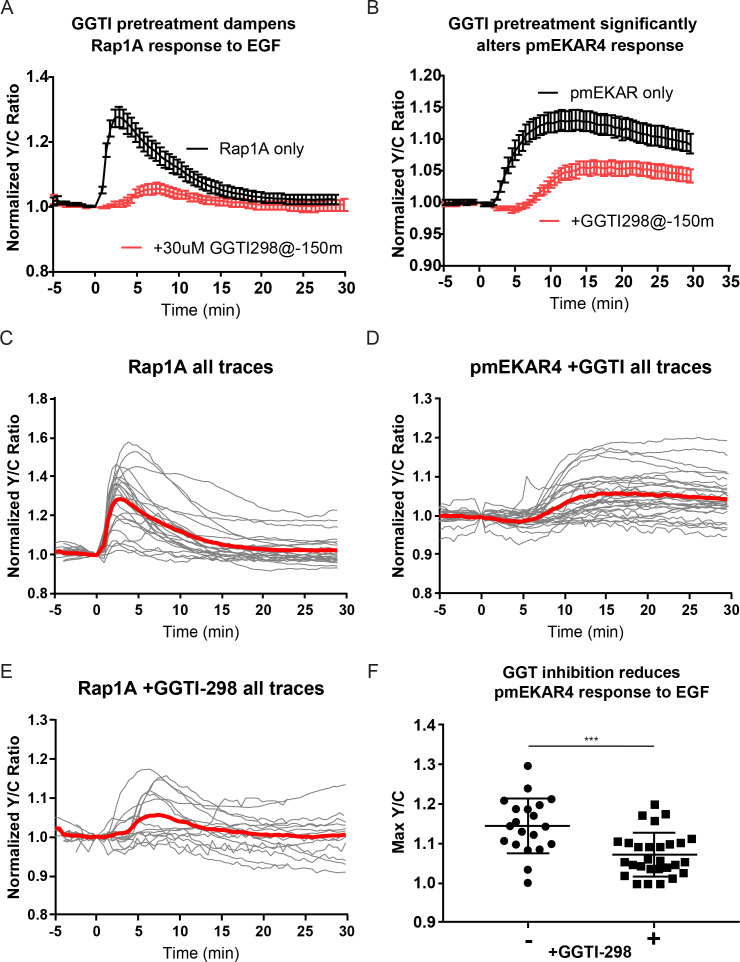
Figure 3—figure supplement 3. Abrogation of Rap1 signaling via geranylgeranyl transferase inhibition significantly dampens plasma membrane ERK response.

Figure 3—figure supplement 3.

(A) 30 μM GGTI-298 addition to cells 150 min before EGF treatment led to a drastic decrease in the Rap1A response to EGF. (n = 24 GGTI control; n = 15 +GGTI) B) 30 μM GGTI-298 addition to cells 150 min before EGF dampens pmEKAR4 response to EGF (n = 20 GGTI control; n = 28 +GGTI control.) C-E) individual traces of all replicates for indicated conditions, red curve represents average.) F) Quantitation of max amplitude of pmEKAR4 response with and without GGTI-298 preincubation. (***p=0.0002, unpaired t-test).
Figure 3—figure supplement 4. Ral-GDS translocation assay reveals EGF-mediated activation of Rap1 at the plasma membrane.
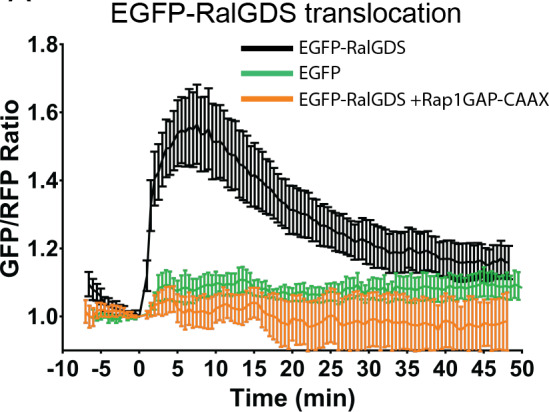
Figure 3—figure supplement 4.

Cells expressing either a plasma membrane targeted mCherry-CAAX (mCh) in combination with either EGFP-RalGDS (black curve, n = 11 cells), EGFP only (green curve, n = 3 cells), or EGFP-RalGDS with Rap1GAP overexpression (orange curve, n = 5 cells) were analyzed using TIRF microscopy to track EGFP translocation to the basal membrane, indicating the formation of GTP-bound Rap1 at the plasma membrane.
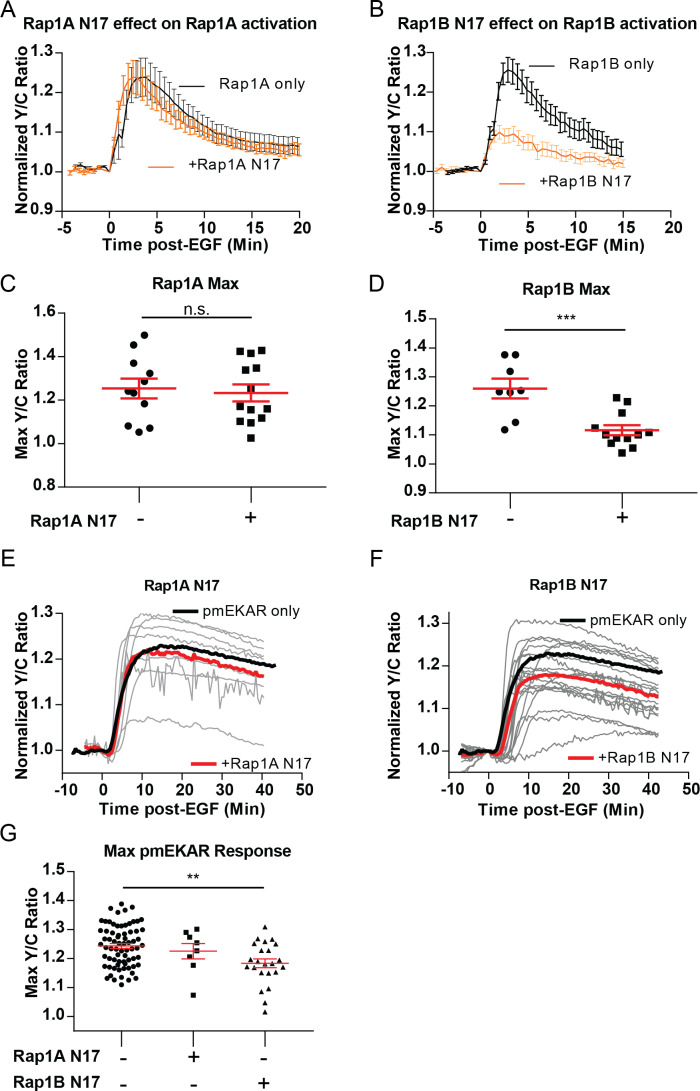
Figure 3—figure supplement 5. Dominant negative Rap1 isoforms on EGF-induced Rap1 and plasma membrane ERK responses.

Figure 3—figure supplement 5.

Rap1A N17 expression had no effect on Rap1A FLARE response (A, C) or pmEKAR response to EGF (E, G). Rap1B N17 expression significantly dampened Rap1B response (B, D) and dampened pmEKAR4 response (F, G) (n = 23). Note, Rap1 DN expression resulted in similar trends as Rap1GAP expression, but the effect had more cell-to-cell variability. (***p<0.001, student’s t-test; **p<0.01, one-way Anova comparison to no dominant negative control).
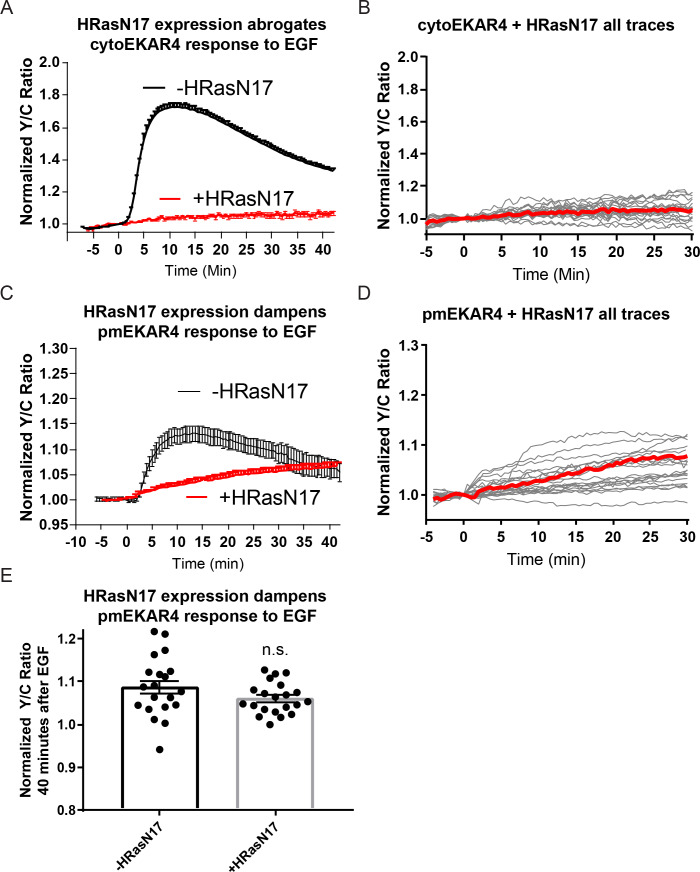
Figure 3—figure supplement 6. Effect of HRasN17 dominant negative expression on cytoEKAR4 and pmEKAR4 response to EGF in PC-12 cells.

Figure 3—figure supplement 6.

(A–B) HRasN17 expression completely abrogates cytosolic ERK response (n = 21). (C–D) Plasma membrane localized ERK exhibits a dampened, slow response to EGF (n = 21). (E) Quantification of average amplitude value at 40 min post EGF. (n.s. = not significant).