Abstract
A 3-year fixed site experiment was carried out on a Planosol in Northeast China to study the effects of biochar and controlled-release nitrogen fertilizer on rice yield, nitrogen-use efficiency, residual nitrogen, and nitrogen balance in soil-crop system. Five treatments were established: control (CK), bare urea (BU), controlled-release urea (CRU), 50% BU + 50% CRU (MBC), and 50% BU + 50% CRU + biochar (MBCB) treatments. The results showed that, compared with the BU treatment, the yield, N-use efficiency (NUE) and N agronomic efficiency (NAE) of the CRU treatment increased by 12.2%, 33.9% and 4.3 kg kg−1, respectively; while the soil residual N and N surplus at harvest decreased by 11.6% and 10.7%, respectively. Compared with the MBC treatment, the yield, NUE and NAE of the MBCB treatment increased by 10.2%, 16.5% and 4.0 kg kg−1, respectively; while the soil residual N and N surplus at harvest decreased by 10.8% and 12.3%, respectively. Therefore, mixed application of bare urea, controlled-release urea and biochar was effective for obtaining high rice yield, and high fertilization efficiency as well as for sustainable agricultural development in Northeast China.
Subject terms: Agroecology, Environmental impact
Introduction
Controlled-release fertilizers are typically coated with many different types of materials, such as paraffin, resin, natural rubber, polychlorovinyl and polylactic acid1, etc. These coated fertilizers are mainly nitrogenous fertilizers, and their function is to delay the absorption and utilization of fertilizer by their target plants; as such, the absorption and utilization time of their target plants is significantly longer than that of ordinary nitrogenous fertilizers2,3. The most widely used controlled-release fertilizer is the controlled-release urea (CRU), which is usually resin coated. CRU is more effective than bare urea (BU) at increasing crop yield and nitrogen fertilizer-use efficiency4. There have been many reports about the advantages of nutrient release and crop absorption steps associated with controlled-release nitrogen fertilizer in rice with mixed application techniques5–7. Single mixed application of controlled-release nitrogen fertilizer and ordinary urea can improve the proportion of dry matter and nitrogen accumulation in rice8. The use of CRU is a specific practice to synchronize crop nitrogen demand, which could minimize early-season N availability when crop uptake is slow, thereby reducing the loss potential and saving labour by a one-off application9.
Biochar has highly porous structure, large surface area, and high ion-exchange capacity and can impact a number of processes in the soil N cycle associated with enhanced soil fertility10,11. It has been reported that biochar application increases soil nutrient retention capacity and nitrogen-use efficiency (NUE), improves soil fertility and reduces of NO3–-N leaching in soils12–15.
Rice is the staple food for more than 65% of the population and the perennial planting area is approximately 30.2 million hectares in China16. Heilongjiang Province is one of the most important commercial grain production bases in China, with 12.3 million hectares of cultivated land; the rice planting area accounts for 26% of the province’s grain crop planting area and 10.4% of the country’s rice planting area17. Mixed application of CRU and BU have been widely used in current production practices in China in recent decades; farmers mainly use the fertilization technique of one basal and two topdressing application for rice planting, but this usually results in fast nutrient release, low fertilizer-use rate and relatively low yield18. To achieve high crop yield, new methods, such as biochar application, have been introduced. Although how biochar amendment affects crop yield and nitrogen balance has been reported extensively10–15, little information is available on how mixed application of biochar with CRU and BU affect crop yield, the nitrogen use rate, residual nitrogen and nitrogen balance in soil-crop systems.
Therefore, the methodology of a fixed-site experiment under equal nutrient contents of NPK was adopted. The objectives of this study were to investigate the effects of mixture of biochar with controlled-release nitrogen fertilizer and ordinary nitrogen fertilizer on rice yield, nitrogen-use efficiency, and nitrogen balance after a three years application. This study could provide a theoretical basis for the mixed application of biochar with nitrogen fertilizers in current cropland management systems, especially for local farmers in the cold region of Northeast China.
Results
Effects of biochar and controlled-release nitrogen fertilizer on rice yield
The different nitrogen fertilizer management practices had a significant effect on rice yield (Fig. 1, p < 0.05). Compared with the CK treatment, the yields of the treatments of BU, CRU, MBC and MBCB significantly increased by 29.7%, 45.5%, 55.7% and 71.5%, respectively. In addition, compared with that in the BU treatment, the yield in the CRU treatment increased by 12.2%. The yield in the MBCB treatment increased by 10.2% as compared to that in the MBC treatment.
Figure 1.
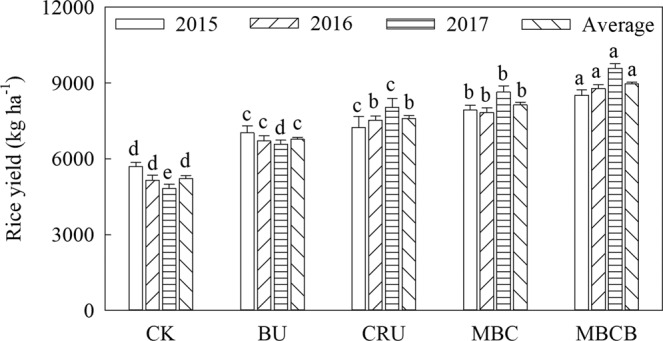
Rice yield of the different treatments. Data here are mean ± standard deviation, n = 3. The same lowercase letters indicated no significant differences among different fertilization treatments in the same year according to LSD test (p < 0.05). The same in Figs. 2 to 7.
Effects of biochar and controlled-release nitrogen fertilizer on the N uptake of the rice
The results showed that the N uptake and N utilization of rice in the CRU treatment were higher than that in the BU treatment (Fig. 2, p < 0.05). The nitrogen uptake for the treatments of BU, CRU, MBC and MBCB significantly increased by 28.3%, 73.0%, 80.0% and 91.1% over that of the CK, respectively. In addition, compared with the BU treatment, the N uptake in CRU treatment increased by 13.7%; the N uptake in the MBC treatment increased by 4.1% as compared to that in the CRU treatment; and the N uptake in MBCB treatment increased by 7.4% compared to that in the MBC treatment.
Figure 2.
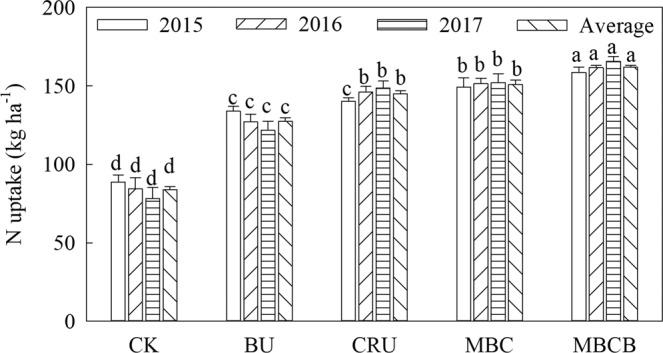
N uptake of different treatments of rice.
Effects of biochar and controlled-release nitrogen fertilizer on N-use efficiency
The nitrogen-use efficiency (NUE) was greatly influenced by the different nitrogen fertilizer treatments (Fig. 3, p < 0.05). Compared with the BU treatment, the NUE in the CRU treatment increased by 33.9%; the NUE in the MBC treatment increased by 9.8% compared to that in the CRU treatment; and the NUE in the MBCB treatment increased by 16.5% compared to that in the MBC treatment. The nitrogen agronomic efficiency (NAE) was significantly affected by the different nitrogen fertilizer treatments (Fig. 4, p < 0.05). Compared with the BU treatment, the NAE of the CRU treatment increased by 4.3 kg kg−1; the NAE of the MBC treatment increased by 2.7 kg kg−1 compared to that of the CRU treatment; the NAE of MBCB treatment increased 4.0 kg kg−1 compared to that of the MBC treatment.
Figure 3.
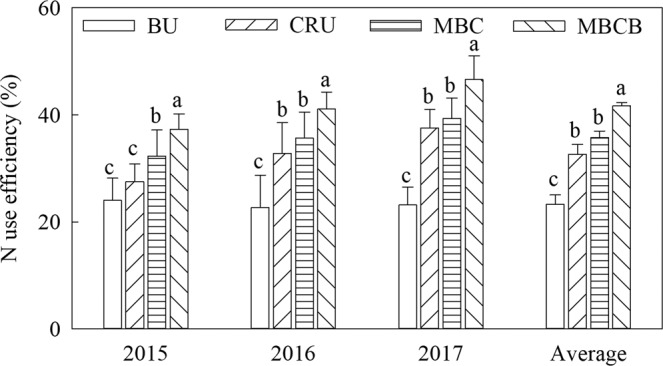
N fertilizer-use efficiency of the different treatments.
Figure 4.
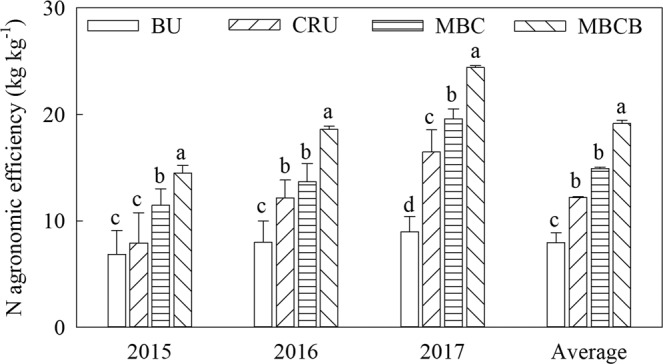
Agronomic efficiency of N in the different treatments.
Effects of biochar and controlled-release nitrogen fertilizer on the inorganic N content in the soil profile
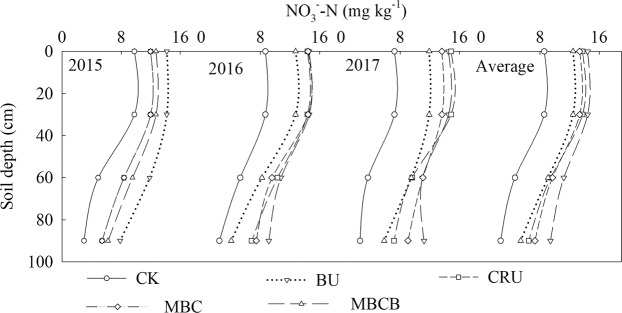
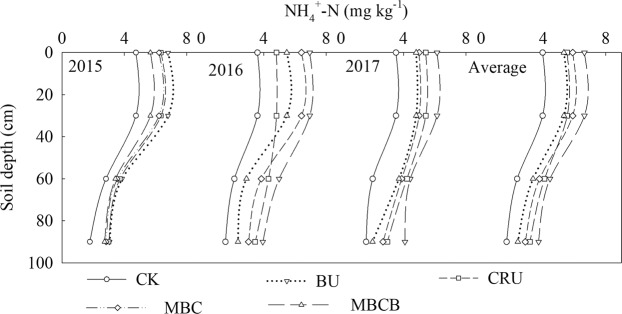
The results showed that the contents of NO3–-N and NH4+-N in the soil profile (0–90 cm) in response to N application were significantly higher than those in the CK treatment (Fig. 5, p < 0.05). Compared with the CK treatment, the content of NO3–-N increased by 130.9%, 113.6% and 163.8% in the 0–30 cm, 30–60 cm and 60–90 cm layers, respectively. Besides, the NO3–-N of the CRU treatment decreased by 6.2%, 17.5% and 27.6% in the 0–30 cm, 30–60 cm and 60–90 cm layers, respectively, as compared to that in the BU treatment; the NO3–-N of the MBCB treatment decreased by 11.9%, 13.0% and 23.3% in the 0–30 cm, 30–60 cm and 60–90 cm layers, respectively, as compared to that in the MBC treatment. The trend of the variation in the content of NH4+-N in the soil profile was the same trend as that of NO3–-N (Fig. 6, p < 0.05). Compared with the CK treatment, the average content of NH4+-N in the four N application treatments increased by 45.6%, 59.7% and 68.2% in the 0–30 cm, 30–60 cm and 60–90 cm layers, respectively. In addition, the NH4+-N of the CRU treatment decreased by 16.6%, 13.5% and 19.5% in 0–30 cm, 30–60 cm and 60–90 cm layers, respectively, as compared with that of the BU treatment; the NH4+-N of the MBCB treatment decreased by 9.7%, 15.4% and 20.1% in the three layers, respectively, as compared with that of the MBC treatment.
Figure 5.
NO3--N content in the soil profile during 2015–2017.
Figure 6.
NH4+-N content in the soil profile during 2015–2017.
Effects of biochar and controlled-release nitrogen fertilizer on inorganic nitrogen accumulation in the soil profile
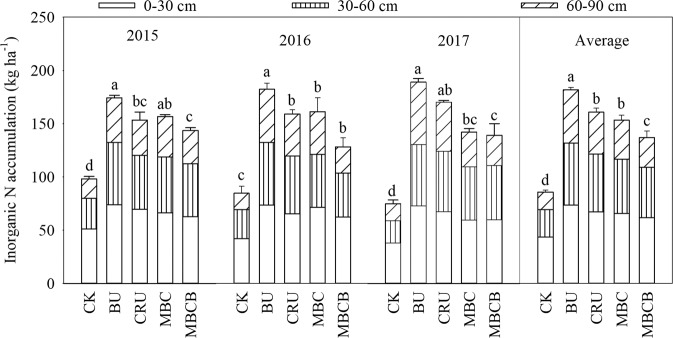
Soil inorganic nitrogen (SIN) mainly refers to NO3--N and NH4+-N. The results showed that the total SIN accumulation ranked as follows: BU > CRU > MBC > MBCB > CK (Fig. 7, p < 0.05). Compared with the BU treatment, the average amount of SIN in the CRU treatment decreased by 11.6%; compared with the MBC treatment, the average amount of SIN in the MBCB treatment decreased by 10.8%. The average distribution of SIN in the soil profile was 44.4%, 32.4% and 23.3% in the 0–30 cm, 30–60 cm, and 60–90 cm layers for all the treatments, respectively (Fig. 8, p < 0.05). For the accumulation of SIN in the profile (0–90 cm) for all the treatments, NO3--N and NH4+-N accounted for 69.7% and 30.2% on average, respectively. Compared with the BU treatment, the SIN accumulation of the CRU treatment decreased by 8.3%, 7.2% and 21.4% in the 0–30, 30–60 and 60–90 cm layers, respectively; compared with the MBC treatment, the SIN accumulation of the MBCB treatment decreased by 6.2%, 6.8% and 24.1% in the 0–30, 30–60 and 60–90 cm layers, respectively.
Figure 7.
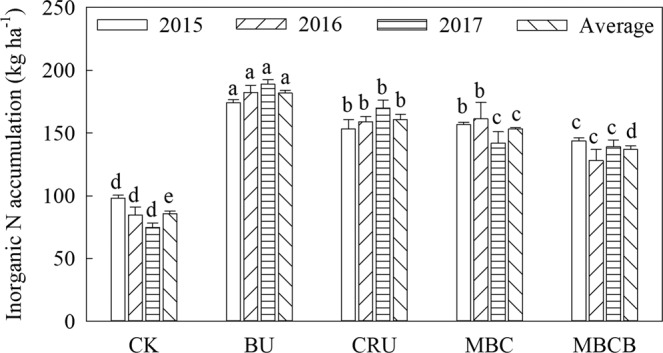
Inorganic N accumulation in the 0–90 cm soil profile.
Figure 8.
Inorganic N distribution in the 0–90 cm soil profile.
Effects of biochar and controlled-release nitrogen fertilizer on the N balance in the soil-crop system
The controlled-release urea and biochar showed a significant effect on residual inorganic N and the apparent loss and surplus in the soil-crop system (Table 1, p < 0.05). Compared with the BU and MBC treatments, the residual SIN of the CRU and MBCB treatments on average decreased by 13.1% and 15.4%, respectively (p < 0.05). In addition, the apparent loss of N in the CRU and MBCB treatments on average decreased by 5.7% and 5.9%, respectively (p < 0.05). The inorganic N surplus decreased in the order of BU, CRU, MBC, MBCB and CK. The inorganic N surplus in the MBCB treatment decreased by an average of 12.3% compared to that in the MBC treatment; and the inorganic N surplus in the CRU treatment decreased by an average of 10.7% compared to that in the BU treatment.
Table 1.
Nitrogen balance of different treatment for a three-year interval of 2015–2017.
| Parameters | Ninitial | Nfertilizer | Nmineral | Nuptake | Nresidual | Napparentloss | Nsurplus |
|---|---|---|---|---|---|---|---|
| CK | 111.4 ± 20.8b* | 0.0 ± 0.0 | 44.2 ± 9.9 | 83.8 ± 5.2d | 86.1 ± 11.7d | −14.3 ± 16.3b | 71.8 ± 27.9d |
| BU | 163.2 ± 26.5a | 187.5 ± 0.0 | 44.2 ± 9.9 | 127.5 ± 6.0c | 181.8 ± 7.4a | 85.6 ± 15.7a | 267.4 ± 20.9a |
| CRU | 152.1 ± 16.7a | 187.5 ± 0.0 | 44.2 ± 9.9 | 145.0 ± 4.3b | 158.1 ± 4.3b | 80.7 ± 14.8a | 238.8 ± 13.1ab |
| MBC | 159.1 ± 22.8a | 187.5 ± 0.0 | 44.2 ± 9.9 | 150.9 ± 1.5b | 161.5 ± 4.8b | 78.4 ± 13.3a | 239.9 ± 12.9ab |
| MBCB | 140.8 ± 9.6ab | 187.5 ± 0.0 | 44.2 ± 9.9 | 162.0 ± 3.5a | 136.7 ± 7.9c | 73.8 ± 21.5a | 210.5 ± 19.5b |
*Data here are mean ± SE, n = 3. The same lowercase letters refer to soil chemical properties were not significantly different among different fertilization treatments according to LSD test (p < 0.05).
Ninitial: residual NO3¯-N + NH4+-N (in 0–90 cm soil depth before sowing).
Nfertilizer: N fertilizer rate.
Nuptake: N uptake by above-ground parts at harvest.
Nresidual: accumulation of NO3¯-N + accumulation of NH4+-N(in 0–90 cm soil depth after harvest).
N mineralization (Nmin) = N uptake +N residual - N initial.
Napparent loss: Ninitial + Nfertilizer + Nmineral–(N uptake + N residual).
Nsurplus: Napparent loss + Nresidual.
Discussion
Effects of different fertilization management practices on rice yield
In the present study, the average rice yields of the CRU and MBC treatments were significantly greater than that of the BU treatment. This was consistent with the results of previous studies19,20, which showed that the controlled-release urea could significantly increase rice yield. For instance, a study found that CRU application with common urea at a ratio of 4:6 or 5:5 could increase rice yield by 8~34.2%15,21. This indicated that MBC (50% BU + 50% CRU) had a better effect on yield than did CRU or BU alone. In the present study, the rice yield of the MBCB treatment increased by 10.2% compared with that of the MBC treatment. This result was consistent with the other reports of yield increases of 9.5–13.7%22,23. This may be due to the acidity, poor physical and chemical properties of the tested soil. When biochar and NPK fertilizers were applied together, there was a strong synergistic effect on the increase in both grain and biomass yield24. However, biochar application alone had different effects on crop yield of different in biochar properties or soil properties, crop species and environmental conditions25. These results indicated that MBCB (50% BU + 50% CRU + biochar) had the greatest effect on rice yield. A possible reason was that the CRU and BC treatments reduced nitrogen loss, increased nitrogen-use efficiency and improved the soil physical and chemical properties26,27.
Effects of different fertilization management practices on N uptake and N-use efficiency
The uptake of N by crops reflects the utilization capacity of the crop itself, and reflects the NUE. In the present study, CRU had a better effect on N uptake than did BU. This was consistent with previous reports, which noted that CRU could increase the N uptake and N-use efficiency of rice by 15.6% and 8.3%, respectively19,20. A possible reason was that CRU increased the crop N uptake from the fertilizer by the crops and reduced unidentified losses of applied N28,29. CRU can provide a continuous nitrogen supply for rice growth and development throughout the growth period30. In addition, MBCB also had a better effect on N uptake than did MBC. Previous studies also found that biochar used as compound fertilizer and combined with chemical nutrients could significantly increase both nitrogen-use efficiency and agronomic-use efficiency by 43.1%7,31. This may be because the adsorption function of biochar improves soil physical and chemical properties, making them more conducive to the growth of rice roots32.
The N requirement of crops is the most important factor influencing N-use efficiency33. In the present study, the NUE and NAE of the CRU treatment were significantly greater than those of the BU treatment. This is consistent with previous studies that reported that controlled-release nitrogen fertilizer mixed with bare urea could increase the apparent N-use efficiency by 20.0% compared with that of the BBF treatments at the same application rates34. This may be because CRU can increase N uptake by the plants and reduce N loss35,36. In addition, in the present study, the NUE and NAE of the MBCB treatment were significantly greater than those of the MBC treatment. Previous studies noted that biochar application alone led to an increase of 7–16.5% in N-use efficiency32,37. Other studies also showed that the nutrient supply capacity of biochar in combination with N fertilizer was greater than that of biochar or N fertilizer alone31,35. This may have promoted the adsorption function of biochar, which improves N uptake and reduces the N loss36. These results indicated that MBCB had the best effect on the N use efficiency, followed by MBC. These two methods are therefore recommended in rice production in Northeast China.
Effects of different fertilization management practices on soil inorganic N accumulation in the soil profile
Soil inorganic N (SIN) exists mainly as ammonium- and nitrate-N. In the present study, the CRU treatment significantly reduced the contents of NO3−–N and NH4+–N and inhibited mineral N accumulation in the soil profile. Previous studies have investigated that CRU could improve nitrogen fertilizer-use efficiency and to reduce the N concentration, N accumulation and residual inorganic N in the soil19,38. This may be because CRU controlled the release of nitrogen, reduced the leaching of NO3−–N and NH4+–N, and improved nitrogen-use efficiency39–41. Moreover, the CRU enhanced N immobilization process could create a temporary reservoir of organic N, which would reduce the potential for SIN leaching in highly leached soils42,43. In addition, compared with the MBC treatment, the MBCB treatment significantly reduced the contents of NO3−–N and NH4+–N, and had a positive effect on the inhibition of mineral N accumulation in the soil profile. This result was consistent with previous reports42–44, and could be attributed to the adsorption and fixation ability of biochar, which could improve soil physical properties, such as the soil CEC and specific surface area, and then increase the contents of NO3−–N and NH4+–N in the soil12,39. Furthermore, biochar amendment can decrease nitrate leaching and nitrate reduction in the soil, and promote nitrate absorption45–48. The effects of CRU and MBCB on the accumulation of SIN became more significant with the increase in the soil profile depth and test year, and the effect on NO3−–N was greater than that on NH4+–N, which still needs further investigation.
Different fertilization management practices affected the balance of N in the soil-plant system
Nitrogen fertilizer application had some effects on the distribution of soil mineral N in the soil profile48. In the soil-crop system, the more nitrogen that was uptake by plants, the less N loss or surplus. In the present study, compared with the BU treatment, the CRU treatment significantly reduced the residual SIN, apparent loss of N, and inorganic N surplus. These results were consistent with a previous study, which reported that the nitrate concentration in the 0–130 cm layer of CRU plots was 53% lower than that of BU treated plots at the end of the experiment49. This could be attributed to the fact that CRU could improve nutrient uptake and increase nitrogen-use efficiency41,43, while excessive utilization of nitrogen fertilizer can reduce plant nitrogen-use efficiency and increase the risk of soil environmental pollution41. In addition, lots of residual inorganic N in the BU treatment was mainly due to the low uptake by crops and the poor adsorption and fixation ability of the soil; on the other hand, the small amount of residual inorganic N in the CRU treatment was mainly due to the high uptake by crops and the high utilization rate of nitrogen fertilizer29.
In addition, compared with the MBC treatment, the MBCB treatment also reduced the residual SIN, the apparent loss of N, and the inorganic N surplus. This result was in agreement with a previous report50, compared with the application of N fertilizer alone, the application of biochar at 20 t ha−1 combined with N fertilizer significantly decreased the residual NO3−-N in the subsoil by 13.2–74.7%50. A possible reason was that biochar has a positive effect on the N balance in the soil-crop systems, which could improve crop yield, nitrogen availability, nitrogen-use efficiency and soil physicochemical properties under the MBCB treatment; while the MBC treatment improved only in the rice yield and nitrogen-use efficiency40,51.
Materials and methods
Experimental site and soil description
A 3-year fixed-site field experiment (2015–2017) was conducted in Fengnian village of Huachuan County, Heilongjiang Province, China. The experimental site is located at 46°40′N and 131°41′E. The climate of the area is characterized as a semi-humid semi-arid cold temperate monsoon climate with an average temperature of 2.5 °C and annual precipitation of 476 mm annually, and a frost-free period of 133 days52. The soil type is a Planosol and the soil fertility is relatively low. The soil organic matter content was 18.7 g kg−1; the total N, total P and total K contents were 1.63 g kg−1, 0.62 g kg−1, and 21.6 g kg−1, respectively; the available N, available P and available K contents were 113.6 mg kg−1, 18.5 mg kg−1, and 142.6 mg kg−1, respectively; and the soil pH value was 5.37.
Biochar production and characterization
The biochar used in the field experiment was derived from the pyrolysis of rice straw at 450 °C for 6 h in a vertical kiln, of which approximately 450 kg of biochar and 250 L of wood vinegar were produced per ton of rice straw dry matter. For the field study, the biochar mass was ground to pass through a 2 mm sieve, and then mixed thoroughly to obtain a fine granular consistency that would mix uniformly with the soil mass. The basic physical and chemical properties of the pyrolysis materials and tested biochar were shown in Table 2.
Table 2.
Essential physical and chemical characteristics of biochar and rice straw.
| Materials | Total N (g kg−1) | Total P (P2O5 g kg−1) | Total K (K2O g kg−1) | TOC (C g kg−1) | BET surface area (m2·g−1) | Pore volume (cm3·g−1) | Pore diameter (mm) | pH |
|---|---|---|---|---|---|---|---|---|
| Biochar | 8.65 | 5.7 | 34.1 | 487.4 | 4.88 | 0.029 | 16.94 | 9.86 |
| Straw | 14.7 | 8.9 | 9.6 | 386.4 | 6.73 |
Experimental treatments
Five treatments were established for the field experiment. One was no nitrogen fertilizer application; the other four treatments involved the same rates of NPK application, but they were different in terms nitrogen fertilizer management. The treatments were described as follows: (i) CK, no nitrogen fertilizer was applied; (ii) BU, bare urea was applied as basal application; (iii) CRU, controlled-release urea was applied as basal application; (iv) MBC, a mixture of 50% BU and 50% CRU was applied as basal application; and (v) MBCB, a mixture of 50% BU and 50% CRU with 7.5 t ha−1 of biochar was applied as basal application. The amounts of nitrogen (N), phosphorus (P2O5) and potassium fertilizer (K2O) were set, and the rates were 187.5 kg ha−1, 67.5 kg ha−1 and 82.5 kg ha−1, respectively, for basic fertilization; 7.5 t ha−1 of biochar was applied for the MBCB treatment in the first year of the experiment. The experiment plot area was 24m2 (4 m × 6 m) with 3 replications, and the randomized plot arrangement was adopted for the experiment. Bare urea was used as ordinary nitrogen fertilizer (46% N), superphosphate (46% P2O5) was used as phosphorus fertilizer, potassium chloride (60% K2O) was used as potassium fertilizer; and controlled-release urea (CRU, 44% N) and its release longevity was valid for 90 days. The rice variety used for the experiment was Longjing 18, and the transplanting density was 30 cm×15 cm for each hole, with three seedlings in each hole. Three points were selected for each plot, and 1 m2 was taken for each point for harvested and grain yield measurement. The yield was then converted (on a dry mass basis) to kilograms per hectare.
Soil sampling and measurement of inorganic N
The plots were established in accordance with the experimental design. Three initial soil samples from 0–90 cm (0–30, 30–60, 60–90 cm) depth were subsequently collected in the spring of 2015, and other soil samples were collected after harvest in autumn53, the same procedures were applied in 2016 and 2017. The soil samples were transported to the lab in cooling boxes and extracted to determine their initial nutrient concentrations with two different methods. The fresh soil samples were extracted for mineral N (NO3–-N and NH4+-N) determination by 0.01 mol L−1 CaCl2 using an auto-analyzer (Model AA3-A001–02E, Bran-Luebbe, Germany). The other soil samples were air dried, ground, passed through a 2-mm sieve, passed through a 0.25-mm sieve, and ultimately stored in paper bags for nutrient analysis.
Nutrient analysis of plant biomass and nitrogen-use efficiency calculation
The rice plants and grain samples were collected after harvest. In the laboratory, the plant samples were prepared for analysis by first being placed in an oven for 30 min at 105 °C to deactivate enzymes, after which they were dried at 75 °C to a constant weight, weighed, and ground to pass through a 2-mm sieve. The total plant N concentration was determined by H2SO4-H2O2 digestion and the micro-Kjeldahl procedure54. The N-use efficiency of rice was the difference between the total N uptake of plants in the N application area and the total N uptake of plants in the nitrogen free zone and the percentage of the N application amount (%). The nitrogen agronomic efficiency of the rice was calculated as the ratio of the increase in grain yield relative to the nitrogen application rate (kg kg−1). The total N uptake (kg ha−1) of the rice was calculated as the sum of the N uptake by the plant straw and the grain yield.
Data processing and calculation
The statistical software SPSS 21.0 (SPSS Inc.) was adopted for analysis of variance analysis and multiple comparisons based on the LSD method. The SigmaPlot 12.5 software (Systat Inc.) was used to construct the diagrams. The following parameters were calculated by the following formulas:
| 1 |
Apparent nitrogen-use efficiency (NUE) can also be referred to as apparent nitrogen recovery efficiency. It was calculated as follows:
| 2 |
where Nf is the N uptake (grain plus straw) of the fertilized plot (kg), Nu is the N uptake (grain plus straw) of the unfertilized plot (kg) for each replicate, and Na is the quantity of N applied (kg).
Nitrogen agronomic efficiency (NAE), defined as grain production per unit of N applied, was calculated as follows53,55:
| 3 |
where GYf is the grain yield of the fertilized plot (kg), GYu is the grain yield of the unfertilized plot (kg) for each replicate, and Na is the quantity of N applied as nitrogen fertilizer (kg).
The soil inorganic N accumulation was calculated as follows56,57:
| 4 |
| 5 |
Conclusions
Our study demonstrated that the MBCB treatment had a significant effect on rice yield, nitrogen-use efficiency, residual soil inorganic nitrogen and its surplus in soil-plant system, and MBCB had a unique advantage over single application of BU, CRU or MBC. Therefore, to prevent soil degradation caused by the abundant use of chemical fertilizers and to promote high nitrogen-use efficiency, mixed application of biochar and controlled-release nitrogen fertilizer is an effective way to achieve high yield, high fertilization efficiency and sustainable rice production in Northeast China, especially for the local formers.
Acknowledgements
This study was jointly supported by the National Key Research and Development Program of China (No. 2018YFD0300308 and 2017YFD0300503) and IPNI China Program. The authors are indebted to the unknown reviewers for their thoughtful comments and valuable suggestions.
Author contributions
Y.Z., X.H. and Y.L. conceived and designed the study. Y.Z., X.H., Y.L. S.L., J.J. and Y.T. collected and analyzed the data. Y.Z., X.H. and Y.L. wrote the paper. All authors read and approved the final manuscript.
Data availability
The original data can be obtained from the authors upon reasonable request.
Competing interests
The authors declare no competing interests.
Footnotes
Publisher’s note Springer Nature remains neutral with regard to jurisdictional claims in published maps and institutional affiliations.
Contributor Information
Xiaori Han, Email: 13840499488@163.com.
Yuying Li, Email: liyuying1023@163.com.
References
- 1.Guertal EA. Slow-release nitrogen fertilizers in vegetable production: A review. Horttechnology. 2009;19:16–19. doi: 10.1051/fruits:2008050. [DOI] [Google Scholar]
- 2.Kaplan L, Tlustoš P, Száková J. The influence of slow-release fertilizers on potted chrysanthemum growth and nutrient consumption. Plant Soil and Environment. 2013;59:385–391. doi: 10.17221/45/2013-PSE. [DOI] [Google Scholar]
- 3.Azeem B, KuShaari K, Man ZB, Basit A, Thanh TH. Review on materials & methods to produce controlled release coated urea fertilizer. Journal of Controlled Release. 2014;181:11–21. doi: 10.1016/j.jconrel.2014.02.020. [DOI] [PubMed] [Google Scholar]
- 4.Liu YX, Lu HH, Yang SG, Wang YF. Impacts of biochar addition on rice yield and soil properties in a cold waterlogged paddy for two crop seasons. Field Crops Research. 2016;191:161–167. doi: 10.1016/j.fcr.2016.03.003. [DOI] [Google Scholar]
- 5.Yi WP, et al. Application of different amount of controlled-release coated urea combined with conventional urea on spring maize. Journal of Nuclear Agricultural Sciences. 2013;27:1385–1390. doi: 10.11869/hnxb.2013.09.1385. [DOI] [Google Scholar]
- 6.Zheng YP, et al. Elevated CO2 concentration induces photosynthetic down-regulation with changes in leaf structure, non-structural carbohydrates and nitrogen content of soybean. BMC Plant Biology. 2019;19:255. doi: 10.1186/s12870-019-1788-9. [DOI] [PMC free article] [PubMed] [Google Scholar]
- 7.Ke J, et al. Combined controlled-released nitrogen fertilizers and deep placement effects of N leaching, rice yield and N recovery in machine-transplanted rice. Agriculture, Ecosystems and Environment. 2018;265:402–412. doi: 10.1016/j.agee.2018.06.023. [DOI] [Google Scholar]
- 8.Grant CA, et al. Crop yield and nitrogen concentration with controlled release urea and split applications of nitrogen as compared to non-coated urea applied at seeding. Field Crops Research. 2012;127:170–180. doi: 10.1016/j.fcr.2011.11.002. [DOI] [Google Scholar]
- 9.Akiyama H, Yan XY, Yagi K. Evaluation of effectiveness of enhanced efficiency fertilizers as mitigation options for N2O and NO emissions from agricultural soils: Meta-analysis. Global Change Biology. 2010;16:1837–1846. doi: 10.1111/j.1365-2486.2009.02031.x. [DOI] [Google Scholar]
- 10.Lehmann J, Gaunt J, Rondon M. Biochar sequestration in terrestrial ecosystems-a review. Mitigation & Adaptation Strategies for Global Change. 2006;11:395–419. doi: 10.1007/s11027-005-9006-5. [DOI] [Google Scholar]
- 11.Clough TJ, Condron LM, Kammann C, Müller C. A review of biochar and soil nitrogen dynamics. Agronomy. 2013;3:275–293. doi: 10.3390/agronomy3020275. [DOI] [Google Scholar]
- 12.Knowles O, Robinson B, Contangelo A, Clucas L. Biochar for the mitigation of nitrate leaching from soil amended with biosolids. Science of the Total Environment. 2011;409:3206–3210. doi: 10.1016/j.scitotenv.2011.05.011. [DOI] [PubMed] [Google Scholar]
- 13.Ventura M, Sorrenti G, Panzacchi P, George E, Tonon G. Biochar reduces short-term nitrate leaching from a horizon in an apple orchard. Journal of Environment Quality. 2013;42:76–82. doi: 10.2134/jeq.2012.0250. [DOI] [PubMed] [Google Scholar]
- 14.Gao S, Hoffman-Krull K, Bidwell AL, DeLuca TH. Locally produced wood biochar increases nutrient retention and availability in agricultural soils of the San Juan Islands, USA. Agriculture, Ecosystems and Environment. 2016;233:43–54. doi: 10.1016/j.agee.2016.08.028. [DOI] [Google Scholar]
- 15.Zhang JN, Zhou S, Sun HF, Lü F, He PJ. Three-year rice grain yield responses to coastal mudflat soil properties amended with straw biochar. Journal of Environmental Management. 2019;239:23–29. doi: 10.1016/j.jenvman.2019.03.022. [DOI] [PubMed] [Google Scholar]
- 16.Huang M, Yang L, Qin H, Jiang L, Zou Y. Quantifying the effect of biochar amendment on soil quality and crop productivity in Chinese rice paddies. Field Crops Researc. 2013;154:172–177. doi: 10.1016/j.fcr.2013.08.010. [DOI] [Google Scholar]
- 17.National Bureau of Statistics of China. China Statistical Yearbook. 397–401 (China Statistics Press, Beijing (2016).
- 18.Geng JB, et al. Long-term effects of controlled release urea application on crop yields and soil fertility under rice-oilseed rape rotation system. Field Crops Research. 2015;184:65–73. doi: 10.2134/agronj2015.0581. [DOI] [Google Scholar]
- 19.Sun Y, Mi WH, Su LJ, Shan YY, Wu LH. Controlled-release fertilizer enhances rice grain yield and N recovery efficiency in continuous non-flooding plastic film mulching cultivation system. Field Crops Research. 2015;231:122–129. doi: 10.1016/j.fcr.2018.11.013. [DOI] [Google Scholar]
- 20.Wei H, et al. Effects of slow/controlled release fertilizer types and their application tegime on yield in rice with different types of panicle. Acta Agronomica Sinica. 2015;43:730–740. doi: 10.3724/SP.J.1006.2017.00730. [DOI] [Google Scholar]
- 21.Zheng JF, et al. Biochar compound fertilizer increases nitrogen productivity and economic benefits but decreases carbon emission of maize production. Agriculture, Ecosystems and Environment. 2015;241:70–78. doi: 10.1016/j.agee.2017.02.034. [DOI] [Google Scholar]
- 22.Griffin DE, Wang D, Parikh SJ, Scow KM. Short-lived effects of walnut shell biochar on soils and crop yields in a long-term field experiment. Agriculture, Ecosystems & Environment. 2015;236:21–29. doi: 10.1016/j.agee.2016.11.002. [DOI] [Google Scholar]
- 23.Oladele SO, Adeyemo AJ, Awodun MA. Influence of rice husk biochar and inorganic fertilizer on soil nutrients availability and rain-fed rice yield in two contrasting soils. Geoderma. 2019;336:1–11. doi: 10.1016/j.geoderma.2018.08.025. [DOI] [Google Scholar]
- 24.Karer J, Wimmer B, Zehetner F, Kloss S, Soja G. Biochar application to temperate soils: effects on nutrient uptake and crop yield under field conditions. Agricultural and Food Science. 2013;22:390–403. doi: 10.23986/afsci.8155. [DOI] [Google Scholar]
- 25.Li W, et al. Effect of controlled-release nitrogen fertilizer on grain quality of machine-transplanted hybrid rice. Journal of Nuclear Agricultural Sciences. 2018;32:779–787. [Google Scholar]
- 26.Shamim G, Joann KW. Biochemical cycling of nitrogen and phosphorus in biochar-amended soils. Soil Biology & Biochemistry. 2016;103:1–15. doi: 10.1016/j.soilbio.2016.08.001. [DOI] [Google Scholar]
- 27.Alijani K, Bahrani MJ, Kazemeini SA. Short-term responses of soil and wheat yield to tillage, corn residue management and nitrogen fertilization. Soil and Tillage Research. 2013;124:78–82. doi: 10.1016/j.still.2012.05.005. [DOI] [Google Scholar]
- 28.Shaviv A. Advances in controlled-release fertilizers. Advances in Agronomy. 2001;71:1–49. doi: 10.1016/S0065-2113(01)71011-5. [DOI] [Google Scholar]
- 29.Mumtaz I, et al. Optimized tuning of rosin adduct with maleic anhydride for smart applications in controlled and targeted delivery of urea for higher plant’s uptake and growth efficiency. Industrial Crops & Products. 2019;133:395–408. doi: 10.1016/j.indcrop.2019.02.036. [DOI] [Google Scholar]
- 30.Hou PF, et al. Yield and N utilization of transplanted and direct-seeded rice with controlled or slow-release fertilizer. Agronomy Journal. 2019;111:1208–1216. doi: 10.2134/agronj2018.03.0192. [DOI] [Google Scholar]
- 31.Huang M, Fan L, Chen J, Jiang LG, Zou YB. Continuous applications of biochar to rice: Effects on nitrogen uptake and utilization. Scientific Reports. 2018;8:11461. doi: 10.1038/s41598-018-29877-7. [DOI] [PMC free article] [PubMed] [Google Scholar]
- 32.Ladha JK, Pathak H, Krupnik TJ, Six J, Kessel C. Efficiency of fertilizer nitrogen in cereal production: retrospects and prospects. Advances in Agronomy. 2008;87:85–156. doi: 10.1016/S0065-2113(05)87003-8. [DOI] [Google Scholar]
- 33.Wang Y, et al. Effects of mixed application of controlled-release N fertilizer and common urea on grain yield, N uptake and soil N balance in continuous spring maize production. Scientia Agricultura Sinica. 2016;49:518–528. doi: 10.1016/s0065-2113(05)87003-8. [DOI] [Google Scholar]
- 34.He TH, et al. A two years study on the combined effects of biochar and inhibitors on ammonia volatilization in an intensively managed rice field. Agriculture, Ecosystems and Environment. 2018;264:44–53. doi: 10.1016/j.agee.2018.05.010. [DOI] [Google Scholar]
- 35.Ghulam H, Diedrich S, Gerald M, Christoph M. & Claudia, I. K. Biochar reduced nitrate leaching and improved soil moisture content without yield improvements in a four-year field study. Agriculture, Ecosystems and Environment. 2017;237:80–94. doi: 10.1016/j.agee.2016.12.019. [DOI] [Google Scholar]
- 36.Miao YF, Wang ZH, Li SX. Relation of nitrate N accumulation in dry land soil with wheat response to N fertilizer. Field Crops Research. 2015;170:119–130. doi: 10.1016/j.fcr.2014.09.016. [DOI] [Google Scholar]
- 37.Schulz H, Dunst G, Glaser B. Positive effects of composted biochar on plant growth and soil fertility. Agronomy for Sustainable Development. 2013;33:817–827. doi: 10.1007/s13593-013-0150-0. [DOI] [Google Scholar]
- 38.Peng S, et al. Dobermann. Improving nitrogen fertilization in rice by site-specific N management. A review. Agronomy for Sustainable Development. 2016;30:649–656. doi: 10.1051/agro/2010002. [DOI] [Google Scholar]
- 39.Teutscherova N, et al. Leaching of ammonium and nitrate from Acrisol and Calcisol amended with holm oak biochar: A column study. Geoderma. 2018;323:136–145. doi: 10.1016/j.geoderma.2018.03.004. [DOI] [Google Scholar]
- 40.Xu N, Tan GC, Wang HY, Gai XP. Effect of biochar additions to soil on nitrogen leaching, microbial biomass and bacterial community structure. European Journal of Soil Biology. 2016;74:1–8. doi: 10.1016/j.ejsobi.2016.02.004. [DOI] [Google Scholar]
- 41.Li SL, Wang S, Shangguan ZP. Combined biochar and nitrogen fertilization at appropriate rates could balance the leaching and availability of soil inorganic nitrogen. Agriculture, Ecosystems and Environment. 2019;276:21–30. doi: 10.1016/j.agee.2019.02.013. [DOI] [Google Scholar]
- 42.Shoji S, Delgada J, Mosier A, Miura Y. Use of controlled release fertilizers and nitrification inhibitors to increase nitrogen use efficiency and to conserve air and water quality. Communications in Soil Science and Plant Analysis. 2001;32:1051–1070. doi: 10.1081/CSS-100104103. [DOI] [Google Scholar]
- 43.Cao H, et al. Biochar can increase nitrogen use efficiency of Malus hupehensis by modulating nitrate reduction of soil and root. Applied Soil Ecology. 2019;135:25–32. doi: 10.1016/j.apsoil.2018.11.002. [DOI] [Google Scholar]
- 44.Liu, M., Song, F. P. & Lu, Y. Y. Effects of sulfur and polymer coated controlled release urea fertilizers on spatial-temporal variations of soil NO3-N and nitrogen balance and nitrogen use efficiency. Journal of Plant Nutrition and Fertilizer21, 541–548 (2015).
- 45.Malhi SS, Grant CA, Johnston AM, Gill KS. Nitrogen fertilization management for no-till cereal production in the Canadian great plains: a review. Soil and Tillage Research. 2001;60:101–122. doi: 10.1016/S0167-1987(01)00176-3. [DOI] [Google Scholar]
- 46.Widowati W, Asnah A, Utomo WH. The use of biochar to reduce nitrogen and potassium leaching from soil cultivated with maize. J. Degrad. Min. Lands Manag. 2014;2:211–218. [Google Scholar]
- 47.Xu G, Fan X, Miller AJ. Plant nitrogen assimilation and use efficiency. Annual Review of Plant Biology. 2012;63:153–182. doi: 10.1146/annurev-arplant-042811-105532. [DOI] [PubMed] [Google Scholar]
- 48.Chen ZJ, et al. Interactive effect of nitrogen addition and throughfall reduction decreases soil aggregate stability through reducing biological binding agents. Forest Ecology and Management. 2019;445:13–19. doi: 10.1016/j.foreco.2019.04.057. [DOI] [Google Scholar]
- 49.Chien SH, Edmeades D, McBride R, Sahrawat KL. Review of maleic–itaconic acid copolymer purported as urease inhibitor and phosphorus enhancer in soils. Agronomy Journal. 2014;106:423–430. doi: 10.2134/agronj2013.0214. [DOI] [Google Scholar]
- 50.Bao, S. D. Soil agricultural-chemical analysis. 264–265 (China Agriculture Press, 2007).
- 51.Yao Y, Gao B, Zhang M, Inyang M, Zimmerman AR. Effect of biochar amendment on sorption and leaching of nitrate, ammonium, and phosphate in a sandy soil. Chemosphere. 2012;89:1467–1471. doi: 10.1016/j.chemosphere.2012.06.002. [DOI] [PubMed] [Google Scholar]
- 52.Huachuan County Agriculture Bureau. Huachuan county agriculture situation. http://hlj.nj127.com/jms/23.html (2016)
- 53.Ju XT, Liu XJ, Zhang FS. Study on effect of nitrogen fertilizer and nitrogen balance in winter wheat and summer maize rotation system. Scientia Agricultura Sinica. 2002;35:1361–1368. [Google Scholar]
- 54.Li GH, Zhao LP, Zhang SX, Hosen Y. Recovery and leaching of 15N-labeled coated urea in a lysimeter system in the North China Plain. Pedosphere. 2011;21:763–772. doi: 10.1016/S1002-0160(11)60180-X. [DOI] [Google Scholar]
- 55.Agegnehu G, Nelson PN, Bird MI. Crop yield, plant nutrient uptake and soil physicochemical properties under organic soil amendments and nitrogen fertilization on Nitisols. Soil & Tillage Research. 2016;160:1–13. doi: 10.1016/j.still.2016.02.003. [DOI] [Google Scholar]
- 56.Meng QF, Yue SC, Hou P, Cui ZL, Chen XP. Improving yield and N use efficiency simultaneously for maize and wheat in China. Pedosphere. 2016;26:137–147. doi: 10.1016/S1002-0160(15)60030-3. [DOI] [Google Scholar]
- 57.Liu J, et al. Short-term effect of biochar and compost on soil fertility and water status of a Dystric Cambisol in NE Germany under field conditions. Journal of Plant Nutrition and Soil Science. 2012;175:698–707. doi: 10.1002/jpln.201100172. [DOI] [Google Scholar]
Associated Data
This section collects any data citations, data availability statements, or supplementary materials included in this article.
Data Availability Statement
The original data can be obtained from the authors upon reasonable request.


