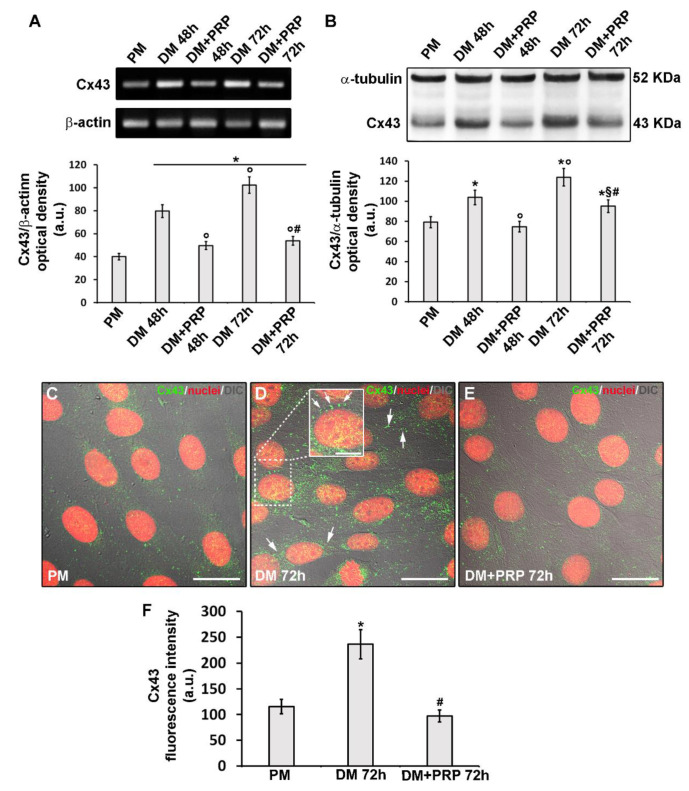
Figure 8.
Cx43 expression and localization during fibroblast to myofibroblast transition and related PRP effects. Fibroblasts were induced to differentiate into myofibroblasts by culturing in differentiation medium (DM) in the presence or absence of PRP for 48 h and 72 h. The cells cultured in proliferation medium (PM) were used as control undifferentiated cells. (A) RT-PCR analysis of Cx43 expression in the indicated experimental conditions. Representative agarose gel is shown. The densitometric analysis of the bands normalized to β-actin is reported in the histogram. (B) Western Blotting analysis of Cx43 expression. Histogram showing the densitometric analysis of the bands normalized to α-tubulin. (C–E) Representative superimposed differential interference contrast (DIC, grey) and confocal fluorescence images of the cells immunostained with antibodies against Cx43 (green) and counterstained with propidium iodide (PI, red) to label nuclei. Scale bar: 30 µm. Scale bar in the inset in D: 15 µm. Arrows indicate the localization of Cx43 at the membrane level of two adjacent cells. (F) Histogram showing the densitometric analysis of the intensity of the Cx43 fluorescence signal performed on digitized images in 20 regions of interest (ROI) of 100 μm2 for each confocal stack (12). Data shown are mean ± S.E.M. and represent the results of at least three independent experiments performed in triplicate. Significance of difference: * p < 0.05 versus PM; ° p < 0.05 versus DM 48 h; # p < 0.05 versus DM 72 h; § p < 0.05 versus DM + PRP 48 h (One-way ANOVA followed by the Tukey post hoc test).

