Figure 4.
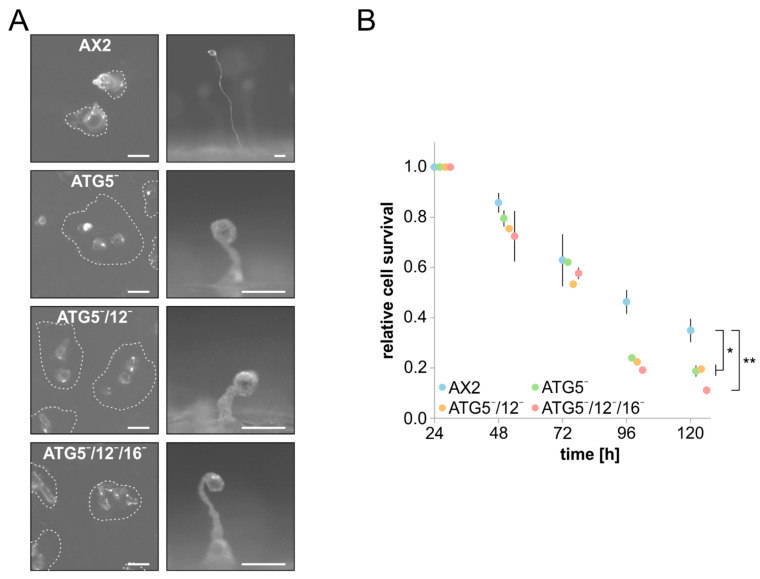
Development and cell survival upon nitrogen starvation of AX2 and mutant strains. (A) Development of AX2, ATG5¯, ATG5¯/12¯ and ATG5¯/12¯/16¯ cells on phosphate agar plates. 5 × 10⁷ cells of each strain were plated homogeneously. On the left, the tipped mound stage for AX2 after 15 h, and for mutant cells after 30 h (top view), and on the right an exemplary fruiting body of AX2 after 24 h, and of mutant cells after 48 h (side view), is shown. The white dashed line encircles tipped mounds. Scale bars, 100 µm. Note the different scale for mutant fruiting bodies. (B) Cell survival of AX2, ATG5¯, ATG5¯/12¯ and ATG5¯/12¯/16¯ cells upon nitrogen starvation. AX2 and mutant strains were grown in SIH medium without amino acids, and cell survival was determined every 24 h for 5 days. Relative cell survival after 24 h was set to 1 for each strain. Cell survival of mutant cells was significantly reduced in comparison to AX2 after 96 and 120 h. Mean values and standard errors of the mean of three independent experiments are shown. For statistical analysis, one-way ANOVA and Tukey’s test as post hoc analysis were used. *, significant (p-value < 0.05); **, very significant (p-value < 0.01).

