Figure 2.
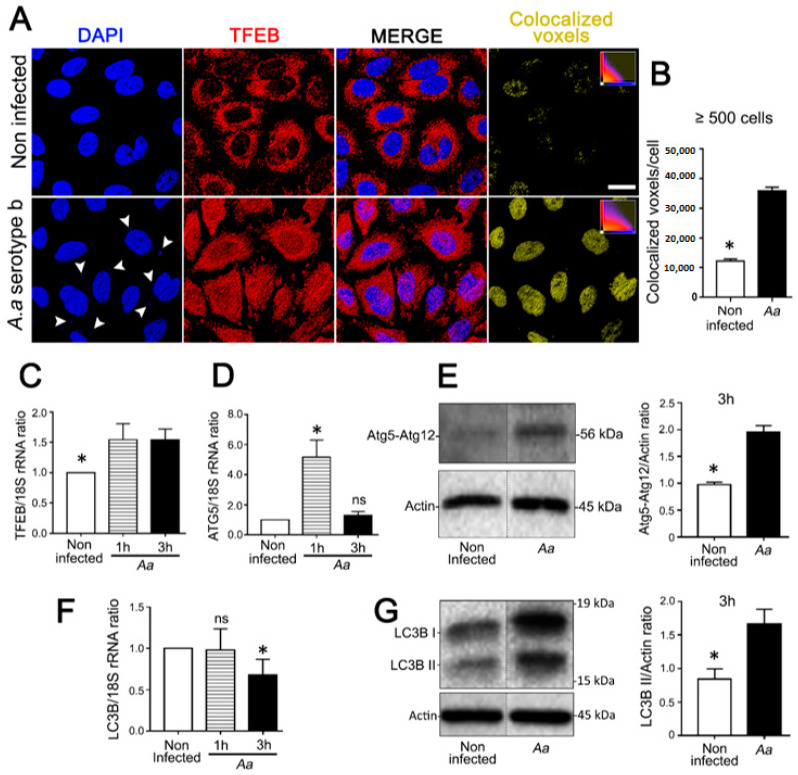
Assessment of autophagy markers in JEKs challenged with A. actinomycetemcomitans (A.a). OKF6/TERT-2 cells were incubated with A.a (serotype b) at MOI = 200 and analyzed as follows: (A) Immunofluorescence staining visualized by confocal microscopy. Blue: DNA rich structures stained with DAPI; red: transcription factor EB labeled with anti-TFEB antibody; merge: digital overlap of blue and red channels; yellow: colocalized voxels from merged file. (B) Quantification of colocalized voxels is shown on the right (graph). (C,D,F) Relative quantification of transcripts encoding for TFEB (C), ATG5 (D), and LC3B (F) proteins by quantitative real-time PCR normalized to the 18S rRNA transcript levels. (E,G) Immunoblotting of protein extracts from OKF6/TERT-2 cells incubated with antibodies against the specified autophagy-related proteins. β-actin protein was employed as a loading control. Densitometric quantitation of actin-normalized protein bands is indicated on the right. The results are shown as the average of the actin normalized data from three independent experiments. * p < 0.05. Results from (A,E,G) were obtained after 3 h of the bacterial challenge. The vertical dotted lines in (E,G) separate signals that were non-adjacent in the developed membrane.

