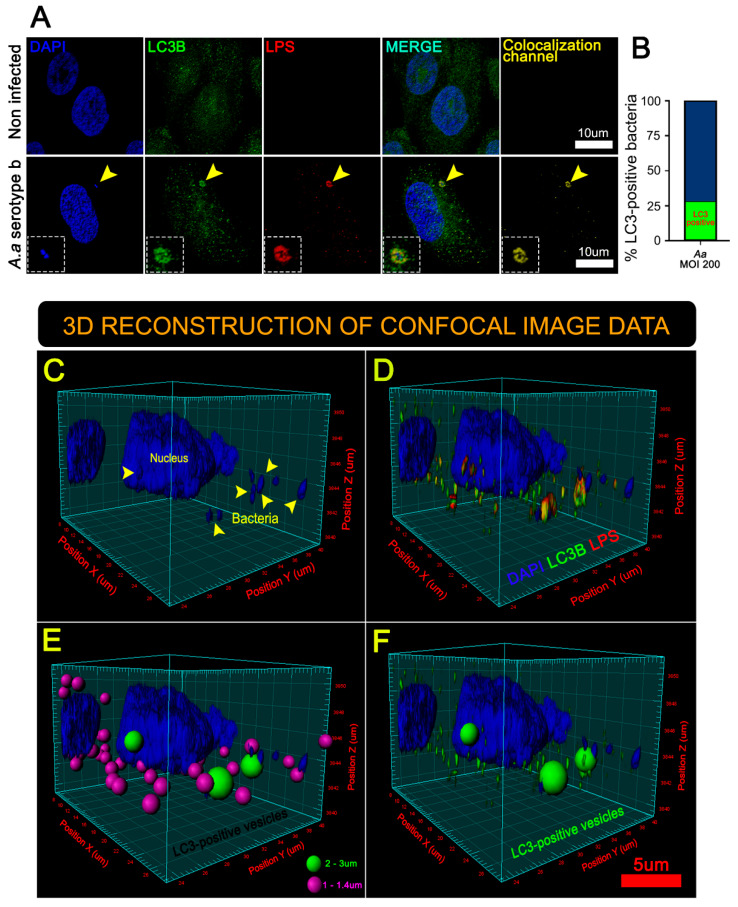
Figure 3.
3-D reconstructions of JEKs infected by A. actinomycetemcomitans revealed two populations of LC3-positive vesicles. (A) Immunofluorescence staining visualized by confocal microscopy. Blue: DNA rich structures stained with DAPI; green: LC3B protein labeled with anti-LC3B antibody; red: A.a bacteria labeled with anti-lipopolysaccharides (LPS) antibody; merge: digital overlap of blue, green and red channels; yellow: colocalized voxels from merged file. The yellow arrowhead indicates (area magnified in the insets) a bacteria colocalizing with the host-protein LC3B, scale bar 10 µm. The yellow arrowhead indicates a bacteria colocalizing with the host-protein LC3. (B) The graph indicates the fraction of LC3B-positive bacteria (green) related to the total number of intracellular bacteria. A total of ≥1000 analyzed cells (15 microscopic fields) of five different experiments. A series of optical sections (z-stacks) acquired by confocal microscopy were combined to generate a 3-D reconstruction. (C) 3-D reconstruction showing the data from the DAPI channel. The yellow arrowhead indicates bacterial DNA. (D) 3-D reconstruction showing data from blue (DAPI), green (LC3B), and red (LPS) channels. Note the colocalization of green (LC3B) and red (LPS) channels, seen as yellow hue. (E) Same as (D) but emphasizing two kinds of LC3B-positive vesicles; in purple: bacteria-free spheres (1–1.4 µm in diameter), and in green: bacteria-containing spheres (2–3 µm in diameter). (F) Same as (E) but highlighting only the large LC3B-positive vesicles containing bacteria (2–3 µm in diameter).

