Figure 7.
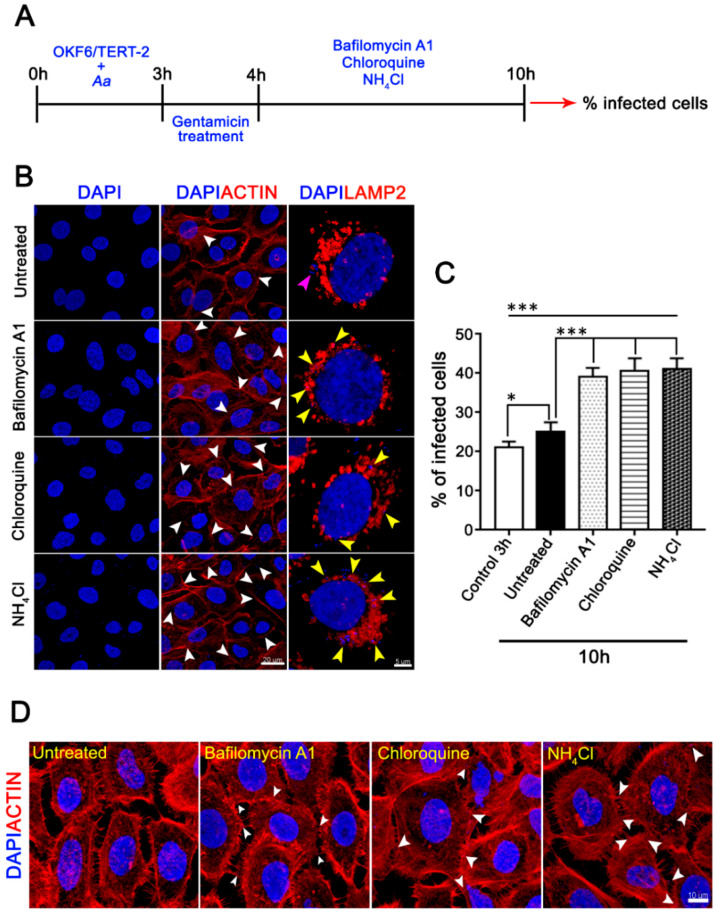
Effect of downstream autophagic inhibitors on host-cell infection by A. actinomycetemcomitans. (A) Scheme timing showing the experimental design. OKF6/TERT-2 cells were incubated sequentially with A. actinomycetemcomitans (MOI = 500), gentamicin to kill non-internalized bacteria, and then with the autophagic inhibitors. (B) Fixed and infected cells were labeled with phalloidin-Alexa 568 (red) for visualization of the actin cytoskeleton and DAPI (blue) for visualization of cell nuclei and internalized bacteria (right and central column, white arrowhead indicates infected cell, scale bar 20 µm). Fixed and infected cells immunostained with an anti-LAMP2 antibody for the visualization of lysosomes (orange) and DAPI (left column, scale bar 5 µm). Purple and yellow arrowheads indicate internalized bacteria and internalized bacteria colocalizing closely with the host-cells lysosomes, respectively. (C) The graph showed the percentage of infected cells from five independent experiments (≥1000 cells). (D) Magnification of confocal images showing bacteria colocalizing with intercellular actin protrusions (white arrowheads, scale bar 10 µm). * p < 0.05, *** p < 0.001.

