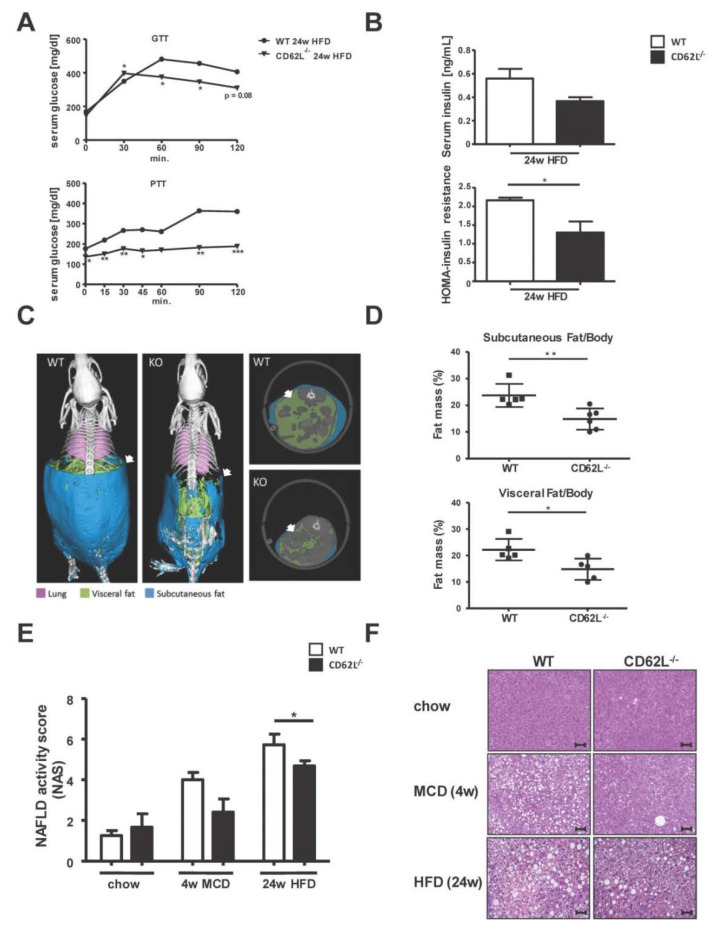
Figure 2.
CD62L−/− mice show less fat accumulation, steatosis, and metabolic changes during high fat diet (HFD) feeding. (A) Glucose (GTT) and pyruvate (PTT) tolerance test after 24 weeks HFD feeding in wild type (WT) and CD62L−/− mice. Animals were fasted for 6 h and blood glucose was monitored following intraperitoneal injection of either 2.0 g/kg glucose or 2.0 g/kg pyruvate (* p < 0.05, ** p < 0.01, *** p < 0.001). (B) Insulin levels in serum of WT and CD62L−/−animals after 24 weeks HFD treatment. The calculation of the HOMA-insulin resistance is based on plasma glucose and serum insulin levels (n = 8), (* p < 0.05). (C) Three-dimensional volume renderings of segmented bones (white), lungs (pink), visceral fat (green), and subcutaneous fat (blue) upon in vivo μCT imaging of WT and CD62L−/− mice after 24 weeks HFD feeding and 2D cross-sectional μCT images in transversal planes of the abdomen of mice. (D) Quantification of subcutaneous and visceral fat tissue (n = 6) of WT mice after 24 weeks of HFD. All data are expressed as mean ± SEM. Differences between WT and KO mice were determined using an unpaired, two-tailed t-test (* p < 0.05, ** p < 0.01). (E) Lower non-alcoholic fatty liver disease (NAFLD) activity score in CD62L−/− animals compared to WT mice after 4 w methionine and choline deficient (MCD) and 24 w HFD treatment. The used NAS considers steatosis, lobular inflammation and hepatocellular ballooning. The histopathological validation was performed by two board-certified veterinary pathologists (L.B. and A.B.). (F) Representative images of hematoxylin & eosin (H&E) stained livers of WT and CD62L−/− mice after chow, 4 w MCD or 24 w HFD feeding (400×, scale bars 50 µm, n = 8). All experiments were repeated at least twice.

