Abstract
Background
We investigated the correlation between glucose metabolism patterns of different immune cells and the metabolic regulatory signaling pathways in myasthenia gravis (MG) and aimed to identify therapeutic targets for MG.
Methods
We isolated peripheral blood mononuclear cells (PBMCs) and sorted CD19+B cells, dendritic cells (DCs), CD4+ T cells, CD8+ T cells, CD4+CD25+ regulatory T cells (Tregs), CD4+CD25−T cells, and T helper (Th) cells such as Th1, Th2, and Th17 cells. Then, we detected the expression levels of PI3K/AKT/mTOR-HIF-1α, GLUT1, hexokinase (HK), phosphofructokinase (PFK), and pyruvate kinase (PK) by RT-PCR, measured the oxygen consumption rate and extracellular acidification rate of ex vivo freshly sorted cells using the Seahorse XFe96 Analyzer. In addition, we compared the glycolysis levels using these cells from the same MG patients. By performing in vitro experiments, we measured, the mRNA expression levels of mTOR, HIF-1α, B cell activating factor receptor (BAFF-R), GLUT1, HK, PFK, and PK, in addition to ECAR profiles, frequency of CD80 and CD86, and IgG levels from the culture supernatant of B cells (isolated from MG patients) treated with rapamycin and PX-478 (selective mTOR and HIF-1α inhibitor, respectively) from.
Results
Except PBMCs, Th2 and CD8+ T cells, the expression levels of the key enzymes involved in glycolysis and HIF-1α were significantly higher in B cells, DCs, Tregs, CD4+CD25−T cells, and Th1 and Th17 cells in MG patients, and the measurement of ECAR and OCR confirmed the metabolic status. In MG patients, B cells and DCs showed significantly higher levels of glycolysis and glycolytic capacity than CD8+ T cells, CD4+ T cells and its subsets. In vitro, except IgG levels, the increased glycolysis levels, expression of key glycolytic enzymes, BAFF-R and frequency of CD80 and CD86 of B cells, could be inhibited by rapamycin and PX-478.
Conclusions
Different subtypes of immune cells in MG exhibit different glucose metabolism patterns. The mTOR-HIF-1α signaling pathway might be the immunometabolism reprogramming checkpoint of glycolysis-dependent activated B cells in MG.
Keywords: Myasthenia gravis (MG), immune cells, glucose metabolism, mTOR, HIF-1α
Introduction
Myasthenia gravis (MG) is an autoimmune disease of the neuromuscular junction, caused by antibodies that attack components of the postsynaptic membrane. The pathogenesis of this disease is not clear yet (1). Previous studies have shown that specific types of immune cells are involved in the pathogenesis of MG and in experimental autoimmune myasthenia gravis (EAMG). Autoreactive CD4+ T cells exert a core regulatory effect on the production of acetylcholine receptor (AChR) antibodies. The balance of Th1, Th2, Th17, and Tregs, subsets of CD4+ helper T cells, are redistributed during the development of MG/EAMG (2,3). Dendritic cells (DCs) connect the innate and adaptive immunity and play an important role in the activation of autoreactive T cells (4). B cells produce multiple autoantibodies in MG with the assistance of activated antigen-specific T cells, which result in the development of myasthenia symptoms (5). CD8+ T cells in muscle-specific tyrosine kinase (MuSK)-MG patients generally exhibit higher frequencies of multiple cytokine-producing cells (6).
Cellular metabolism has attracted a great deal of attention recently. A solid body of work has emphasized how cellular glucose metabolism shapes immune cell differentiation and function of conventional T, CD4+CD25+ regulatory T cells (Tregs), DCs and B cells, and how the utilization of metabolic substrates functionally regulates these cells (7,8).
Glucose is the major energy and nutrient source for immune cells. The glucose metabolism patterns are different, either in different immune cell subtypes or in different states such as, resting or activation (9). For example, immature DCs (imDCs) primarily rely on mitochondrial oxidative respiration (OXPHOS). When activated to mature DCs (mDCs), imDCs undergo drastic metabolic reprogramming with the upregulation of glucose utilization and activation of mitochondria independent glycolysis, which acts as a source of ATP and a major source of building blocks that are necessary for coping with massive proliferation and synthesis of effector molecules that support immune cell functions (10). These highly proliferative cells convert glucose into lactate in the presence of oxygen, which is termed as Warburg effect or aerobic glycolysis. Similar to DCs, the cellular metabolism of activated Th1 and Th17 cells also switch to aerobic glycolysis (11,12). In contrast, regulatory forkhead box P3 (FoxP3+) T cells and memory T cells primarily depend on FA oxidation (FAO) as a source of energy (12). When the resting naïve B cells are activated by helper T cells, the glycolysis levels and OXPHOS in activated B cells and plasma cells are significantly enhanced (13).
The process of metabolic changes of immune cells shares a common pathway with cell activation events, which are triggered by Toll-like receptors (TLRs) (DCs) or T cell receptors (TCRs) and costimulatory molecules (T cells) (10,14). Antigen-mediated T cell and imDCs signal via the PI3K/AKT pathway, subsequently activating mTOR which enhances HIF-1α transcription and translation (15). On one hand, HIF-1α activates the expression of GLUT-1 and increases glucose intake. On the other hand, HIF-1α activates the expression of numerous key glycolytic genes and increases glycolysis to supply energy and nutrients for rapid activation (16). Activated B cells also rely on glucose, and PI3K-AKT pathway promotes the process of glycolysis (17). The PI3K signaling pathway not only participates in B cell activation, but also plays a crucial role in B cell differentiation and survival (18). Activation of mTOR can influence a series of B cell related functions, including the proliferation of marginal zone B-cell, switching of IgG class, and differentiation of plasmablasts (19).
In summary, the PI3K/AKT-mTORC1 may be the common mechanistic regulatory pathway of immune cells (especially DCs, T helper cells, and B cells) involved in activation, differentiation, effector functions, and metabolic shift. HIF-1α is the junction point of the glycolytic and PI3K/AKT-mTOR regulatory pathways.
Over the years, few studies have characterized the metabolism of immune cells in the context of autoimmune diseases, such as systemic lupus erythematosus (20) and rheumatoid arthritis (21), but all of these studies are limited to a certain immune cell. Here, we explore glucose metabolism and metabolic regulatory pathways in different immune cells, and obtain real-time measurements of the OCR and ECAR for the ex vivo freshly sorted cells. By unveiling the underlying mechanism, we expect to “seek common ground while reserving”, intervene the whole immune response processes, and eventually reduce antibody production and relieve symptoms of myasthenia.
Methods
Participants and samples
All the MG patients and, age- and sex-matched healthy controls (HC) were recruited at the Neurology Department of Xiangya Hospital from February 2017 to May 2019. MG was diagnosed based on the combination of fluctuating muscle weakness, positive fatigue test, positive neostigmine test and positive abnormal repetitive nerve stimulation test. Age, gender, routine blood test, liver and kidney function, immunological function, thyroid function, thymus CT scan, MGFA classification, quantitative myasthenia gravis scores (QMGs), and autoantibody results, including anti-AChR antibody (ab) and MuSK ab, were recorded. AChR and MuSK antibody results were obtained from the DAAN Clinical Laboratory Central (Guangzhou, China). AChR expression levels greater than 0.45 nmol/L and MuSK ab levels greater than 0.5 nmol/L were considered as positive results. All MG patients had no prior history of treatment with glucocorticoids, immunosuppressive agents or thymectomy within three months. Patients were excluded if they had a history of additional autoimmune diseases. Approximately 200 mL of lymphoplasmapheresis (LPE)-exchanged blood samples or 60 mL of peripheral blood samples were collected from the patients. For HC, 60 mL of blood samples were collected. The study was approved by the local ethics committee (Ethics Committee of Xiangya Hospital, No. 201503282). All patients provided their written informed consent prior to inclusion into the study. The study was performed in accordance with the Declaration of Helsinki.
Human PBMC and immune cell isolation
Heparinized venous blood samples were obtained from each subject, and peripheral blood mononuclear cells (PBMCs) were isolated within 10 min of collection using lymphocyte isolation agent (TBD, Tianjin, China) by density gradient centrifugation. The PBMC pellet was resuspended in running buffer (Becton Dickinson, CA, USA) for downstream assay and cell density was determined using the Counter star automated cell counter (Alit, Shanghai, China).
CD4+ T cells, CD8+ T cells, CD19+B cells, DCs, CD4+CD25+ Tregs, and CD4+CD25−T cells were obtained from PBMCs of patients by magnetic separation (Miltenyi Biotec, Gladbach, Germany, the catalogue number of the kits used: 130-096-533; 130-096-495; 130-050-301; 130-091-379; 130-091-301, respectively), following the manufacturer’s instructions. Th1 cells (CD4+CXCR3+CCR6-), Th2 cells (CD4+CXCR3−CCR6−) and Th17 cells (CD4+CXCR3−CCR6+) were sorted based on immunophenotype marker expression as previously described (22,23). Briefly, freshly isolated PBMCs were stained with PerCP-Cy5.5-conjugated CD3 (Becton Dickinson, CA, USA, clone UCHT1), APC-Cy7-conjugated CD8 (Becton Dickinson, CA, USA, clone RPA-T8), FITC-conjugated CD4 (Becton Dickinson, CA, USA, clone RPA-T4), PE-conjugated CCR6 (Becton Dickinson, CA, USA, clone 11A9), and APC-conjugated CXCR3 (Becton Dickinson, CA, USA, clone 1C6/CXCR3). Cell sorting was performed on FACSCalibur (Becton Dickinson, CA, USA).
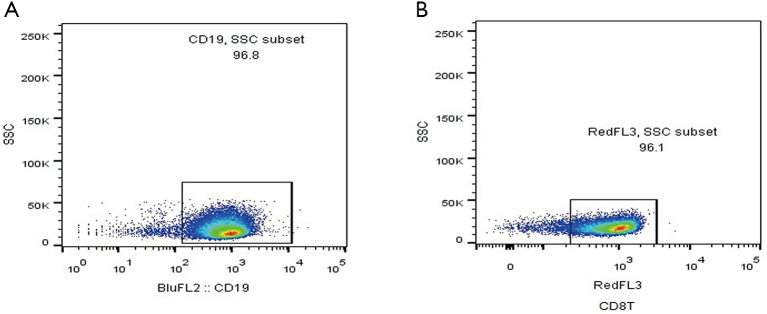
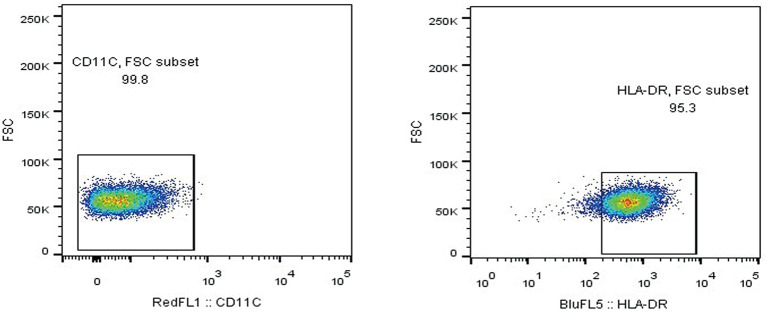
Purity of CD8+ T cells and CD19+B cells was monitored using flow cytometry and was typically >90% (Figure S1). Purity of CD4+CD25+ Tregs was approximately 85.8% (Figure S2), and purity of DCs was evaluated (Figure S3).
Figure S1.
Purity of B cells and CD8+ T cells after isolation by magnetic separation.
Figure S2.
Purity of Tregs after isolation by magnetic separation. Purity of Tregs was identified by CD4+CD25+FOXP3+ after isolation by magnetic separation.
Figure S3.
Purity of DCs was identified after isolation by magnetic separation. Purity of DCs was identified by CD11c−HLA-DR+ after isolation by magnetic separation. DC, dendritic cell.
Real-time quantitative PCR
Total RNA was isolated from CD19+B cells, DCs, CD4+CD25+ Tregs, CD4+CD25−T cells, CD8+ T cells, Th1, Th2, and Th17 using TRIzol reagent (Invitrogen, Carlsbad, USA) following the manufacturer’s instructions. The concentration of total RNA was determined on Epoch (Bio Tek, USA), and all samples exhibited an absorbance ratio between 1.8 and 2.0 at 260/280 nm. Purified RNA (500 ng) was reverse transcribed using 5X All-In-One RT MasterMix (with AccuRT Genomic DNA Removal Kit) (abm, Canada). PCR amplification was performed on a real-time PCR system (Step One plus, ABI, USA) using EvaGreen 2X qPCR MasterMix-ROX (abm, Canada). All samples were run in triplicate, and Actin was used as an endogenous control gene to normalize gene expression levels. Relative gene expression levels were analyzed using the 2-ΔΔCt method. Tregs mainly depend on FAO as a source of energy. Therefore, we detected the expression of carnitine palmitoyl transferase 1A (CPT1A) which is the key enzyme of FAO, in Tregs. The following qPCR primers were used in this experiment: Beta-Actin-F: CGTCTTCCCCTCCATCGT, Beta-Actin-R: GAAGGTGTGGTGCCAGATTT; HK2-F: GGATCCCTCAACCCTGGAAA, HK2-R: CGATGGCTGACACATCACTG; PFKP-F: TGTGTTCATGTTGGAGACCA, PFKP-R: GTCATGGCACTTCTCGTTCC; PK-F: GCACACCGTATTCAGCTCTG, PK-R: TCCAGGAATGTGTCAGCCAT; CPT1A-F: AGCACGGCAAGATGAGTCG, CPT1A-F: CCTCACCGACTGTAGATACCTGTT; GLUT1-F: TATCTGAGCATCGTGGCCAT, GLUT1-R: AAGACGTAGGGACCACACAG; PIK3CA-F: CCTATTGTCGTGCATGTGGG, PIK3CA-R: TCCATGAAATCTGGTCGCCT; AKT1-F: CGACGTGGCTATTGTGAAGG, AKT1-R: GATGATGAAGGTGTTGGGCC; mTORC1-F: AGTAGCATGAACCCTGCCTT, mTORC1-F: CTGGGTTTGGATCAGGGTCT; HIF-1α-F: TCCAAGAAGCCCTAACGTGT, HIF-1α-R: TGATCGTCTGGCTGCTGTAA.
Metabolic analysis
Metabolic analysis was performed using the Extracellular Flux Analyzer XFe96 (Seahorse Bioscience, USA). To investigate the closest state in vivo, the ex vivo sorted immune cells were obtained, different number of cells were seeded into a 0.05 mg/mL Poly-L-lysine hydrobromide -coated microplate (Sigma, USA) for adhesion of immune cells. The OCR (pmoles/min/µg protein) and ECAR (mpH/min/µg protein) were measured by using the XF mitochondrial stress test kit and XF glycolysis stress test kit (Agilent Technologies, USA), respectively. For evaluating mitochondrial stress, cells were resuspended in seahorse basic medium supplemented with 14.0 mM glucose, 1.0 mM pyruvate, and 2.0 mM L-glutamine according to the manufacturer’s instructions, and injections of oligomycin, carbonyl cyanide-4-(trifluoromethoxy) phenylhydrazone (FCCP; 1 µM), rotenone and antimycin (both 0.5 µM). For examining glycolysis, cells were resuspended in seahorse basic medium supplemented with 1.0 mM L-glutamine and with use of injections glucose (10.0 mM), oligomycin and 2-deoxy-D-glucose (50 mM). After completion of the bioenergetic assays, the plate was centrifuged at 1,200 g for 5 min and the medium was removed completely. Lysis buffer (30 µL) was added to each well. After resting on ice for 30 min, the plate was centrifuged at 1,200 g for 15 min, and subsequently, BCA assay (Dingguo, Beijing, China) was performed to measure the protein concentration.
The detailed information regarding number of cells seeded and oligomycin concentration has been mentioned in the results section. Calculations for metabolic parameters have been done according to the manufacturer’s instructions (Seahorse Bioscience).
B cells from MG patients cultured in vitro with mTOR and HIF-1α
The B cells sorted from MG patients were seeded in a 96-well plate at 3×10⁵ cells per well. Cells were cultured in RPMI-1640 medium supplemented with 10% fetal bovine serum (Gibco, USA), 50 ng/mL lipopolysaccharides (LPS) (Sigma, USA), 10,000 U/mL penicillin and 100 mg/mL streptomycin at 37 °C in a humidified atmosphere with 5% CO2. To investigate the effect of rapamycin or PX-478 (selective inhibitors of mTOR and HIF-1α respectively, Sigma), either 200 nM of rapamycin (24) or 20 µM of PX-478 (25) were added to the cells and incubated for 24 h. Then, the culture supernatants were collected to detect the IgG levels by ELISA (Cusabio, China). B cells were used to measure the ECAR, expression of key glycolytic enzymes, mTOR and HIF-1α and, frequency of BV421-conjugated CD80 (Becton Dickinson) and PE-Cy™7-conjugated CD86 (Becton Dickinson, USA).
Statistical analysis
Data are expressed as the mean ± standard error of mean (SEM). Two-tailed Student’s t-test (paired or unpaired) was performed for comparisons between two groups. Results were considered as statistically significant when P<0.05, P<0.01, P<0.001. Statistical analyses were performed using GraphPad Prism 5 software.
Results
Clinical characteristics of MG patients
The general characteristics of MG patients are mentioned in Table 1. No significant differences in age or gender ratios were observed between MG patients and HC for each sorted immune cell (Tables 2,3).
Table 1. Clinical characteristics of MG patients.
| Sample ID (Group 1) | Age (y) | Male /female (M/F) | Thymic pathology* | MGFA classification | QMGs | AChR-Ab (nmol/L) | MuSK-Ab |
|---|---|---|---|---|---|---|---|
| MH20 | 46 | F | 2 | IIIb | 19 | 31.97 | Negative |
| MH22 | 68 | M | 0 | IIIa | 16 | Negative | Negative |
| MH23 | 31 | F | 0 | IIIb | 17 | None | None |
| MH25 | 42 | M | 2 | IIIb | 24 | None | None |
| MH26 | 49 | F | 2 | V | 21 | 32.95 | Positive |
| MH27 | 71 | F | 0 | IIIb | 23 | 3.81 | Negative |
| MH28 | 70 | M | 0 | IIIb | 22 | 15.27 | Negative |
| MH29 | 57 | F | 0 | IIIb | 23 | Negative | Negative |
| MH30 | 36 | F | 1 | IIIb | 23 | Positive | Negative |
| MH32 | 52 | F | 2 | IIIb | 16 | None | None |
| MH33 | 38 | M | 2 | IVb | 27 | 31.93 | Negative |
| MH34 | 34 | M | 2 | IIIb | 21 | 35.21 | Negative |
| MH35 | 64 | M | 2 | IIIb | 17 | 29.09 | Negative |
| MH38 | 52 | M | 2 | IIIb | 18 | 41.6 | Negative |
| MH40 | 47 | M | 0 | IIIb | 19 | Negative | Positive |
| MH41 | 52 | F | 0 | IIIb | 19 | None | None |
| MH42 | 45 | F | 0 | IVa | 28 | 36.59 | Negative |
| MH45 | 58 | F | 0 | IIIb | 20 | None | None |
| MH47 | 45 | F | 2 | IIIb | 17 | 29.23 | Negative |
| MH48 | 34 | F | 2 | IIIb | 19 | None | None |
| MH50 | 25 | M | 0 | IIb | 16 | 45.27 | Negative |
| MH51 | 22 | F | 0 | IVb | 28 | 9.13 | Negative |
| MH52 | 61 | M | 2 | IIIb | 21 | None | None |
| MH56 | 29 | M | 2 | IVb | 28 | 49.42 | Negative |
| MH58 | 17 | M | 1 | IIIb | 28 | 3.46 | Negative |
| MH59 | 46 | M | 0 | IVb | 23 | 48.08 | Negative |
| MH61 | 54 | M | 2 | IIIb | 24 | 36.26 | Negative |
| MH62 | 47 | F | 0 | IIIa | 24 | 1.04 | Negative |
*, thymus: 0, normal; 1, thymic hyperplasia; 2, thymoma. MG, myasthenia gravis.
Table 2. Population characteristic data of MG and healthy controls for sorting B cells, DCs and CD4+CD25+ Tregs.
| B cells | DC | Tregs | |||||||||
|---|---|---|---|---|---|---|---|---|---|---|---|
| HC (n=10) | MG (n=19) | P value | HC (n=11) | MG (n=14) | P value | HC (n=11) | MG (n=14) | P value | |||
| Mean age (years, mean ± SD) | 37.7.0±11.5 | 41.4±14.7 | 0.456 | 37.7±12.0 | 43.9±16.4 | 0.321 | 35.8±11.2 | 40.2±14.1 | 0.357 | ||
| Gender (male/female) | 7/3 | 9/10 | 0.244 | 7/4 | 9/5 | 0.973 | 7/4 | 8/6 | 0.742 | ||
DC, dendritic cell; MG, myasthenia gravis.
Table 3. Population characteristic data of MG and healthy controls for sorting Th1, Th2, Th17 and CD8+T cells.
| HC (n=9) | MG (n=10) | P value | |
|---|---|---|---|
| Mean age (years, mean ± SD) | 36.1±10.8 | 38.1±15.2 | 0.749 |
| Gender (male/female) | 5/4 | 5/5 | 0.808 |
HC, healthy controls; MG, myasthenia gravis.
FACS sorting of Th1, Th2, and Th17, subsets of CD4+ T cells
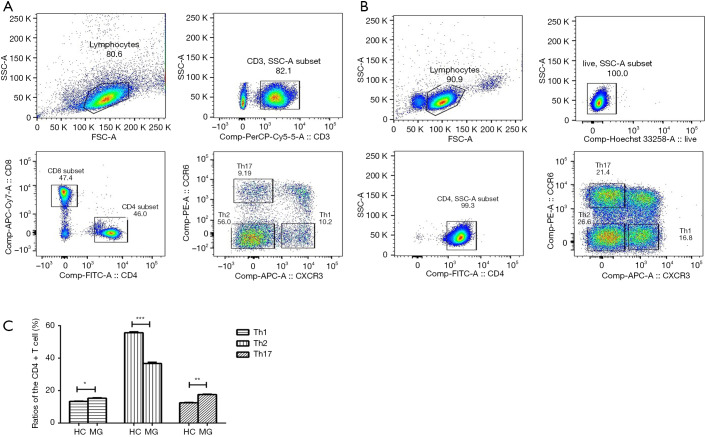
The CD4+ T cell subsets such as Th1, Th2, and Th17 cells were sorted using FACS in HC and MG patients (Figure 1A,B). We analyzed the ratios of CD4+ T cell subsets, including Th1/Th2/Th17. Compared to HC, the ratio of Th2 was significantly decreased in MG patients (55.66±0.56 vs. 36.73±0.74), while that of Th1 and Th17 was significantly increased (13.37±0.15 vs. 15.84±0.19, 12.53±0.18 vs. 17.55±0.25 respectively) (Figure 1C).
Figure 1.
FACS sorting Th1, Th2 and Th17 of CD4+ T cells subsets. (A) Th1, Th2 and Th17 of CD4+ T cells subsets in HC; (B) Th1, Th2 and Th17 of CD4+ T cells subsets in MG patients; (C) statistical analysis of the ratios of the CD4+ T cell subsets, including the Th1/Th2/Th17 subsets. Compared to the HC, the ratios of Th2 were significantly decreased and Th1, Th17 were significantly increased in MG patients. n=21 in HC, n=16 in MG. *, P<0.05; **, P<0.01; ***, P<0.001. HC, healthy controls; MG, myasthenia gravis.
Expression of key enzymes of glycolysis and key regulators of the PI3K/AKT/mTOR/ HIF-1α pathway
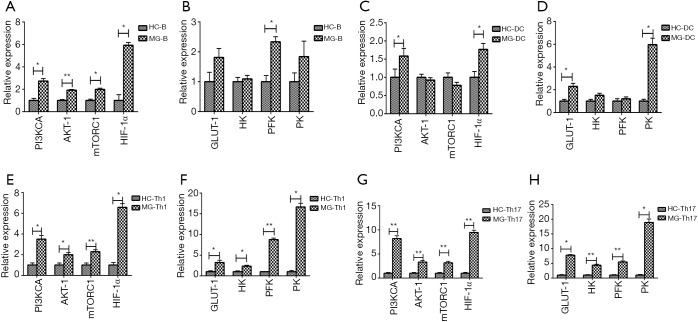
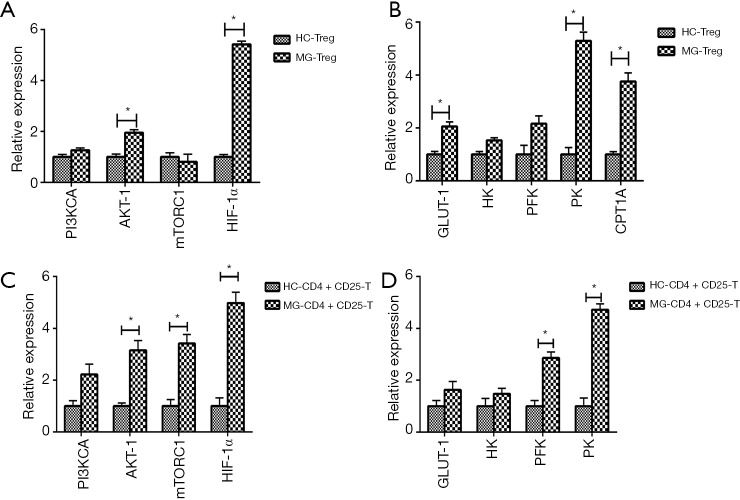
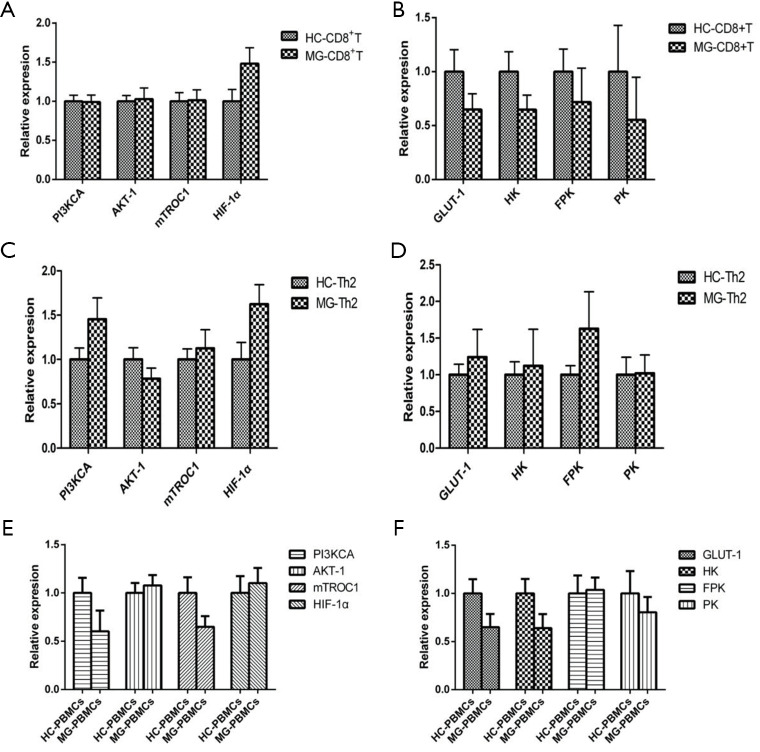
The expressions of PI3KCA, AKT-1, mTORC1, HIF-1α, and PFK were significantly increased in B cells of MG patients compared to HC (Figure 2A,B). The expressions of PI3KCA, HIF-1α, GLUT-1, and PFK were significantly upregulated in DCs of MG patients compared to HC (Figure 2C,D). The expression levels of PI3KCA, AKT-1, mTORC1, HIF-1α, GLUT1, HK, PFK, and PK were considerably increased in Th1 cells of MG patients compared to HC (Figure 2E,F). The expressions of PI3KCA, AKT-1, mTORC1, HIF-1α, GLUT1, HK, PFK, and PK were significantly increased in Th17 cells of MG patients compared to HC (Figure 2G,H). The expressions of AKT-1, HIF-1α, GLUT1, PK, and CPT1A were significantly increased in CD4+CD25+ Tregs of MG patients compared to HC (Figure 3A,B). The expression levels of AKT-1, mTORC1, HIF-1α, PFK and PK were remarkably increased in CD4+CD25−T cells of MG patients compared to HC (Figure 3C,D). There were no significant differences in the expression levels in CD8+ T cells, Th2 cells, and PBMCs between MG patients and HC (Figure S4).
Figure 2.
Expression of the key enzymes of glycolysis and key regulators of the PI3K/AKT/mTOR/HIF-1α in B cells, DCs, Th1 and Th17. (A,B) Expression of PI3KCA, AKT-1, mTORC1, HIF-1α and PFK were significantly increased in B cells. n=10 in HC, n=19 in MG; (C,D) expression of HIF-1α, GLUT-1 and PK were significantly increased in DCs. n=11 in HC, n=14 in MG; (E,F) expression of PI3KCA, AKT-1, mTORC1, HIF-1α, GLUT1, HK, PFK and PK were significantly increased in Th1 cells; (G,H) expression of PI3KCA, AKT-1, mTORC1, HIF-1α, GLUT1, HK, FPK, and PK were significantly increased in Th17 cells. n=9 in HC, n=10 in MG. HC, healthy controls; MG, myasthenia gravis. *, P<0.05 vs. HC; **, P<0.01.
Figure 3.
Expression of the key enzymes of glycolysis and FAO and key regulators of the PI3K/AKT/mTOR/HIF-1α in CD4+CD25+ Tregs and CD4+CD25− T cells. (A,B) Expression of AKT-1, HIF-1α, GLUT1, PK and CPT1A were significantly increased in CD4+CD25+ Treg cells. n=11 in HC, n=14 in MG; (C,D) expression of AKT-1, mTORC1, HIF-1α, PFK and PK were significantly increased in CD4+CD25− T cells. n=11 in HC, n=14 in MG. HC, healthy controls; MG, myasthenia gravis. *, P<0.05 vs. HC.
Figure S4.
Expression of the key enzymes of glycolysis and key regulators of the PI3K/AKT/mTOR/HIF-1α in PBMCs, CD8+T cells and Th2. (A,B) No significant expression difference were found in CD8+T cells. n=10 in HC, n=11 in MG. (C,D) No significant expression difference were found in Th2. n=9 in HC, n=10 in MG. (E,F) No significant expression difference were found in PBMCs. n=10 in HC, n=10 in MG. HC, healthy controls; MG, myasthenia gravis.
Measurement of the OCR and ECAR of the sorted immune cells
Bioenergetic profiles of the different immune cell subtypes from HC versus MG patients
To confirm the bioenergetic profiles of the immune cells mentioned above, the OCR and ECAR (linked to oxidative phosphorylation and glycolysis, respectively) were measured in each type of freshly sorted immune cells.
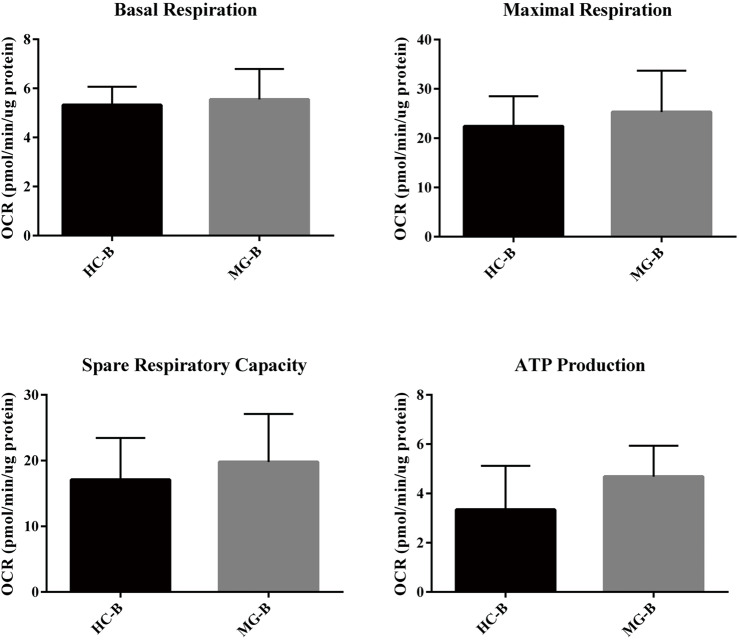
B cells (5.0×10⁵ cells/well) were seeded, and OCR and ECAR were measured between HC and MG patients and typical profiles were obtained (Figure 4A,B). Evaluation of oxidative phosphorylation (OXPHOS) parameters indicated that there were no significant differences in basal respiration, maximum respiration, spare respiratory capacity, and ATP production (Figure S5). Regarding glycolytic parameters, B cells exhibited significantly higher levels of glycolysis in MG patients compared to HC, while there were no significant differences in the glycolytic capacity and glycolytic reserve (Figure 4C).
Figure 4.
The bioenergetics profile of B cells from HC and MG patients. B cells from HCs and MG patients were compared for (A) mitochondrial stress profiles with injections oligomycin (1 µM), FCCP (1 µM) and antimycin A/rotenone (both 0.5 µM); (B) glycolysis stress profiles with injections glucose (10 mM), oligomycin (3 µM) and 2-DG (50 mM); (C) comparative glycolytic parameters of B cells from HC and MG patients. All data are normalized to µg protein and shown as mean ± standard error (n=6). Statistical differences are reported in the text. *, P<0.05. HC, healthy controls; MG, myasthenia gravis.
Figure S5.
Oxidative phosphorylation (OXPHOS) parameters of B cells.
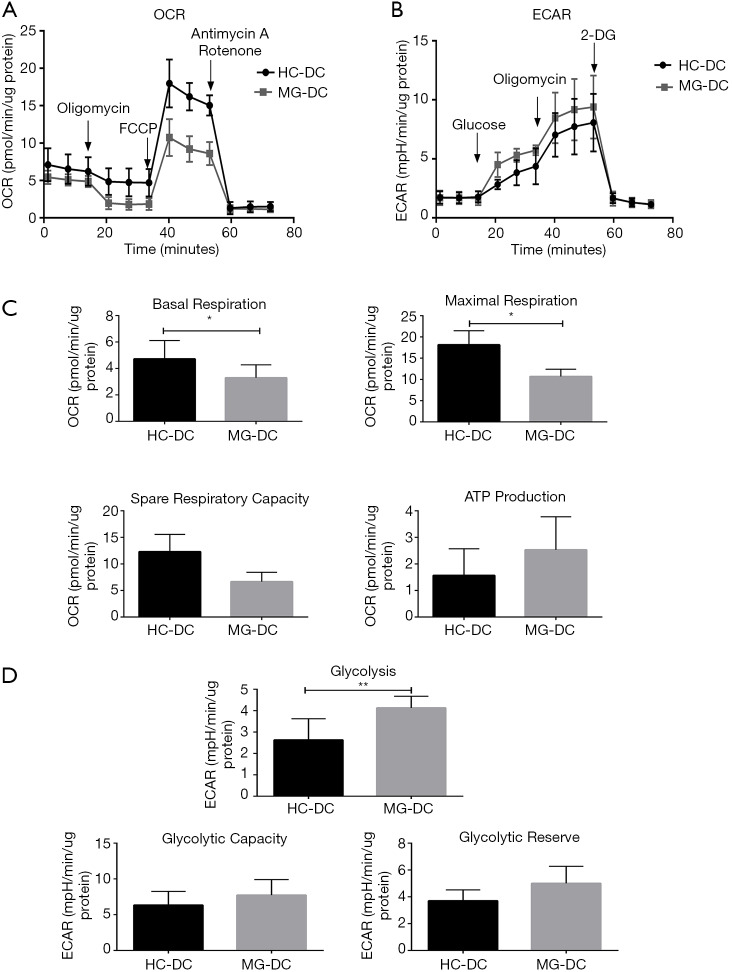
DCs, 3.0×10⁵ and 4.0×10⁵ cells/well were seeded to measure OCR and ECAR respectively, both of which showed typical profiles (Figure 5A,B). In addition, there were significantly lower levels of basal and maximum respiration in MG patients (Figure 5C). On the contrary, DCs had significantly higher levels of glycolysis and increased tendency of glycolytic capacity and glycolytic reserve in MG patients (Figure 5D).
Figure 5.
The bioenergetics profile of DCs from HC and MG patients. DCs from HCs and MG patients were compared for (A) mitochondrial stress profiles with injections oligomycin (2 µM), FCCP (1 µM) and antimycin A/rotenone (both 0.5 µM); (B) glycolysis stress profiles with injections glucose (10 mM), oligomycin (3 µM) and 2-DG (50 mM); (C) comparative OXPHOS parameters and (D) glycolytic parameters of DCs from HC and MG patients (n=6). Statistical differences are reported in the text. *, P<0.05; **, P<0.01. HC, healthy controls; MG, myasthenia gravis.
In the case of CD4+ T cell subsets, all the cells showed typical profiles for OCR in HC and MG patients. For ECAR, typical profiles were observed in Th1 and Th17, rather than Tregs, CD4+CD25−T cells and Th2, and the latter showed increased ECAR upon addition of glucose but failed to show a further increase after addition of oligomycin.
For Th1, 3.0×10⁵ and 4.0×10⁵ cells/well were seeded for OCR and ECAR measurements, respectively (Figure S6). There were no significant differences in OXPHOS and glycolytic parameters in MG patients. However, Th1 showed increased tendency of glycolysis in MG patients (Figure S6).
Figure S6.
The bioenergetics profile of Th1 cells from HC and MG patients. Th1 cells from HCs and MG patients were compared for (A) mitochondrial stress profiles with injections oligomycin (2 µM), FCCP (1 µM) and antimycin A/rotenone (both 0.5 µM); (B) glycolysis stress profiles with injections glucose (10 mM), oligomycin (3 µM) and 2-DG (50 mM); (C) glycolytic parameters of Th1 cells from HC and MG patients (n=6). Statistical differences are reported in the text.
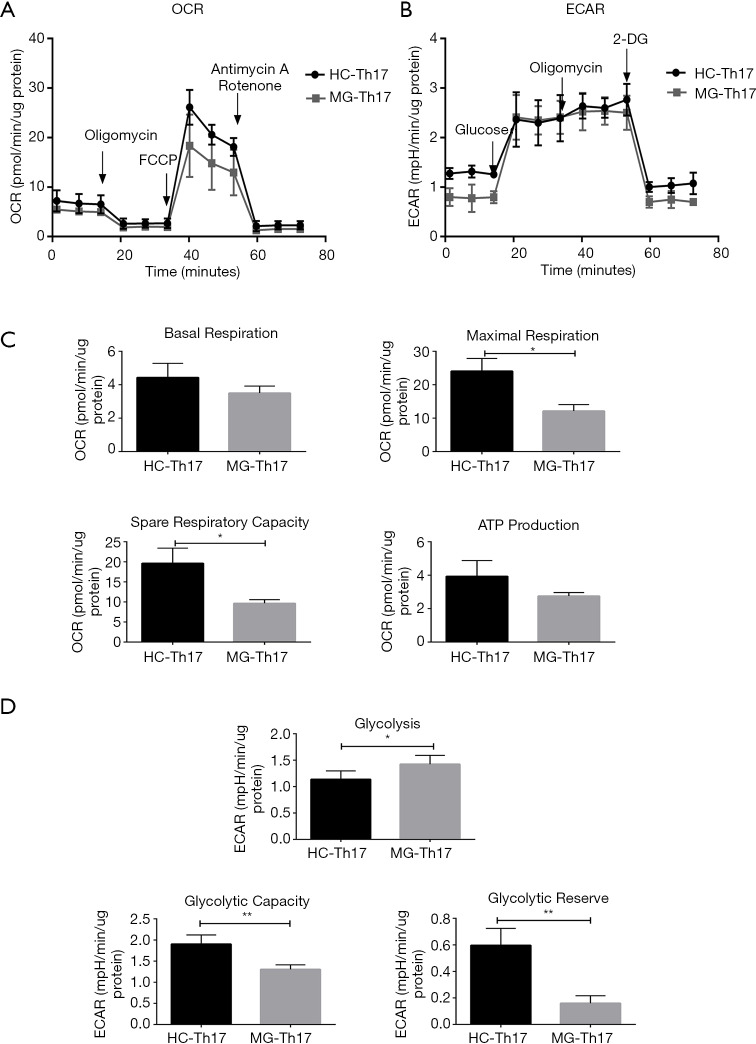
For Th17, 4.0×10⁵ cells/well were seeded for OCR and ECAR measurements (Figure 6A,B), and the levels of maximum respiration and spare respiratory capacity in MG patients were significantly lower, in addition to reduction tendency in basal respiration and ATP production (Figure 6C). In contrast, Th17 had significantly higher levels of glycolysis, glycolytic capacity and glycolytic reserve in MG patients (Figure 6D).
Figure 6.
The bioenergetics profile of Th17 cells from HC and MG patients. Th17 from HCs and MG patients were compared for (A) mitochondrial stress profiles with injections oligomycin (2 µM), FCCP (1 µM) and antimycin A/rotenone (both 0.5 µM); (B) glycolysis stress profiles with injections glucose (10 mM), oligomycin (3 µM) and 2-DG (50 mM); (C) comparative OXPHOS parameters and (D) glycolytic parameters of Th17 from HC and MG patients (n=6). Statistical differences are reported in the text. *, P<0.05; **, P<0.01. HC, healthy controls; MG, myasthenia gravis.
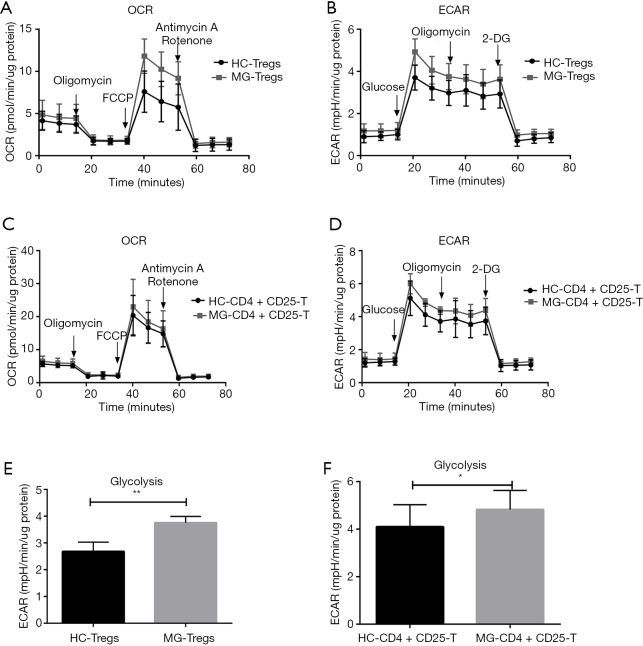
For Tregs, 4.0×10⁵ cells/well were seeded, and OCR and ECAR were measured (Figure 7A,B). Compared to HC, there were no significant differences of OXPHOS parameters in MG patients. For CD4+CD25−T cells, 5.0×10⁵ cells/well were seeded, and OCR and ECAR were measured (Figure 7C,D). However, Tregs showed significantly higher levels of glycolysis (Figure 7E). CD4+CD25−T cells also had significantly higher levels of glycolysis (Figure 7F) and showed no significant difference in OXPHOS parameters.
Figure 7.
The bioenergetics profile of Tregs and CD4+CD25− T cells from HC and MG patients. Tregs and CD4+CD25− T cells from HCs and MG patients were compared for (A,C) mitochondrial stress profiles with injections oligomycin (2 µM), FCCP (1 µM) and antimycin A/rotenone (both 0.5 µM). (B,D) Glycolysis stress profiles with injections glucose (10 mM), oligomycin (3 µM) and 2-DG (50 mM). Glycolytic parameters of Tregs (E) and CD4+CD25− T cells (F) from HC and MG patients (n=6). Statistical differences are reported in the text. *, P<0.05; **, P<0.01. HC, healthy controls; MG, myasthenia gravis.
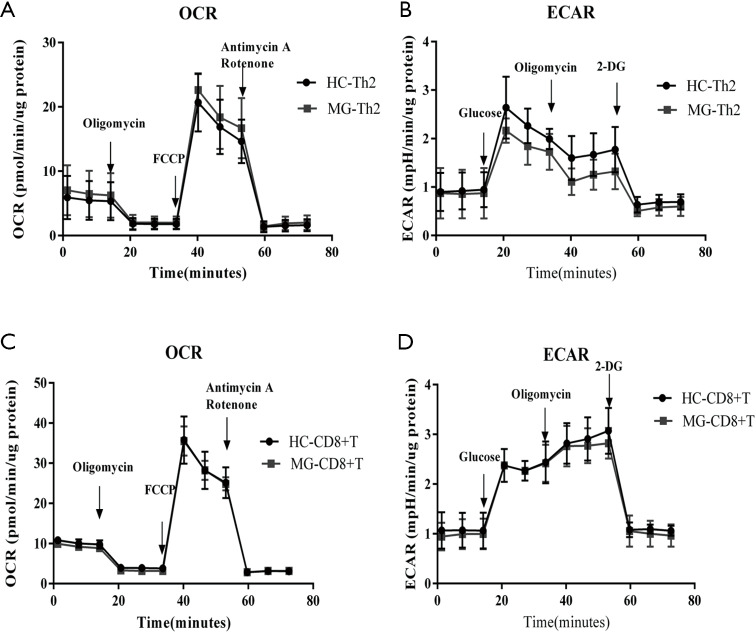
For Th2 and CD8+ T cells, 5.0×10⁵ cells/well were seeded, and OCR and ECAR were measured (Figure S7), and there were no significant differences in OXPHOS and glycolytic parameters.
Figure S7.
The bioenergetics profile of Th2 and CD8+ T cells from HC and MG patients. Th2 and CD8+ T cells from HCs and MG patients were compared for (A,C) mitochondrial stress profiles with injections oligomycin (2 µM), FCCP (1 µM) and antimycin A/rotenone (both 0.5 µM). (B,D) Glycolysis stress profiles with injections glucose (10 mM), oligomycin (3 µM) and 2-DG (50 mM). All data are normalized to µg protein and shown as mean ± standard error (n=6).
For PBMCs, 4.0×10⁵ cells/well were seeded to measure OCR and ECAR, and both showed typical profiles, and there were no significant differences in OXPHOS and glycolytic parameters.
Glycolytic profile of different subtypes of immune cells in MG patients
From the above results, we found that the glycolysis levels of B cells, DCs, Tregs, Th1, Th17, and CD4+CD25−T cells, were significantly higher in MG patients than HC, except for Th2, CD8+ T cells and PBMCs.
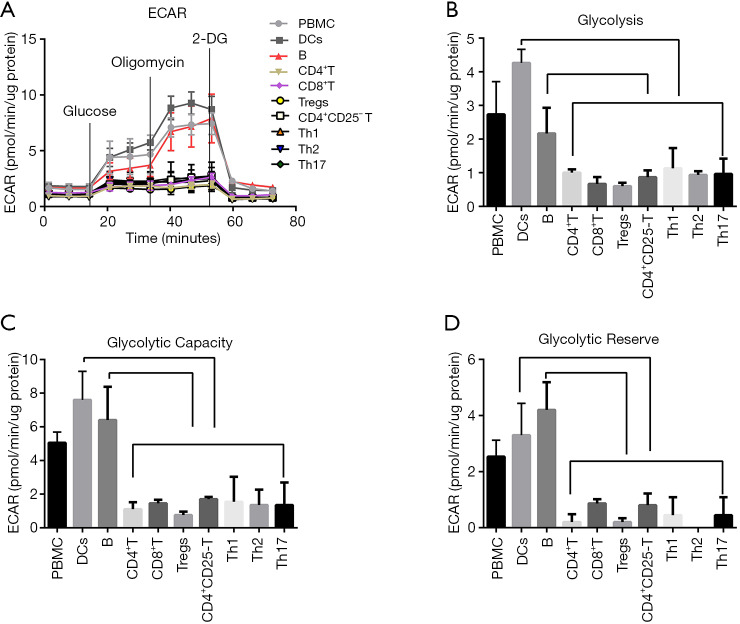
In order to further confirm the comparative glycolysis levels of different immune cell subtypes in MG, we sorted the PBMCs, CD4+ T cells, CD8+ T cells, B cells, DCs, Tregs, CD4+CD25−T cells, Th1, Th2, and Th17 cells from the same patient. Cells (4.0×10⁵ cells/well) were seeded to measure the ECAR (Figure 8A). In MG patients, compared to CD8+ T cells, CD4+ T cells and its subsets, the B cells and DCs, showed significantly higher glycolysis, glycolytic capacity and glycolytic reserve (Figure 8B,C,D, P<0.05).
Figure 8.
The glycolytic profile of different subtypes’ immune cells from MG patients. CD4+ T cells, CD8+ T cells, B cells, DCs, Tregs, CD4+CD25− T cells, Th1, Th2 and Th17 cells from the same MG patient were compared for (A) glycolysis stress profiles with injections glucose (10 mM), oligomycin (3 µM) and 2-DG (50 mM). (B,C,D) Glycolytic parameters of all kinds of cells from MG patients (n=3). Statistical differences are reported in the text.
Inhibiting mTOR and HIF-1α attenuated the higher glycolysis levels and activation of B cells in vitro
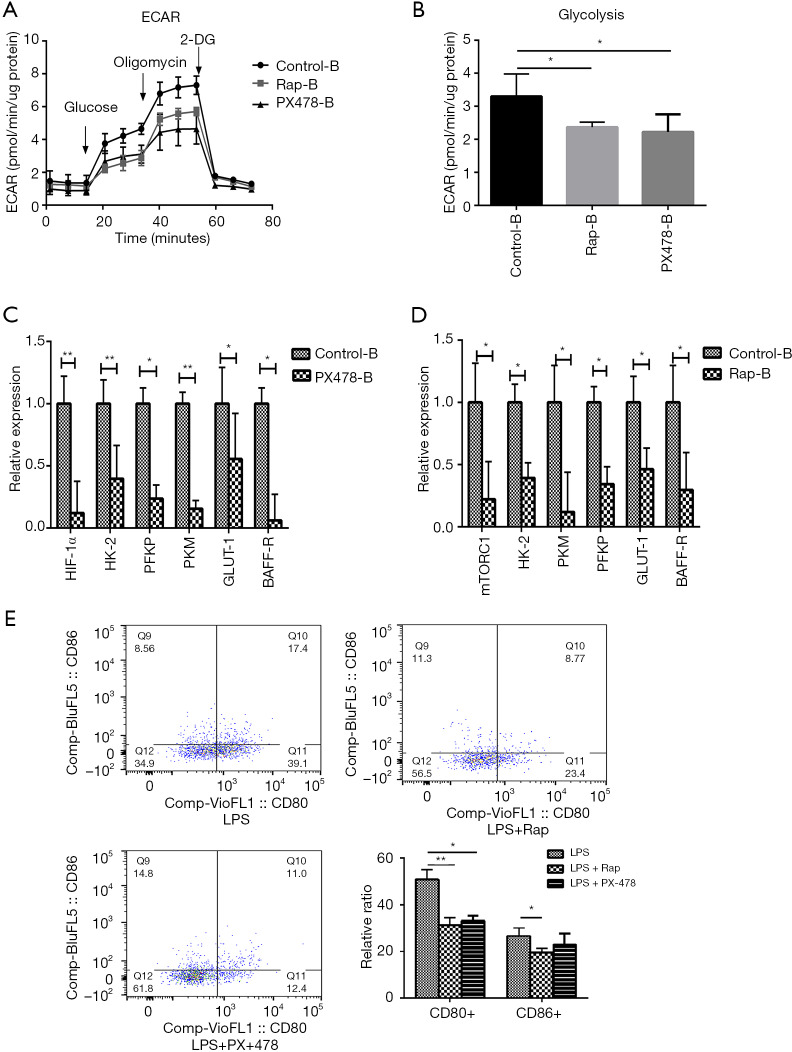
Considering that there was higher expression of glycolytic enzymes, mTORC1, HIF-1α, and higher levels of glycolysis in B cells in MG patients, the selective inhibitors of mTOR (rapamycin) and HIF-1α (PX-478) were used to explore the interventional effect on B cells in MG patients. In B cells, both rapamycin- and PX-478-treated groups could significantly decrease the glycolysis levels (Figure 9A,B) and the expression of key glycolytic enzymes, as well as that of mTORC1, HIF-1α, BAFF-R and GLUT1 (Figure 9C,D) and also the frequency of CD80 and CD86 in B cells (Figure 9E). However, there were no significant changes in IgG levels in the culture supernatant (Figure S8).
Figure 9.
Inhibiting mTOR and HIF-1α attenuated the glycolysis levels and the activation of B cells in vitro. In vitro measurement of glycolytic profile of B cells from MG patients by inhibiting mTOR and HIF-1α (A) glycolysis stress profiles with injections glucose (10 mM), oligomycin (3 µM) and 2-DG (50 mM). (B) Glycolysis levels of B cells from MG patients under different treats, statistical differences are reported in the text. The expression of glycolytic key enzymes, mTORC1, HIF-1α, BAFF-R and GLUT1. (C,D) Compared to control group, the expression of glycolytic key enzymes, mTORC1, HIF-1α, BAFF-R and GLUT1 were significantly decreased in the PX-478 and Rap (rapamycin) group, respectively (n=5 with three replicates). (E) When B cells stimulated with LSP, the frequency of CD80 were significantly decreased under the Rap and PX-478 treatment, and the frequency of CD86 were significantly decreased under Rap treatment (n=6 with three replicates). *, P<0.05; **, P<0.01.
Figure S8.

IgG levels in the culture supernatant of B cells in vitro. Compared with Control-B (untreated group), there were no significant changes of IgG levels in the culture supernatant under the Rap and PX-478 treatment (n=8).
Discussion
MG is an autoimmune disease involving multiple immune cells like DCs, T cells and B cells. Our study is the first to investigate the glucose metabolism patterns in multiple subtypes of immune cells in MG patients. We suggest that the mTOR-HIF-1α signaling may be the potential immunometabolism reprogramming checkpoint in MG.
This discussion is based on the immune response processes in the pathogenesis of MG. When antigen-presenting cells (DCs) recognize pathogenic antigens, autoreactive T cells are activated which in turn trigger the activation and imbalance of autoreactive CD4+ T cells (Th1, Th2, and Th17). This leads to the activation of autoreactive B cells, which produce autoantibodies and result in the symptoms of myasthenia. These processes are accompanied by orchestrated immunometabolic shift and metabolic regulation. Our study found that the expression levels of the key enzymes of glycolysis and HIF-1α were significantly higher in DCs, Th1, Th17, and B cells. These results were further confirmed by the measurement of ECAR, which indicated that DCs, Th1, Th17, and B cells exhibited significantly higher levels of glycolysis in MG patients.
The imDCs mediate and maintain peripheral T cell tolerance via the induction of the differentiation of naïve T cells to Tregs, and inhibit pathological autoimmune responses (26). Upon activation by TLR ligands, quiescent imDCs undergo differentiation into mDCs, which significantly enhance the stimulation and activation of naïve CD4+ T and CD8+ T cells (27). The dominant cellular metabolism of DCs shifts from OXPHOS to glycolysis, which is a metabolic reprogramming process coregulated by HIF-1α and the PI3K-AKT-mTOR pathway (7,10,14). In accordance with these reports, our study also presented significantly increased expression of PI3KCA, HIF-1α, GLUT-1, and PK in DCs from MG patients. Besides, the bioenergetic profiles of DCs showed that increased glycolysis was accompanied by decreased OXPHOS parameters.
In B cells, we found that the expression levels of PI3KCA, AKT-1, mTORC1, HIF-1α, and PFK were significantly increased in MG patients, and ECAR exhibited significantly higher levels of glycolysis. These results suggest that the PI3K/AKT/mTOR-HIF-1α signaling might be related to B cell metabolism. This is consistent with previous studies. B cell receptor (BCR) engagement also increased GLUT1 surface expression and upregulated glycolysis in a PI3K-AKT-dependent manner (28). After BCR or LPS stimulation, both glycolysis and OXPHOS provide energy for activated B cells, and the PI3K-AKT pathway plays an important role in the upregulation of glycolysis (17,29,30). Chronic stimulation of B cell-activating factor (BAFF) increases glycolysis, suggesting that the antibody production in vivo depends on glycolysis, which is HIF-1α-dependent and facilitates B cell expansion (31). In addition, since MG is an autoimmune disease, the activation of B cells plays a key role in the pathogenesis of MG. We found that B cells showed comparatively higher levels of glycolysis and glycolytic capacity than CD8+ T cells, CD4+ T cells and its subsets in the same MG patient. Notably, mTOR, a member of the PI3K-related kinase family, is the central metabolic sensor, regulates the conversion of glucose metabolism to glycolysis, and enhances glycolytic-dependent HIF-1α expression at the transcriptional and translational levels (15). In our study, we used rapamycin and PX-478 to explore the interventional effect on glycolysis levels in LPS-stimulated B cells from MG patients. We found that both the rapamycin- and PX-478-treated groups could significantly decrease the higher glycolysis levels and the expression of key glycolytic enzymes and BAFF-R in B cells. Moreover, the activation markers of B cells (CD80 and CD86) were also downregulated by rapamycin and PX-478.
A previous study showed that BAFF-induced B cell growth could be inhibited by rapamycin treatment, which is a therapeutic strategy that simultaneously inhibits mTOR-targeted pathogenic B cells (30). Meng et al. demonstrated that HIF-1α-dependent glycolysis supported the growth of CD1dhiCD5+ B cells and regulated IL-10 expression (31). And the attenuated mTORC1-glycolysis pathways activation could inhibit the differentiation of human unswitched memory B cells into plasmablast (32). Our results suggested that mTOR-HIF-1α signaling might be associated with the shift in glucose metabolism and the activation of B cells, yet, we did not find that the intervention had an impact on the regulation of antibody IgG production. Under different stimulations to activate B cells, it is complicated processes involved in proliferation, cytokines production, plasmablast differentiation, antibody production and IgG class-switching, besides, these processes also related to other cellular metabolic patterns and regulatory pathways, which needs further research. In summary, mTOR-HIF-1α signaling could be the potential immunometabolism reprogramming checkpoint and therapeutic target of interventional glycolysis-dependent activation of B cells in MG, but the role in antigen-specific B cell and antibody production needs to be further investigated.
In CD4+ T cell subsets, the metabolic pathway influences the differentiation of naïve CD4+ T cells into Th1, Th2, Th17, or Tregs (33). The metabolic requirements of naïve CD4+ T cells are met by the oxidation of glucose and fatty acids via the mitochondrial β-oxidation and OXPHOS pathways (34). Activated CD4+ T cells rely on glycolysis to execute inflammatory effector functions (2,35). In our study, compared to HC, both Tregs and CD4+CD25− T cells showed increased levels of glycolysis. Although we used human T cells from healthy subjects as control, these T cells might be partially activated and differentiated, and hence, already presented a certain basal glycolytic state (35). However, when the HC were strictly selected, the observed effects could be disease specific (36). This may explain why the ECAR profiles were not typical in Tregs, CD4+CD25− T cells, and Th2, which responded to glucose injection with increased ECAR, but failed to show a further increase after injection of the oligomycin. The possible reasons could be as follows: (I) the basal activated state of human peripheral blood T cells is already altered by the environment; (II) the T cells might have entered into differentiated stage, where the metabolic flexibility is weakened, especially in the disease state; (III) the T cells themselves are mainly driven by glycolysis. After the injection with oligomycin, ATP synthesis is blocked, while the conversion of cellular metabolism from glycolysis to additional metabolic pattern is delayed or impaired. In the case of Tregs, the expression of CPT1A increased robustly, in addition to an increased tendency of OXPHOS parameters. These findings indicated that both glycolysis and OXPHOS were involved in the metabolism of Tregs. These observations are consistent with a previous study which reported that Tregs predominantly used mitochondrial FAO and aerobic glycolysis to fuel their differentiation and execute their suppressor functions (37). A recent study demonstrated that aerobic glycolysis played an important role in cell fate decisions and fitness of Tregs. Furthermore, this study showed that Tregs used glycolysis to achieve complete suppressor function (38). The PI3K/Akt-mTOR signaling axis largely controlled these metabolic programs (39), which tended to suppress FoxP3 expression and lineage stability of Tregs. Activation of HIF-1α directly targeted FoxP3 for degradation (40). We speculate that the decreased frequency, shift in metabolic pattern, and repair of suppressor function of Tregs exist in MG, and regulation of glycolysis levels might help to sustain the lineage stability of Tregs and recover the suppressive function. However, the link between metabolism and the function of Tregs is unknown yet, and further studies are needed to discover additional metabolic patterns and regulatory pathways.
Consistent with a previous research (2), there was an imbalance in CD4+ T subsets in our study, which showed that the ratio of Th2 decreased significantly while that of Th1 and Th17 increased significantly in MG patients. Regarding Th1, glycolysis is the dominant cellular metabolic pathway, and inhibition via 2-DG suppresses Th1 proliferation and survival (41). The AKT-mTOR axis controls metabolic rewiring to support Th1 differentiation; mTORC1 plays an important role in this process (42). HIF-1α exhibits enhanced transcription in Th1 cells under hypoxia (43). These reports support our findings which show significantly increased expression of mTORC1, HIF-1α, PFK, and PK, and increased tendency of glycolysis in MG patients. Similar to Th1, glycolysis is functionally important for Th17 differentiation in vitro and in vivo since it supports Th17 cell proliferation, survival, and the upregulation of RORγt expression (41,44). mTORC1 regulates the differentiation of Th17 from naïve T cells (42,44,45). The differentiation of Th17 cells is also dependent on another regulator of glycolysis, the transcription factor HIF-1α (44). HIF-1α is involved in maintaining the human Th17 cell population (46). We also found that the increased ratio of Th17 in CD4+ T cell subsets was accompanied by higher HIF-1α expression and significantly higher levels of glycolysis in MG. Blockade of glycolysis with 2-DG reduces the severity of EAE with an associated decrease in the percentage of Th17 (44). HIF-1α also supports Th17 differentiation via the promotion of the proteasomal degradation of FoxP3, which is a transcription factor that promotes the differentiation of Tregs (40,47). Previous studies have demonstrated a decreased frequency of Tregs in the PBMCs of MG patients (3,48). Treatment with 2-DG partially suppresses the proliferation of antigen-specific T cells and increases the relative frequency of Tregs in the transplant setting (49). Notably, the expression of key glycolytic enzymes and HIF-1α were increased in Tregs and Th17, and this increase may provide an approach to restore the balance between Tregs and Th17 via intervening glycolysis and HIF-1α. However, there were no significant differences in the expression of key glycolytic enzymes, glycolytic and OXPHOS parameters in Th2 cells of MG patients. In our opinion, this could be due to certain reasons as follows: (I) Th2 cells are sorted from humans, which may already be activated and metabolically stable regardless of HC or MG patients; (II) we sort the Th2 cells from the CD4+ T cells by FACS, marked CD4+CXCR3−CCR6−, which also includes the subsets of Th2, such as Th9 and Th22, whose metabolic state is unknown yet and might influence the results; (III) research demonstrates that amino acid uptake and metabolism also participate in Th2 metabolism. mTORC1 signaling supports the differentiation to Th1 and Th17 lineages, and mTORC2 specifically meets the requirement for Th2 lineage maturation (42). Dang et al. found that Th2 differentiation did not require HIF-1α (40). We might have to further investigate additional cellular metabolic patterns and metabolic regulatory molecules, such as glutamine uptake, mTORC2, c-MYC and SREBP. In summary, we propose that the imbalance of Th1, Tregs, and Th17, including activation, differentiation and effector functions may be associated with activated AKT-mTOR pathway and high expression of HIF-1α and influenced by glucose metabolism.
In the case of CD8+ T cells, naïve CD8+ T cells rely on the oxidation of fatty acids as a primary source of energy. Naïve CD8+ T cells exit quiescence and rapidly proliferate after encountering antigen and co-stimulatory signals and subsequently become effector T cells (TE) and distinct memory T cell (TM) subsets. Recent research has demonstrated that TE favored glycolysis and glutaminolysis over FAO, and TM favored FAO and OXPHOS (50). Different metabolic regulatory pathways are involved in TE and TM differentiation and function (51). In our study, we found that there was no significant difference in the expression levels of glycolytic enzymes, metabolic regulators, OXPHOS, and glycolytic parameters. Previous studies have indicated that the CD8+ T cell differentiation and function were mediated by multiple regulatory pathways, including the mTORC1-cMYC axis, mTORC1-HIF-1α, the MAPKs-AP4 axis, and the AMPK pathway. Given that the CD8+ T cells in peripheral blood in MG, as we studied, consists of various differentiated stages and subsets of cells, the mechanistic regulations of cellular metabolism in MG were distinct. In addition, a previous study has demonstrated that depletion of CD8+ T cells exerted a minor effect on the development of myasthenic weakness or anti-AChR antibody synthesis (52). Therefore, the role that metabolism plays in CD8+ T cells and its subsets should be further investigated in MG.
There are certain limitations to this study. First, the major cellular metabolic pathways of immune cells include glycolysis, glutaminolysis, fatty acid synthesis, FAO, and OXPHOS fueled by the tricarboxylic acid cycle, and multiple kinases and transcription factors that cooperatively regulate immune cell metabolism including ERK1/2, AKT, mTORC1, mTORC2, LKB1, AMPK, and PI3K. We only evaluated the mRNA levels of the key rate-limiting enzymes involved in glycolysis and key regulators of the PI3K/AKT/mTORC1-HIF-1α, but not the protein levels, by studying localization plus phosphorylation. Second, we used human T cells from healthy subjects as a control, which might be partially activated and differentiated. Third, we chose to sort some immune cells according to cell immunophenotype markers, such as CD4+ T subsets. Whether the CD4+CD25+ T cells represent the real metabolic pattern of CD4+CD25+FoxP3+ Tregs is not known, and the purity of cell sorting of CD4+CD25+ Tregs is approximately 85. Eight percent, this might also influence the results. In addition, the metabolic state of subsets of Th2 cells, such as Th9 and Th22, remains unknown yet.
Conclusions
In conclusion, this study is the first to investigate the cellular glucose metabolism in different subtypes of immune cells simultaneously, and demonstrate differences in glucose metabolic patterns in MG patients. The mTOR-HIF-1α signaling might be the potential immune metabolism reprogramming checkpoint of MG. This disease exhibits complex pathophysiological processes, and we speculate that intervening glycolysis and its regulatory pathway might control the tolerogenic vs. immunogenic effector functions of DCs, maintain the balance of CD4+ T cell subsets, regulate the differentiation and suppressive function of Tregs, inhibit B cell activation, and subsequently acquire immune tolerance. Apart from glycolysis, the metabolism of FAO and amino acids in other types of immune cells also needs further investigation.
Supplementary
The article’s supplementary files as
Acknowledgments
We thank the professor Shuang Liu for flow cytometry technology support. All volunteers who generously donated their blood towards this research were appreciated.
Funding: This study was supported by the National Natural Science Foundation of China (No. 81571173).
Ethical Statement: The authors are accountable for all aspects of the work in ensuring that questions related to the accuracy or integrity of any part of the work are appropriately investigated and resolved. All the procedures performed was approved by the ethical standards of the Ethics Committee for Human Research, Xiangya Hospital, Central South University (No. 201503282) and followed the tenets of the Declaration of Helsinki. Written informed consents have been obtained from all participants.
Footnotes
Conflicts of Interest: All authors have completed the ICMJE uniform disclosure form (available at http://dx.doi.org/10.21037/atm-20-918). The authors have no conflicts of interest to declare.
References
- 1.Gilhus NE. Myasthenia Gravis. N Engl J Med 2016;375:2570-81. 10.1056/NEJMra1602678 [DOI] [PubMed] [Google Scholar]
- 2.Mu L, Sun B, Kong Q, et al. Disequilibrium of T helper type 1, 2 and 17 cells and regulatory T cells during the development of experimental autoimmune myasthenia gravis. Immunology 2009;128:e826-36. 10.1111/j.1365-2567.2009.03089.x [DOI] [PMC free article] [PubMed] [Google Scholar]
- 3.Masuda M, Matsumoto M, Tanaka S, et al. Clinical implication of peripheral CD4+CD25+ regulatory T cells and Th17 cells in myasthenia gravis patients. J Neuroimmunol 2010;225:123-31. 10.1016/j.jneuroim.2010.03.016 [DOI] [PubMed] [Google Scholar]
- 4.Yin W, Ouyang S, Luo Z, et al. Immature Exosomes Derived from MicroRNA-146a Overexpressing Dendritic Cells Act as Antigen-Specific Therapy for Myasthenia Gravis. Inflammation 2017;40:1460-73. 10.1007/s10753-017-0589-2 [DOI] [PubMed] [Google Scholar]
- 5.Yi JS, Guptill JT, Stathopoulos P, et al. B cells in the pathophysiology of myasthenia gravis. Muscle Nerve 2018;57:172-84. 10.1002/mus.25973 [DOI] [PMC free article] [PubMed] [Google Scholar]
- 6.Yi JS, Guidon A, Sparks S, et al. Characterization of CD4 and CD8 T cell responses in MuSK myasthenia gravis. J Autoimmun 2014;52:130-8. 10.1016/j.jaut.2013.12.005 [DOI] [PMC free article] [PubMed] [Google Scholar]
- 7.Chapman NM, Shrestha S, Chi H. Metabolism in Immune Cell Differentiation and Function. Adv Exp Med Biol 2017;1011:1-85. 10.1007/978-94-024-1170-6_1 [DOI] [PubMed] [Google Scholar]
- 8.O'Sullivan D, Pearce EL. Targeting T cell metabolism for therapy. Trends Immunol 2015;36:71-80. 10.1016/j.it.2014.12.004 [DOI] [PMC free article] [PubMed] [Google Scholar]
- 9.Frauwirth KA, Riley JL, Harris MH, et al. The CD28 signaling pathway regulates glucose metabolism. Immunity 2002;16:769-77. 10.1016/S1074-7613(02)00323-0 [DOI] [PubMed] [Google Scholar]
- 10.Everts B, Amiel E, van der Windt GJ, et al. Commitment to glycolysis sustains survival of NO-producing inflammatory dendritic cells. Blood 2012;120:1422-31. 10.1182/blood-2012-03-419747 [DOI] [PMC free article] [PubMed] [Google Scholar]
- 11.Maciolek JA, Pasternak JA, Wilson HL. Metabolism of activated T lymphocytes. Curr Opin Immunol 2014;27:60-74. 10.1016/j.coi.2014.01.006 [DOI] [PubMed] [Google Scholar]
- 12.Everts B, Pearce EJ. Metabolic control of dendritic cell activation and function: recent advances and clinical implications. Front Immunol 2014;5:203. [DOI] [PMC free article] [PubMed] [Google Scholar]
- 13.Sandoval H, Kodali S, Wang J. Regulation of B cell fate, survival, and function by mitochondria and autophagy. Mitochondrion 2018;41:58-65. 10.1016/j.mito.2017.11.005 [DOI] [PMC free article] [PubMed] [Google Scholar]
- 14.Everts B, Amiel E, Huang SC, et al. TLR-driven early glycolytic reprogramming via the kinases TBK1-IKKvarepsilon supports the anabolic demands of dendritic cell activation. Nat Immunol 2014;15:323-32. 10.1038/ni.2833 [DOI] [PMC free article] [PubMed] [Google Scholar]
- 15.Jones RG, Pearce EJ. MenTORing Immunity: mTOR Signaling in the Development and Function of Tissue-Resident Immune Cells. Immunity 2017;46:730-42. 10.1016/j.immuni.2017.04.028 [DOI] [PMC free article] [PubMed] [Google Scholar]
- 16.Ganeshan K, Chawla A. Metabolic regulation of immune responses. Annu Rev Immunol 2014;32:609-34. 10.1146/annurev-immunol-032713-120236 [DOI] [PMC free article] [PubMed] [Google Scholar]
- 17.Doughty CA, Bleiman BF, Wagner DJ, et al. Antigen receptor-mediated changes in glucose metabolism in B lymphocytes: role of phosphatidylinositol 3-kinase signaling in the glycolytic control of growth. Blood 2006;107:4458-65. 10.1182/blood-2005-12-4788 [DOI] [PMC free article] [PubMed] [Google Scholar]
- 18.Jellusova J, Rickert RC. The PI3K pathway in B cell metabolism. Crit Rev Biochem Mol Biol 2016;51:359-78. 10.1080/10409238.2016.1215288 [DOI] [PMC free article] [PubMed] [Google Scholar]
- 19.Sintes J, Gentile M, Zhang S, et al. mTOR intersects antibody-inducing signals from TACI in marginal zone B cells. Nat Commun 2017;8:1462. 10.1038/s41467-017-01602-4 [DOI] [PMC free article] [PubMed] [Google Scholar]
- 20.Yin Y, Choi SC, Xu Z, et al. Glucose Oxidation Is Critical for CD4+ T Cell Activation in a Mouse Model of Systemic Lupus Erythematosus. J Immunol 2016;196:80-90. 10.4049/jimmunol.1501537 [DOI] [PMC free article] [PubMed] [Google Scholar]
- 21.Yang Z, Shen Y, Oishi H, et al. Restoring oxidant signaling suppresses proarthritogenic T cell effector functions in rheumatoid arthritis. Sci Transl Med 2016;8:331ra38. 10.1126/scitranslmed.aad7151 [DOI] [PMC free article] [PubMed] [Google Scholar]
- 22.Cossarizza A, Chang HD, Radbruch A, et al. Guidelines for the use of flow cytometry and cell sorting in immunological studies. Eur J Immunol 2017;47:1584-797. 10.1002/eji.201646632 [DOI] [PMC free article] [PubMed] [Google Scholar]
- 23.Maecker HT, McCoy JP, Nussenblatt R. Standardizing immunophenotyping for the Human Immunology Project. Nat Rev Immunol 2012;12:191-200. 10.1038/nri3158 [DOI] [PMC free article] [PubMed] [Google Scholar]
- 24.Lee SC, Marzec M, Liu X, et al. Decreased lactate concentration and glycolytic enzyme expression reflect inhibition of mTOR signal transduction pathway in B-cell lymphoma. NMR Biomed 2013;26:106-14. 10.1002/nbm.2825 [DOI] [PMC free article] [PubMed] [Google Scholar]
- 25.Zhu Y, Zang Y, Zhao F, et al. Inhibition of HIF-1alpha by PX-478 suppresses tumor growth of esophageal squamous cell cancer in vitro and in vivo. Am J Cancer Res 2017;7:1198-212. [PMC free article] [PubMed] [Google Scholar]
- 26.Steinman RM, Turley S, Mellman I, et al. The induction of tolerance by dendritic cells that have captured apoptotic cells. J Exp Med 2000;191:411-6. 10.1084/jem.191.3.411 [DOI] [PMC free article] [PubMed] [Google Scholar]
- 27.Banchereau J, Briere F, Caux C, et al. Immunobiology of dendritic cells. Annu Rev Immunol 2000;18:767-811. 10.1146/annurev.immunol.18.1.767 [DOI] [PubMed] [Google Scholar]
- 28.Dufort FJ, Bleiman BF, Gumina MR, et al. Cutting edge: IL-4-mediated protection of primary B lymphocytes from apoptosis via Stat6-dependent regulation of glycolytic metabolism. J Immunol 2007;179:4953-7. 10.4049/jimmunol.179.8.4953 [DOI] [PubMed] [Google Scholar]
- 29.Caro-Maldonado A, Wang R, Nichols AG, et al. Metabolic reprogramming is required for antibody production that is suppressed in anergic but exaggerated in chronically BAFF-exposed B cells. J Immunol 2014;192:3626-36. 10.4049/jimmunol.1302062 [DOI] [PMC free article] [PubMed] [Google Scholar]
- 30.Woodland RT, Fox CJ, Schmidt MR, et al. Multiple signaling pathways promote B lymphocyte stimulator dependent B-cell growth and survival. Blood 2008;111:750-60. 10.1182/blood-2007-03-077222 [DOI] [PMC free article] [PubMed] [Google Scholar]
- 31.Meng X, Grotsch B, Luo Y, et al. Hypoxia-inducible factor-1α is a critical transcription factor for IL-10-producing B cells in autoimmune disease. Nat Commun 2018;9:251. 10.1038/s41467-017-02683-x [DOI] [PMC free article] [PubMed] [Google Scholar]
- 32.Torigoe M, Iwata S, Nakayamada S, et al. Metabolic Reprogramming Commits Differentiation of Human CD27(+)IgD(+) B Cells to Plasmablasts or CD27(-)IgD(-) Cells. J Immunol 2017;199:425-34. 10.4049/jimmunol.1601908 [DOI] [PubMed] [Google Scholar]
- 33.Zhu J, Yamane H, Paul WE. Differentiation of effector CD4 T cell populations (*). Annu Rev Immunol 2010;28:445-89. 10.1146/annurev-immunol-030409-101212 [DOI] [PMC free article] [PubMed] [Google Scholar]
- 34.Rathmell JC, Vander Heiden MG, Harris MH, et al. In the absence of extrinsic signals, nutrient utilization by lymphocytes is insufficient to maintain either cell size or viability. Mol Cell 2000;6:683-92. 10.1016/S1097-2765(00)00066-6 [DOI] [PubMed] [Google Scholar]
- 35.Yin Y, Choi SC, Xu Z, et al. Normalization of CD4+ T cell metabolism reverses lupus. Sci Transl Med 2015;7:274ra18. 10.1126/scitranslmed.aaa0835 [DOI] [PMC free article] [PubMed] [Google Scholar]
- 36.Jones N, Cronin JG, Dolton G, et al. Metabolic Adaptation of Human CD4(+) and CD8(+) T-Cells to T-Cell Receptor-Mediated Stimulation. Front Immunol 2017;8:1516. 10.3389/fimmu.2017.01516 [DOI] [PMC free article] [PubMed] [Google Scholar]
- 37.Michalek RD, Gerriets VA, Jacobs SR, et al. Cutting edge: distinct glycolytic and lipid oxidative metabolic programs are essential for effector and regulatory CD4+ T cell subsets. J Immunol 2011;186:3299-303. 10.4049/jimmunol.1003613 [DOI] [PMC free article] [PubMed] [Google Scholar]
- 38.Gerriets VA, Kishton RJ, Johnson MO, et al. Foxp3 and Toll-like receptor signaling balance Treg cell anabolic metabolism for suppression. Nat Immunol 2016;17:1459-66. 10.1038/ni.3577 [DOI] [PMC free article] [PubMed] [Google Scholar]
- 39.Shimobayashi M, Hall MN. Making new contacts: the mTOR network in metabolism and signalling crosstalk. Nat Rev Mol Cell Biol 2014;15:155-62. 10.1038/nrm3757 [DOI] [PubMed] [Google Scholar]
- 40.Dang EV, Barbi J, Yang HY, et al. Control of T(H)17/T(reg) balance by hypoxia-inducible factor 1. Cell 2011;146:772-84. 10.1016/j.cell.2011.07.033 [DOI] [PMC free article] [PubMed] [Google Scholar]
- 41.Gerriets VA, Kishton RJ, Nichols AG, et al. Metabolic programming and PDHK1 control CD4+ T cell subsets and inflammation. J Clin Invest 2015;125:194-207. 10.1172/JCI76012 [DOI] [PMC free article] [PubMed] [Google Scholar]
- 42.Delgoffe GM, Pollizzi KN, Waickman AT, et al. The kinase mTOR regulates the differentiation of helper T cells through the selective activation of signaling by mTORC1 and mTORC2. Nat Immunol 2011;12:295-303. 10.1038/ni.2005 [DOI] [PMC free article] [PubMed] [Google Scholar]
- 43.Shehade H, Acolty V, Moser M, et al. Cutting Edge: Hypoxia-Inducible Factor 1 Negatively Regulates Th1 Function. J Immunol 2015;195:1372-6. 10.4049/jimmunol.1402552 [DOI] [PubMed] [Google Scholar]
- 44.Shi LZ, Wang R, Huang G, et al. HIF1alpha-dependent glycolytic pathway orchestrates a metabolic checkpoint for the differentiation of TH17 and Treg cells. J Exp Med 2011;208:1367-76. 10.1084/jem.20110278 [DOI] [PMC free article] [PubMed] [Google Scholar]
- 45.Delgoffe GM, Kole TP, Zheng Y, et al. The mTOR kinase differentially regulates effector and regulatory T cell lineage commitment. Immunity 2009;30:832-44. 10.1016/j.immuni.2009.04.014 [DOI] [PMC free article] [PubMed] [Google Scholar]
- 46.Kryczek I, Zhao E, Liu Y, et al. Human TH17 cells are long-lived effector memory cells. Sci Transl Med 2011;3:104ra100. 10.1126/scitranslmed.3002949 [DOI] [PMC free article] [PubMed] [Google Scholar]
- 47.Hori S, Nomura T, Sakaguchi S. Control of regulatory T cell development by the transcription factor Foxp3. Science 2003;299:1057-61. 10.1126/science.1079490 [DOI] [PubMed] [Google Scholar]
- 48.Li Y, Yang S, Li Z, et al. Soluble glucocorticoid-induced tumor necrosis factor receptor regulates Helios expression in myasthenia gravis. J Transl Med 2019;17:168. 10.1186/s12967-019-1916-1 [DOI] [PMC free article] [PubMed] [Google Scholar]
- 49.Lee CF, Lo YC, Cheng CH, et al. Preventing Allograft Rejection by Targeting Immune Metabolism. Cell Rep 2015;13:760-70. 10.1016/j.celrep.2015.09.036 [DOI] [PMC free article] [PubMed] [Google Scholar]
- 50.van der Windt GJ, Everts B, Chang CH, et al. Mitochondrial respiratory capacity is a critical regulator of CD8+ T cell memory development. Immunity 2012;36:68-78. 10.1016/j.immuni.2011.12.007 [DOI] [PMC free article] [PubMed] [Google Scholar]
- 51.Hukelmann JL, Anderson KE, Sinclair LV, et al. The cytotoxic T cell proteome and its shaping by the kinase mTOR. Nat Immunol 2016;17:104-12. 10.1038/ni.3314 [DOI] [PMC free article] [PubMed] [Google Scholar]
- 52.Wang ZY, Karachunski PI, Howard JF, Jr, et al. Myasthenia in SCID mice grafted with myasthenic patient lymphocytes: role of CD4+ and CD8+ cells. Neurology 1999;52:484-97. 10.1212/WNL.52.3.484 [DOI] [PubMed] [Google Scholar]
Associated Data
This section collects any data citations, data availability statements, or supplementary materials included in this article.
Supplementary Materials
The article’s supplementary files as


