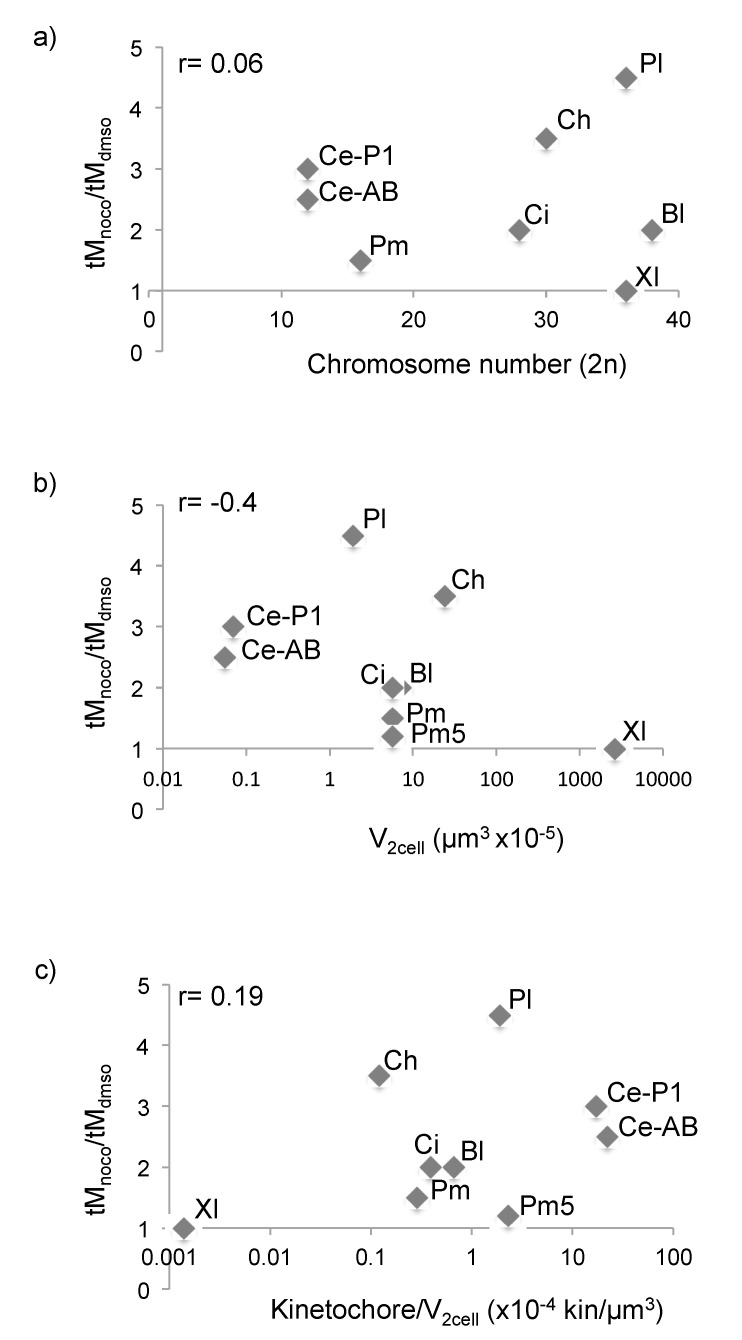
Figure 5.
SAC response across species does not correlate with cell volume. (a–c) Ratio of average mitotic duration in nocodazole- and DMSO-treated embryos plotted against (a) chromosome number, (b) cell volume at 2-cell stage or (c) kinetochore/cell volume ratio at 2-cell stage. Bl = B. lanceolatum, Ci = C. intestinalis, Ce = C. elegans, Pl = P. lividus, Pm = P. mammillata, Pm5 = ratio after 4 cycles in nocodazole from Figure 3b, Ch = C. hemisphaerica and Xl = X. laevis. For Bl and Ci, mitotic duration was estimated from the time course graphs in Figure 4a,d, as width of the curve at 50% level. Ce and Xl data were obtained from the literature. For Ce, as the first division is asymmetric, both cells are presented (AB and P1). r indicates the coefficient of correlation for each set of variables.

