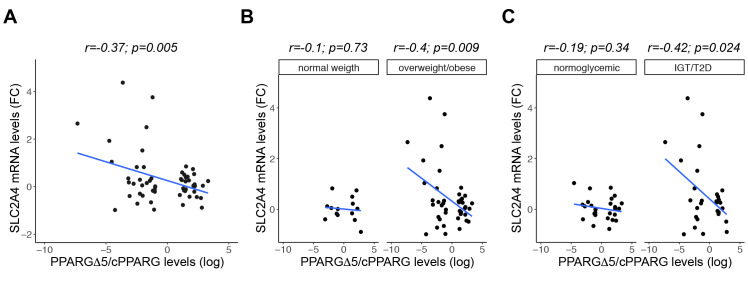
Figure 7.
PPARGΔ5/cPPARG ratio correlates with SLC2A4 levels. PPARGΔ5 and cPPARG expression was previously measured in Aprile et al. (2018). (A–C) Scatterplot reporting the correlations by linear regression analysis between SLC2A4 and PPARGΔ5/cPPARG levels (qPCR) in the SAT of a subset of individuals (n = 56), stratified in subgroups according to BMI in normal weight (n = 14) and overweight/obese (n = 42), or to glucose-metabolizing capacity in NGT (n = 27), IGT and T2D (n = 29). RPS23 was used as reference gene. Pearson’s correlation coefficient (r) and p values (p) are shown.

