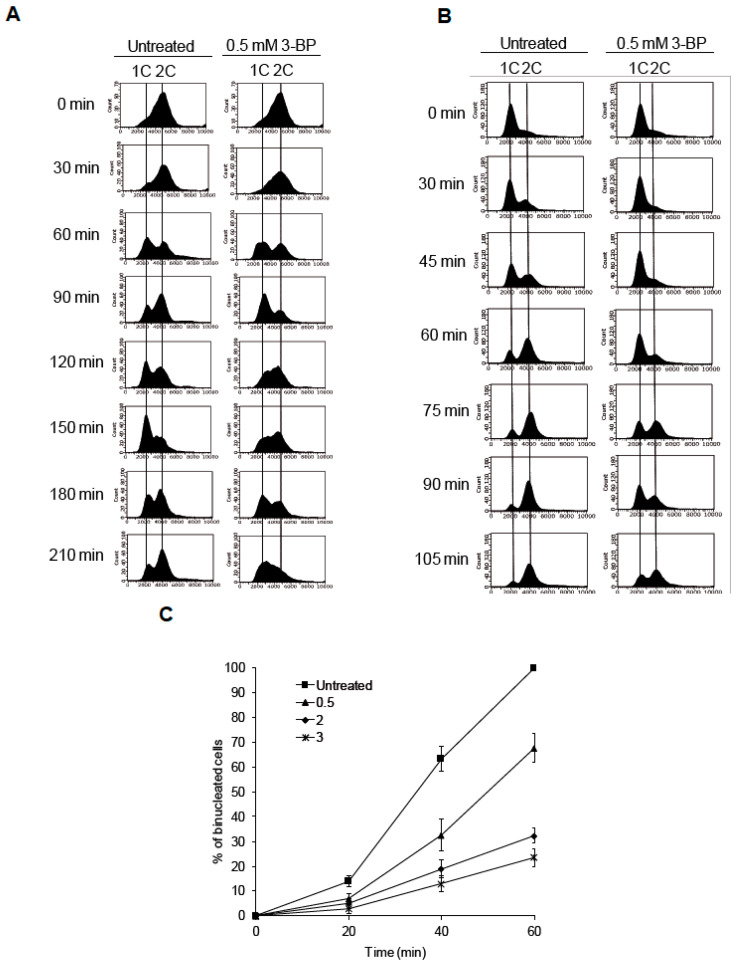
Figure 3.
Cell cycle analysis of cells treated with 3-BP: (A) Cells exposed to 3-BP show slower progression through S phase of the cell cycle. Wild type cells were synchronized in G2 phase with nocodazole then washed and resuspended in fresh medium in the presence or absence of 3-BP. At indicated time points cells were collected and processed for flow cytometry analysis. (B) Cells treated with 3-BP accumulate at the G1/S boundary. To determine the fraction of cells remaining in the G1 cell cycle phase after 3-BP exposure, an α-factor-nocodazole trap assay was performed. Cell cycle distribution was assessed by flow cytometry. (C) Presence of 3-BP delays cell progression into mitosis. Wild type cells were synchronized in G2 phase with nocodazole then washed and resuspended in fresh medium in the presence or absence of 3-BP. At indicated time points cells were collected and stained. The percentage of bi-nucleate cells was counted using fluorescent microscopy.

