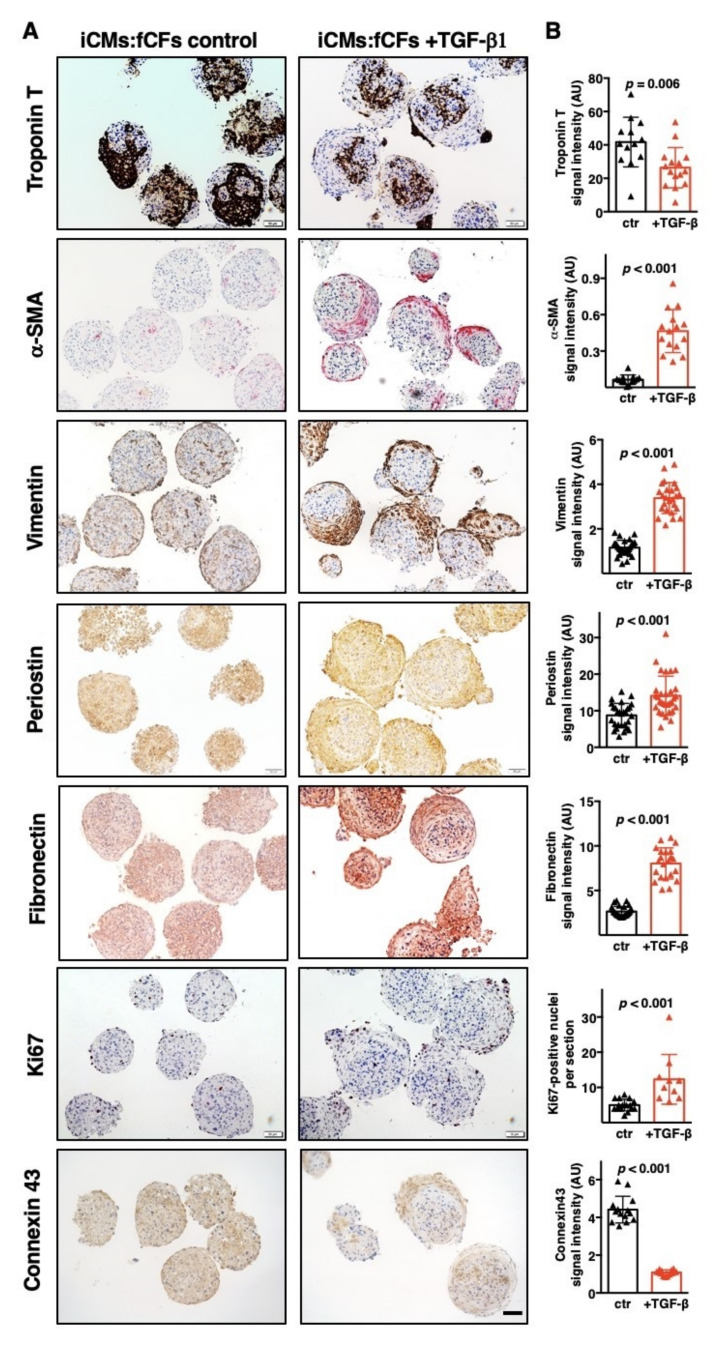
Figure 3.
TGF-β1 induces fibrotic phenotype in cardiac microtissues. Immunohistochemistry of iCMs:fCFs microtissues cultured in the presence or absence of TGF-β1 (10 ng/mL) at day 10. Panel (A) illustrates representative staining for the indicated proteins at the indicated condition (bar = 50 μm). Higher magnification pictures are available in the Supplementary Materials (Figure S3). Panel (B) shows quantification of the respective staining for microtissues cultured in the presence (red) or absence (black) of TGF-β1. Graphs show cumulative data of 3 independent experiments. Each triangle represents data for one microtissue. p values were calculated with the Student’s t-test.

