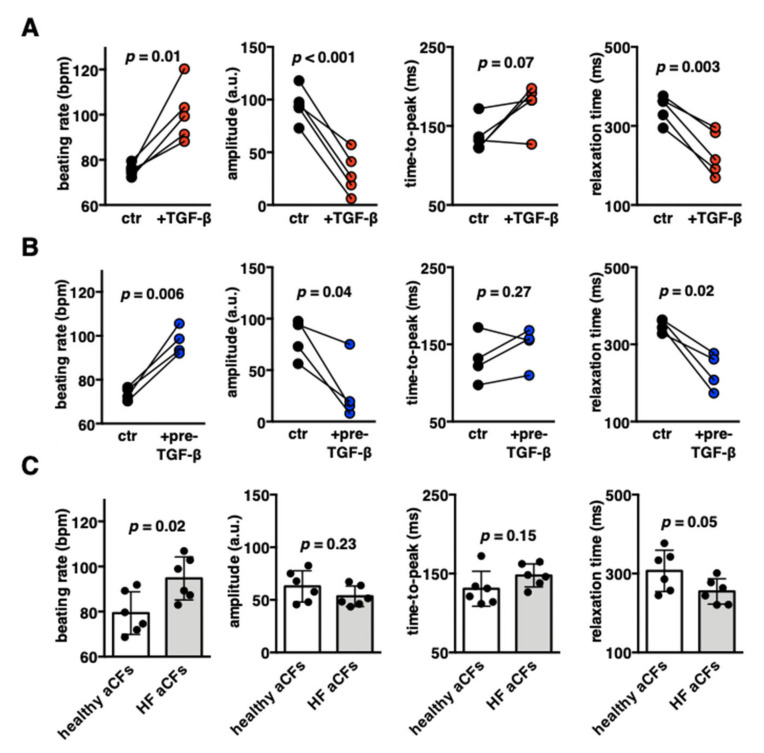
Figure 5.
Contractile properties of cardiac microtissues containing foetal or adult cardiac fibroblasts. Panel (A) shows quantification of contraction parameters of iCMs:fCFs microtissues cultured in the presence (red) or absence (black) of TGF-β1 (10 ng/mL) at day 10. Quantification of contraction parameters of microtissues containing fCFs pretreated with TGF-β1 for 3 days prior microtissue formation (blue) or untreated fCFs (black) recorded at day 10 are shown in panel (B). Each dot represents average data of one experiment. Data of individual experiments are available in the Supplementary Materials (Figures S5 and S8). p values were calculated with the paired Student’s t-test. Panel (C) shows quantification of contraction parameters of cardiac microtissues containing aCFs from unaffected hearts (white) or heart failure (HF) patients (grey). Each dot represents average data of one experiment (n = 14–18). p values were calculated with the Student’s t-test. Representative contraction records are available in the Supplementary Materials (Figures S5, S10B and S11 and Videos S2–S6).

