Figure 3.
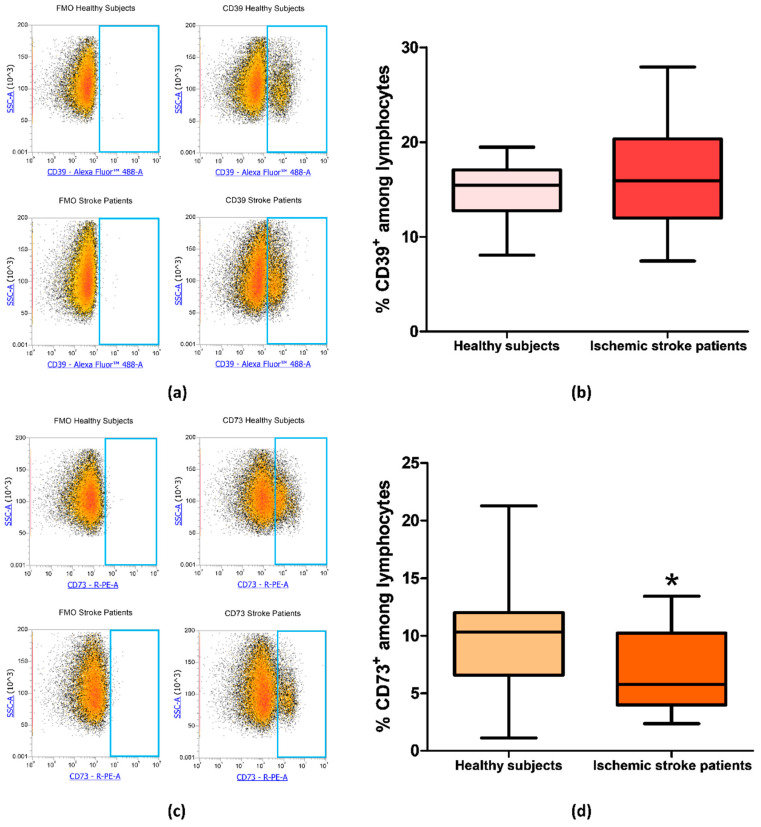
(a) Representative flow cytometry density plots showing FMO control and CD39 stained cells in lymphocytes from healthy subjects and ischemic stroke patients. (b) Graphical representation of flow cytometry data showing the percentage of CD39+ lymphocytes in healthy subjects (n = 20) and ischemic stroke patients (n = 21). (c) Representative density plots showing FMO control CD73 stained cells in lymphocytes from healthy subjects and ischemic stroke patients. (d) Box and whiskers plot showing the percentage of CD73+ lymphocytes in healthy subjects (n = 20) and ischemic stroke patients (n = 21). Data are shown as the median, interquartile range and the minimum and maximum values. * p < 0.05 vs healthy subjects.

